Rangeley Airbnb Market Analysis 2026: Short Term Rental Data & Vacation Rental Statistics in Maine, United States
Is Airbnb profitable in Rangeley in 2026? Explore comprehensive Airbnb analytics for Rangeley, Maine, United States to uncover income potential. This 2026 STR market report for Rangeley, based on AirROI data from February 2025 to January 2026, reveals key trends in the market of 294 active listings.
Whether you're considering an Airbnb investment in Rangeley, optimizing your existing vacation rental, or exploring rental arbitrage opportunities, understanding the Rangeley Airbnb data is crucial. Leveraging the low regulation environment is key to maximizing your short term rental income potential. Let's dive into the specifics.
Key Rangeley Airbnb Performance Metrics Overview
Monthly Airbnb Revenue Variations & Income Potential in Rangeley (2026)
Understanding the monthly revenue variations for Airbnb listings in Rangeley is key to maximizing your short term rental income potential. Seasonality significantly impacts earnings. Our analysis, based on data from the past 12 months, shows that the peak revenue month for STRs in Rangeley is typically August, while April often presents the lowest earnings, highlighting opportunities for strategic pricing adjustments during shoulder and low seasons. Explore the typical Airbnb income in Rangeley across different performance tiers:
- Best-in-class properties (Top 10%) achieve $7,743+ monthly, often utilizing dynamic pricing and superior guest experiences.
- Strong performing properties (Top 25%) earn $4,821 or more, indicating effective management and desirable locations/amenities.
- Typical properties (Median) generate around $2,818 per month, representing the average market performance.
- Entry-level properties (Bottom 25%) see earnings around $1,551, often with potential for optimization.
Average Monthly Airbnb Earnings Trend in Rangeley
Rangeley Airbnb Occupancy Rate Trends (2026)
Maximize your bookings by understanding the Rangeley STR occupancy trends. Seasonal demand shifts significantly influence how often properties are booked. Typically, Februarysees the highest demand (peak season occupancy), while December experiences the lowest (low season). Effective strategies, like adjusting minimum stays or offering promotions, can boost occupancy during slower periods. Here's how different property tiers perform in Rangeley:
- Best-in-class properties (Top 10%) achieve 63%+ occupancy, indicating high desirability and potentially optimized availability.
- Strong performing properties (Top 25%) maintain 44% or higher occupancy, suggesting good market fit and guest satisfaction.
- Typical properties (Median) have an occupancy rate around 28%.
- Entry-level properties (Bottom 25%) average 16% occupancy, potentially facing higher vacancy.
Average Monthly Occupancy Rate Trend in Rangeley
Average Daily Rate (ADR) Airbnb Trends in Rangeley (2026)
Effective short term rental pricing strategy in Rangeley involves understanding monthly ADR fluctuations. The Average Daily Rate (ADR) for Airbnb in Rangeley typically peaks in January and dips lowest during April. Leveraging Airbnb dynamic pricing tools or strategies based on this seasonality can significantly boost revenue. Here's a look at the typical nightly rates achieved:
- Best-in-class properties (Top 10%) command rates of $764+ per night, often due to premium features or locations.
- Strong performing properties (Top 25%) achieve nightly rates of $544 or more.
- Typical properties (Median) charge around $364 per night.
- Entry-level properties (Bottom 25%) earn around $243 per night.
Average Daily Rate (ADR) Trend by Month in Rangeley
Get Live Rangeley Market Intelligence 👇

Explore Real-time Analytics
Airbnb Seasonality Analysis & Trends in Rangeley (2026)
Peak Season (August, July, February)
- Revenue averages $5,803 per month
- Occupancy rates average 45.3%
- Daily rates average $431
Shoulder Season
- Revenue averages $3,660 per month
- Occupancy maintains around 28.1%
- Daily rates hold near $457
Low Season (April, May, November)
- Revenue drops to average $2,552 per month
- Occupancy decreases to average 25.5%
- Daily rates adjust to average $419
Seasonality Insights for Rangeley
- The Airbnb seasonality in Rangeley shows highly seasonal trends requiring careful strategy. While the sections above show seasonal averages, it's also insightful to look at the extremes:
- During the high season, the absolute peak month showcases Rangeley's highest earning potential, with monthly revenues capable of climbing to $5,916, occupancy reaching a high of 51.6%, and ADRs peaking at $497.
- Conversely, the slowest single month of the year, typically falling within the low season, marks the market's lowest point. In this month, revenue might dip to $1,821, occupancy could drop to 21.5%, and ADRs may adjust down to $388.
- Understanding both the seasonal averages and these monthly peaks and troughs in revenue, occupancy, and ADR is crucial for maximizing your Airbnb profit potential in Rangeley.
Seasonal Strategies for Maximizing Profit
- Peak Season: Maximize revenue through premium pricing and potentially longer minimum stays. Ensure high availability.
- Low Season: Offer competitive pricing, special promotions (e.g., extended stay discounts), and flexible cancellation policies. Target off-season travelers like remote workers or budget-conscious guests.
- Shoulder Seasons: Implement dynamic pricing that balances peak and low rates. Target weekend travelers or specific events. Offer slightly more flexible terms than peak season.
- Regularly analyze your own performance against these Rangeley seasonality benchmarks and adjust your pricing and availability strategy accordingly.
Best Areas for Airbnb Investment in Rangeley (2026)
Exploring the top neighborhoods for short-term rentals in Rangeley? This section highlights key areas, outlining why they are attractive for hosts and guests, along with notable local attractions. Consider these locations based on your target guest profile and investment strategy.
| Neighborhood / Area | Why Host Here? (Target Guests & Appeal) | Key Attractions & Landmarks |
|---|---|---|
| Oquossoc | Oquossoc is a charming village known for its beautiful lake views and recreational opportunities. It's a popular spot for fishing, boating, and hiking, attracting outdoor enthusiasts year-round. | Mooselookmeguntic Lake, Rangeley Lake State Park, Rangeley Lakes Region Logging Museum, Oquossoc Grocery, Rangeley Outdoor Sporting Heritage Museum |
| Rangeley Lake | Rangeley Lake offers stunning sceneries and excellent water sports activities. This area is perfect for families looking for a getaway with plenty of outdoor activities. | Rangeley Lake, Boat launches, Swimming areas, Public beaches |
| Carrabassett Valley | Carrabassett Valley is near the Sugarloaf Mountain and is a hub for winter sports. It's ideal for visitors looking for skiing, snowboarding, and hiking during the summer months. | Sugarloaf Mountain, Anti-Gravity Center, Carrabassett Coffee Company, Sugarloaf Golf Club |
| Mooselookmeguntic | Known for its fishing and tranquil environment, Mooselookmeguntic is perfect for those looking to escape the hustle and enjoy nature. Visitors come for the peace and the beautiful lake. | Mooselookmeguntic Lake, Hatchery Brook, Fishing spots, Campgrounds |
| Rangeley Town | The center of the Rangeley Lakes Region, this area has a rich history and is close to shops, restaurants, and local attractions, making it convenient for families and visitors. | Rangeley Inn, Rangeley Town Park, Rangeley History Museum, Local shops and restaurants |
| Height of Land | This area is famous for its panoramic views and is a popular scenic stop for travelers. The breathtaking scenery makes it ideal for leisure travelers looking to take photos and enjoy nature. | Height of Land Scenic Overlook, Sandy River, Fall foliage views |
| Sandy River | A great area for families and outdoor lovers, Sandy River provides access to swimming and picnicking, making it perfect for summer days spent in nature. | Sandy River, Public beaches, Picnic areas, Swimming holes |
| South Rangeley | A tranquil yet accessible area for visitors wanting to explore less crowded locations. Perfect for those wishing to enjoy nature and local wildlife. | Nature trails, Quiet lakes, Wildlife watching spots |
Understanding Airbnb License Requirements & STR Laws in Rangeley (2026)
While Rangeley, Maine, United States currently shows low STR regulations, specific Airbnb license requirements might still exist or change. Always verify the latest short term rental regulations and Airbnb license requirements directly with local government authorities for Rangeley to ensure full compliance before hosting.
(Source: AirROI data, 2026, based on 0% licensed listings)
Top Performing Airbnb Properties in Rangeley (2026)
Benchmark your potential! Explore examples of top-performing Airbnb properties in Rangeleybased on Trailing Twelve Month (TTM) revenue. Analyze their characteristics, revenue, occupancy rate, and ADR to understand what drives success in this market.
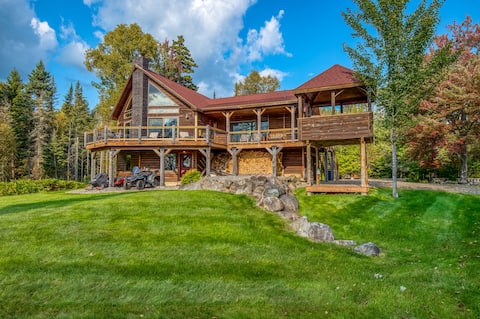
The Dunn Main House - Gorgeous home on the Lake
Entire Place • 6 bedrooms
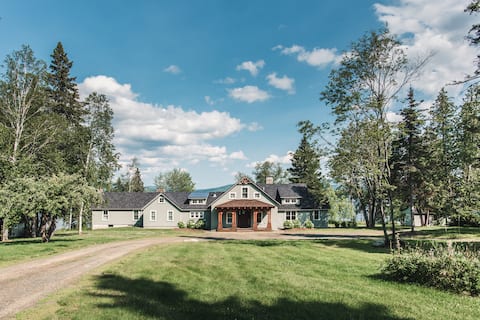
The Dunn Compound- On Mooselookmeguntic Lake!
Entire Place • 8 bedrooms
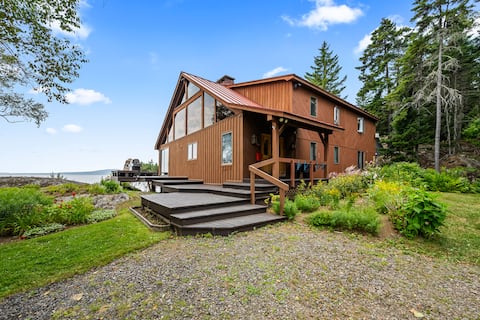
Breathtaking views of Rangeley Lake
Entire Place • 8 bedrooms

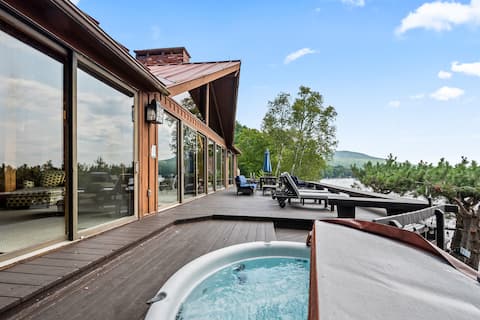
Windy Cross | Lakefront Escape & Hot Tub Bliss
Entire Place • 5 bedrooms
Haley Pond Haven - great Depot St location!
Entire Place • 5 bedrooms
Hart | Beautiful family getaway & close to town
Entire Place • 5 bedrooms
Note: Performance varies based on location, size, amenities, seasonality, and management quality. Data reflects the past 12 months.
Top Performing Airbnb Hosts in Rangeley (2026)
Learn from the best! This table showcases top-performing Airbnb hosts in Rangeley based on the number of properties managed and estimated total revenue over the past year. Analyze their scale and performance metrics.
| Host Name | Properties | Grossing Revenue | Stay Reviews | Avg Rating |
|---|---|---|---|---|
| Morton And Furbish Vacation Re | 139 | $4,281,053 | 553 | 4.84/5.0 |
| Kelly | 33 | $569,074 | 999 | 4.71/5.0 |
| Scott | 2 | $170,054 | 89 | 4.98/5.0 |
| Conor And Tamara | 2 | $169,986 | 192 | 4.84/5.0 |
| Joy | 3 | $132,232 | 118 | 4.89/5.0 |
| Evolve | 4 | $131,609 | 104 | 4.87/5.0 |
| Rise & Shine Retreats | 3 | $101,413 | 40 | 4.93/5.0 |
| Victoria | 2 | $80,938 | 86 | 4.98/5.0 |
| Megan | 3 | $75,671 | 180 | 4.97/5.0 |
| Kyle | 1 | $68,852 | 60 | 4.98/5.0 |
Analyzing the strategies of top hosts, such as their property selection, pricing, and guest communication, can offer valuable lessons for optimizing your own Airbnb operations in Rangeley.
Dive Deeper: Advanced Rangeley STR Market Data (2026)
Ready to unlock more insights? AirROI provides access to advanced metrics and comprehensive Airbnb data for Rangeley. Explore detailed analytics beyond this report to refine your investment strategy, optimize pricing, and maximize your vacation rental profits.
Explore Advanced MetricsRangeley Short-Term Rental Market Composition (2026): Property & Room Types
Room Type Distribution
Property Type Distribution
Market Composition Insights for Rangeley
- The Rangeley Airbnb market composition is heavily skewed towards Entire Home/Apt listings, which make up 99.3% of the 294 active rentals. This indicates strong guest preference for privacy and space.
- Looking at the property type distribution in Rangeley, House properties are the most common (73.5%), reflecting the local real estate landscape.
- Houses represent a significant 73.5% portion, catering likely to families or larger groups.
- Smaller segments like hotel/boutique (combined 0.7%) offer potential for unique stay experiences.
Rangeley Airbnb Room Capacity Analysis (2026): Bedroom Distribution
Distribution of Listings by Number of Bedrooms
Room Capacity Insights for Rangeley
- The dominant room capacity in Rangeley is 3 bedrooms listings, making up 35.4% of the market. This suggests a strong demand for properties suitable for families or small groups.
- Together, 3 bedrooms and 2 bedrooms properties represent 57.8% of the active Airbnb listings in Rangeley, indicating a high concentration in these sizes.
- A significant 64.3% of listings offer 3+ bedrooms, catering to larger groups and families seeking more space in Rangeley.
Rangeley Vacation Rental Guest Capacity Trends (2026)
Distribution of Listings by Guest Capacity
Guest Capacity Insights for Rangeley
- The most common guest capacity trend in Rangeley vacation rentals is listings accommodating 8+ guests (52.7%). This suggests the primary traveler segment is likely larger groups.
- Properties designed for 8+ guests and 6 guests dominate the Rangeley STR market, accounting for 72.8% of listings.
- 75.5% of properties accommodate 6+ guests, serving the market segment for larger families or group travel in Rangeley.
- On average, properties in Rangeley are equipped to host 6.5 guests.
Rangeley Airbnb Booking Patterns (2026): Available vs. Booked Days
Available Days Distribution
Booked Days Distribution
Booking Pattern Insights for Rangeley
- The most common availability pattern in Rangeley falls within the 271-366 days range, representing 76.2% of listings. This suggests many properties have significant open periods on their calendars.
- Approximately 97.6% of listings show high availability (181+ days open annually), indicating potential for increased bookings or specific owner usage patterns.
- For booked days, the 31-90 days range is most frequent in Rangeley (47.6%), reflecting common guest stay durations or potential owner blocking patterns.
- A notable 2.7% of properties secure long booking periods (181+ days booked per year), highlighting successful long-term rental strategies or significant owner usage.
Rangeley Airbnb Minimum Stay Requirements Analysis
Distribution of Listings by Minimum Night Requirement
1 Night
6 listings
2% of total
2 Nights
146 listings
49.7% of total
3 Nights
17 listings
5.8% of total
4-6 Nights
12 listings
4.1% of total
7-29 Nights
2 listings
0.7% of total
30+ Nights
111 listings
37.8% of total
Key Insights
- The most prevalent minimum stay requirement in Rangeley is 2 Nights, adopted by 49.7% of listings. This highlights the market's preference for shorter, flexible bookings.
- A significant segment (37.8%) caters to monthly stays (30+ nights) in Rangeley, pointing to opportunities in the extended-stay market.
Recommendations
- Align with the market by considering a 2 Nights minimum stay, as 49.7% of Rangeley hosts use this setting.
- If feasible, allowing 1-night stays, especially midweek or during low season, could capture last-minute bookings, as only 2% currently do.
- A 2-night minimum appears standard (49.7%). Consider this for weekends or peak periods.
- Explore offering discounts for stays of 30+ nights to attract the 37.8% of the market seeking extended stays.
- Adjust minimum nights based on seasonality – potentially shorter during low season and longer during peak demand periods in Rangeley.
Rangeley Airbnb Cancellation Policy Trends Analysis (2026)
Limited
4 listings
1.4% of total
Flexible
36 listings
12.3% of total
Moderate
39 listings
13.4% of total
Firm
167 listings
57.2% of total
Strict
46 listings
15.8% of total
Cancellation Policy Insights for Rangeley
- The prevailing Airbnb cancellation policy trend in Rangeley is Firm, used by 57.2% of listings.
- A majority (73.0%) of hosts in Rangeley utilize Firm or Strict policies, indicating a market where hosts prioritize booking security.
Recommendations for Hosts
- Consider adopting a Firm policy to align with the 57.2% market standard in Rangeley.
- Regularly review your cancellation policy against competitors and market demand shifts in Rangeley.
Rangeley STR Booking Lead Time Analysis (2026)
Average Booking Lead Time by Month
Booking Lead Time Insights for Rangeley
- The overall average booking lead time for vacation rentals in Rangeley is 77 days.
- Guests book furthest in advance for stays during May (average 95 days), likely coinciding with peak travel demand or local events.
- The shortest booking windows occur for stays in January (average 63 days), indicating more last-minute travel plans during this time.
- Seasonally, Spring (84 days avg.) sees the longest lead times, while Winter (73 days avg.) has the shortest, reflecting typical travel planning cycles.
Recommendations for Hosts
- Use the overall average lead time (77 days) as a baseline for your pricing and availability strategy in Rangeley.
- For May stays, consider implementing length-of-stay discounts or slightly higher rates for bookings made less than 95 days out to capitalize on advance planning.
- Target marketing efforts for the Spring season well in advance (at least 84 days) to capture early planners.
- Monitor your own booking lead times against these Rangeley averages to identify opportunities for dynamic pricing adjustments.
Popular & Essential Airbnb Amenities in Rangeley (2026)
Amenity Prevalence
Amenity Insights for Rangeley
- Essential amenities in Rangeley that guests expect include: Smoke alarm, Kitchen, Free parking on premises. Lacking these (any) could significantly impact bookings.
- Popular amenities like Refrigerator, Hot water, Coffee maker are common but not universal. Offering these can provide a competitive edge.
- Warning: Wifi is not universally provided but is considered essential globally. Ensure reliable Wifi is offered.
Recommendations for Hosts
- Ensure your listing includes all essential amenities for Rangeley: Smoke alarm, Kitchen, Free parking on premises.
- Prioritize adding missing essentials: Smoke alarm, Kitchen, Free parking on premises.
- Consider adding popular differentiators like Refrigerator or Hot water to increase appeal.
- Highlight unique or less common amenities you offer (e.g., hot tub, dedicated workspace, EV charger) in your listing description and photos.
- Regularly check competitor amenities in Rangeley to stay competitive.
Rangeley Airbnb Guest Demographics & Profile Analysis (2026)
Guest Profile Summary for Rangeley
- The typical guest profile for Airbnb in Rangeley consists of primarily domestic travelers (98%), often arriving from nearby Portland, typically belonging to the Post-2000s (Gen Z/Alpha) group (50%), primarily speaking English or Spanish.
- Domestic travelers account for 97.8% of guests.
- Key international markets include United States (97.8%) and Canada (0.4%).
- Top languages spoken are English (74.8%) followed by Spanish (7.6%).
- A significant demographic segment is the Post-2000s (Gen Z/Alpha) group, representing 50% of guests.
Recommendations for Hosts
- Target domestic marketing efforts towards travelers from Portland and Boston.
- Tailor amenities and listing descriptions to appeal to the dominant Post-2000s (Gen Z/Alpha) demographic (e.g., highlight fast WiFi, smart home features, local guides).
- Highlight unique local experiences or amenities relevant to the primary guest profile.
- Consider seasonal promotions aligned with peak travel times for key origin markets.
Nearby Short-Term Rental Market Comparison
How does the Rangeley Airbnb market stack up against its neighbors? Compare key performance metrics like average monthly revenue, ADR, and occupancy rates in surrounding areas to understand the broader regional STR landscape.
| Market | Active Properties | Monthly Revenue | Daily Rate | Avg. Occupancy |
|---|---|---|---|---|
| South Berwick | 12 | $5,351 | $228.88 | 58% |
| Kennebunkport | 152 | $5,309 | $669.87 | 43% |
| Barnstead | 36 | $5,090 | $477.12 | 42% |
| Goffstown | 13 | $5,066 | $343.72 | 53% |
| Kennebunk | 228 | $4,794 | $523.86 | 45% |
| Jefferson | 28 | $4,793 | $474.72 | 40% |
| Falmouth | 63 | $4,691 | $450.26 | 51% |
| Wilmot | 11 | $4,667 | $334.67 | 51% |
| Dalton | 12 | $4,403 | $366.38 | 42% |
| Manchester | 12 | $4,389 | $406.26 | 46% |