Portage Lake Airbnb Market Analysis 2026: Short Term Rental Data & Vacation Rental Statistics in Maine, United States
Is Airbnb profitable in Portage Lake in 2026? Explore comprehensive Airbnb analytics for Portage Lake, Maine, United States to uncover income potential. This 2026 STR market report for Portage Lake, based on AirROI data from February 2025 to January 2026, reveals key trends in the niche market of 20 active listings.
Whether you're considering an Airbnb investment in Portage Lake, optimizing your existing vacation rental, or exploring rental arbitrage opportunities, understanding the Portage Lake Airbnb data is crucial. Leveraging the low regulation environment is key to maximizing your short term rental income potential. Let's dive into the specifics.
Key Portage Lake Airbnb Performance Metrics Overview
Monthly Airbnb Revenue Variations & Income Potential in Portage Lake (2026)
Understanding the monthly revenue variations for Airbnb listings in Portage Lake is key to maximizing your short term rental income potential. Seasonality significantly impacts earnings. Our analysis, based on data from the past 12 months, shows that the peak revenue month for STRs in Portage Lake is typically July, while April often presents the lowest earnings, highlighting opportunities for strategic pricing adjustments during shoulder and low seasons. Explore the typical Airbnb income in Portage Lake across different performance tiers:
- Best-in-class properties (Top 10%) achieve $4,415+ monthly, often utilizing dynamic pricing and superior guest experiences.
- Strong performing properties (Top 25%) earn $3,088 or more, indicating effective management and desirable locations/amenities.
- Typical properties (Median) generate around $2,034 per month, representing the average market performance.
- Entry-level properties (Bottom 25%) see earnings around $1,245, often with potential for optimization.
Average Monthly Airbnb Earnings Trend in Portage Lake
Portage Lake Airbnb Occupancy Rate Trends (2026)
Maximize your bookings by understanding the Portage Lake STR occupancy trends. Seasonal demand shifts significantly influence how often properties are booked. Typically, Julysees the highest demand (peak season occupancy), while January experiences the lowest (low season). Effective strategies, like adjusting minimum stays or offering promotions, can boost occupancy during slower periods. Here's how different property tiers perform in Portage Lake:
- Best-in-class properties (Top 10%) achieve 68%+ occupancy, indicating high desirability and potentially optimized availability.
- Strong performing properties (Top 25%) maintain 50% or higher occupancy, suggesting good market fit and guest satisfaction.
- Typical properties (Median) have an occupancy rate around 33%.
- Entry-level properties (Bottom 25%) average 21% occupancy, potentially facing higher vacancy.
Average Monthly Occupancy Rate Trend in Portage Lake
Average Daily Rate (ADR) Airbnb Trends in Portage Lake (2026)
Effective short term rental pricing strategy in Portage Lake involves understanding monthly ADR fluctuations. The Average Daily Rate (ADR) for Airbnb in Portage Lake typically peaks in October and dips lowest during April. Leveraging Airbnb dynamic pricing tools or strategies based on this seasonality can significantly boost revenue. Here's a look at the typical nightly rates achieved:
- Best-in-class properties (Top 10%) command rates of $287+ per night, often due to premium features or locations.
- Strong performing properties (Top 25%) achieve nightly rates of $217 or more.
- Typical properties (Median) charge around $186 per night.
- Entry-level properties (Bottom 25%) earn around $150 per night.
Average Daily Rate (ADR) Trend by Month in Portage Lake
Get Live Portage Lake Market Intelligence 👇

Explore Real-time Analytics
Airbnb Seasonality Analysis & Trends in Portage Lake (2026)
Peak Season (July, October, August)
- Revenue averages $3,658 per month
- Occupancy rates average 56.6%
- Daily rates average $201
Shoulder Season
- Revenue averages $2,205 per month
- Occupancy maintains around 33.8%
- Daily rates hold near $197
Low Season (January, March, April)
- Revenue drops to average $1,192 per month
- Occupancy decreases to average 24.3%
- Daily rates adjust to average $183
Seasonality Insights for Portage Lake
- The Airbnb seasonality in Portage Lake shows highly seasonal trends requiring careful strategy. While the sections above show seasonal averages, it's also insightful to look at the extremes:
- During the high season, the absolute peak month showcases Portage Lake's highest earning potential, with monthly revenues capable of climbing to $3,839, occupancy reaching a high of 59.0%, and ADRs peaking at $211.
- Conversely, the slowest single month of the year, typically falling within the low season, marks the market's lowest point. In this month, revenue might dip to $1,101, occupancy could drop to 19.4%, and ADRs may adjust down to $167.
- Understanding both the seasonal averages and these monthly peaks and troughs in revenue, occupancy, and ADR is crucial for maximizing your Airbnb profit potential in Portage Lake.
Seasonal Strategies for Maximizing Profit
- Peak Season: Maximize revenue through premium pricing and potentially longer minimum stays. Ensure high availability.
- Low Season: Offer competitive pricing, special promotions (e.g., extended stay discounts), and flexible cancellation policies. Target off-season travelers like remote workers or budget-conscious guests.
- Shoulder Seasons: Implement dynamic pricing that balances peak and low rates. Target weekend travelers or specific events. Offer slightly more flexible terms than peak season.
- Regularly analyze your own performance against these Portage Lake seasonality benchmarks and adjust your pricing and availability strategy accordingly.
Best Areas for Airbnb Investment in Portage Lake (2026)
Exploring the top neighborhoods for short-term rentals in Portage Lake? This section highlights key areas, outlining why they are attractive for hosts and guests, along with notable local attractions. Consider these locations based on your target guest profile and investment strategy.
| Neighborhood / Area | Why Host Here? (Target Guests & Appeal) | Key Attractions & Landmarks |
|---|---|---|
| Downtown Portage Lake | Central hub with easy access to local amenities, shops, and dining. Ideal for those looking for convenience and a taste of local culture. | Portage Lake Historic Sites, Local cafes and eateries, Portage Lake Park, Nearby hiking trails |
| Portage Lake Campsites | Perfect for nature lovers and outdoor enthusiasts, these campsites offer a rustic experience that attracts families and groups looking to enjoy the great outdoors. | Camping sites, Fishing in Portage Lake, Hiking trails, Wildlife watching |
| Surrounding Woodlands | This area provides a serene environment with beautiful wooded settings, attracting nature seekers and those wanting tranquility away from busy city life. | Nature walks, Wildlife exploration, Scenic views, Peaceful retreats |
| Aroostook County Parks | Various parks in the region that offer recreational activities such as hiking, fishing, and picnicking, appealing to both families and adventure seekers. | Aroostook State Park, Fishing spots, Trails for hiking, Picnic areas |
| Winter Sports Areas | Attracts winter sports enthusiasts with opportunities for snowmobiling, skiing, and ice fishing in winter, providing seasonal rental opportunities. | Ski resorts, Snowmobiling trails, Ice fishing spots, Winter festivals |
| Local Farms | Agri-tourism is on the rise, and visitors enjoy staying on working farms, experiencing local produce and rural life. | Farm tours, Fresh local produce, Petting zoos, Seasonal events |
| Community Events Venues | Hosting community events attracts visitors to the area, creating demand for short-term rentals during festivals and local celebrations. | Annual Portage Lake Festival, Local craft fairs, Sports events, Concerts |
| Nearby National Parks | Proximity to larger parks increases interest for those who want to explore the outdoors beyond Portage Lake, enhancing potential tourist traffic. | Access to national park trails, Camping sites, Guided tours, Nature education centers |
Understanding Airbnb License Requirements & STR Laws in Portage Lake (2026)
While Portage Lake, Maine, United States currently shows low STR regulations, specific Airbnb license requirements might still exist or change. Always verify the latest short term rental regulations and Airbnb license requirements directly with local government authorities for Portage Lake to ensure full compliance before hosting.
(Source: AirROI data, 2026, finding no licensed listings among those analyzed)
Top Performing Airbnb Properties in Portage Lake (2026)
Benchmark your potential! Explore examples of top-performing Airbnb properties in Portage Lakebased on Trailing Twelve Month (TTM) revenue. Analyze their characteristics, revenue, occupancy rate, and ADR to understand what drives success in this market.
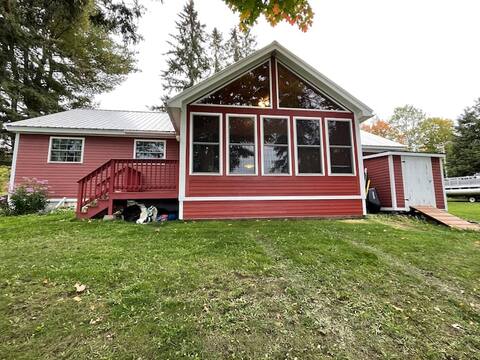
All Season Lake House - 3 Bedroom
Entire Place • 3 bedrooms
Cheerful Portage Paradise
Entire Place • 2 bedrooms

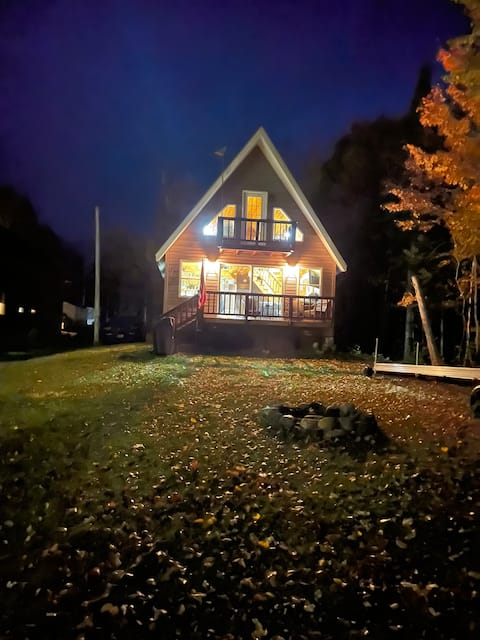
Private Lakefront Log Cabin in Northern Maine
Entire Place • 2 bedrooms

Lakefront Cottage
Entire Place • 2 bedrooms

Picturesque Lake Side Cabin
Entire Place • 3 bedrooms
Aurora Downs/ Foxfields Lakeside family Camp
Entire Place • 4 bedrooms
Note: Performance varies based on location, size, amenities, seasonality, and management quality. Data reflects the past 12 months.
Top Performing Airbnb Hosts in Portage Lake (2026)
Learn from the best! This table showcases top-performing Airbnb hosts in Portage Lake based on the number of properties managed and estimated total revenue over the past year. Analyze their scale and performance metrics.
| Host Name | Properties | Grossing Revenue | Stay Reviews | Avg Rating |
|---|---|---|---|---|
| Matthew | 5 | $89,515 | 59 | 4.95/5.0 |
| Joy | 2 | $41,933 | 30 | 4.97/5.0 |
| Lori | 1 | $36,827 | 54 | 4.83/5.0 |
| Cindy | 1 | $34,097 | 27 | 4.96/5.0 |
| Chad G | 1 | $32,629 | 71 | 4.96/5.0 |
| Desiree | 1 | $28,968 | 13 | 5.00/5.0 |
| Ray Jay | 1 | $26,835 | 31 | 4.81/5.0 |
| Beverly | 1 | $26,607 | 10 | 5.00/5.0 |
| Mary | 1 | $24,341 | 19 | 4.95/5.0 |
| Robert | 1 | $18,383 | 24 | 4.71/5.0 |
Analyzing the strategies of top hosts, such as their property selection, pricing, and guest communication, can offer valuable lessons for optimizing your own Airbnb operations in Portage Lake.
Dive Deeper: Advanced Portage Lake STR Market Data (2026)
Ready to unlock more insights? AirROI provides access to advanced metrics and comprehensive Airbnb data for Portage Lake. Explore detailed analytics beyond this report to refine your investment strategy, optimize pricing, and maximize your vacation rental profits.
Explore Advanced MetricsPortage Lake Short-Term Rental Market Composition (2026): Property & Room Types
Room Type Distribution
Property Type Distribution
Market Composition Insights for Portage Lake
- The Portage Lake Airbnb market composition is heavily skewed towards Entire Home/Apt listings, which make up 100% of the 20 active rentals. This indicates strong guest preference for privacy and space.
- Looking at the property type distribution in Portage Lake, House properties are the most common (65%), reflecting the local real estate landscape.
- Houses represent a significant 65% portion, catering likely to families or larger groups.
Portage Lake Airbnb Room Capacity Analysis (2026): Bedroom Distribution
Distribution of Listings by Number of Bedrooms
Room Capacity Insights for Portage Lake
- The dominant room capacity in Portage Lake is 2 bedrooms listings, making up 40% of the market. This suggests a strong demand for properties suitable for couples or solo travelers.
- Together, 2 bedrooms and 3 bedrooms properties represent 65.0% of the active Airbnb listings in Portage Lake, indicating a high concentration in these sizes.
- A significant 45.0% of listings offer 3+ bedrooms, catering to larger groups and families seeking more space in Portage Lake.
Portage Lake Vacation Rental Guest Capacity Trends (2026)
Distribution of Listings by Guest Capacity
Guest Capacity Insights for Portage Lake
- The most common guest capacity trend in Portage Lake vacation rentals is listings accommodating 8+ guests (45%). This suggests the primary traveler segment is likely larger groups.
- Properties designed for 8+ guests and 4 guests dominate the Portage Lake STR market, accounting for 60.0% of listings.
- 75.0% of properties accommodate 6+ guests, serving the market segment for larger families or group travel in Portage Lake.
- On average, properties in Portage Lake are equipped to host 6.5 guests.
Portage Lake Airbnb Booking Patterns (2026): Available vs. Booked Days
Available Days Distribution
Booked Days Distribution
Booking Pattern Insights for Portage Lake
- The most common availability pattern in Portage Lake falls within the 271-366 days range, representing 60% of listings. This suggests many properties have significant open periods on their calendars.
- Approximately 95.0% of listings show high availability (181+ days open annually), indicating potential for increased bookings or specific owner usage patterns.
- For booked days, the 91-180 days range is most frequent in Portage Lake (45%), reflecting common guest stay durations or potential owner blocking patterns.
- A notable 5.0% of properties secure long booking periods (181+ days booked per year), highlighting successful long-term rental strategies or significant owner usage.
Portage Lake Airbnb Minimum Stay Requirements Analysis
Distribution of Listings by Minimum Night Requirement
1 Night
2 listings
10% of total
2 Nights
2 listings
10% of total
3 Nights
4 listings
20% of total
4-6 Nights
3 listings
15% of total
30+ Nights
9 listings
45% of total
Key Insights
- The most prevalent minimum stay requirement in Portage Lake is 30+ Nights, adopted by 45% of listings. This highlights the market's preference for longer commitments.
- A significant segment (45%) caters to monthly stays (30+ nights) in Portage Lake, pointing to opportunities in the extended-stay market.
Recommendations
- Align with the market by considering a 30+ Nights minimum stay, as 45% of Portage Lake hosts use this setting.
- If feasible, allowing 1-night stays, especially midweek or during low season, could capture last-minute bookings, as only 10% currently do.
- Explore offering discounts for stays of 30+ nights to attract the 45% of the market seeking extended stays.
- Adjust minimum nights based on seasonality – potentially shorter during low season and longer during peak demand periods in Portage Lake.
Portage Lake Airbnb Cancellation Policy Trends Analysis (2026)
Flexible
5 listings
25% of total
Moderate
9 listings
45% of total
Firm
6 listings
30% of total
Cancellation Policy Insights for Portage Lake
- The prevailing Airbnb cancellation policy trend in Portage Lake is Moderate, used by 45% of listings.
- There's a relatively balanced mix between guest-friendly (70.0%) and stricter (30.0%) policies, offering choices for different guest needs.
Recommendations for Hosts
- Consider adopting a Moderate policy to align with the 45% market standard in Portage Lake.
- Regularly review your cancellation policy against competitors and market demand shifts in Portage Lake.
Portage Lake STR Booking Lead Time Analysis (2026)
Average Booking Lead Time by Month
Booking Lead Time Insights for Portage Lake
- The overall average booking lead time for vacation rentals in Portage Lake is 88 days.
- Guests book furthest in advance for stays during June (average 125 days), likely coinciding with peak travel demand or local events.
- The shortest booking windows occur for stays in April (average 9 days), indicating more last-minute travel plans during this time.
- Seasonally, Summer (107 days avg.) sees the longest lead times, while Spring (36 days avg.) has the shortest, reflecting typical travel planning cycles.
Recommendations for Hosts
- Use the overall average lead time (88 days) as a baseline for your pricing and availability strategy in Portage Lake.
- For June stays, consider implementing length-of-stay discounts or slightly higher rates for bookings made less than 125 days out to capitalize on advance planning.
- During April, focus on last-minute booking availability and promotions, as guests book with very short notice (9 days avg.).
- Target marketing efforts for the Summer season well in advance (at least 107 days) to capture early planners.
- Monitor your own booking lead times against these Portage Lake averages to identify opportunities for dynamic pricing adjustments.
Popular & Essential Airbnb Amenities in Portage Lake (2026)
Amenity Prevalence
Amenity Insights for Portage Lake
- Essential amenities in Portage Lake that guests expect include: Wifi, TV, Heating, Smoke alarm, Microwave, Carbon monoxide alarm, Kitchen, Coffee maker. Lacking these (any) could significantly impact bookings.
- Popular amenities like Cooking basics, Free parking on premises are common but not universal. Offering these can provide a competitive edge.
Recommendations for Hosts
- Ensure your listing includes all essential amenities for Portage Lake: Wifi, TV, Heating, Smoke alarm, Microwave, Carbon monoxide alarm, Kitchen, Coffee maker.
- Prioritize adding missing essentials: Smoke alarm, Microwave, Carbon monoxide alarm, Kitchen, Coffee maker.
- Consider adding popular differentiators like Cooking basics or Free parking on premises to increase appeal.
- Highlight unique or less common amenities you offer (e.g., hot tub, dedicated workspace, EV charger) in your listing description and photos.
- Regularly check competitor amenities in Portage Lake to stay competitive.
Portage Lake Airbnb Guest Demographics & Profile Analysis (2026)
Guest Profile Summary for Portage Lake
- The typical guest profile for Airbnb in Portage Lake consists of primarily domestic travelers (97%), often arriving from nearby Sidney, typically belonging to the Post-2000s (Gen Z/Alpha) group (50%), primarily speaking English.
- Domestic travelers account for 96.7% of guests.
- Key international markets include United States (96.7%) and Canada (3.3%).
- A significant demographic segment is the Post-2000s (Gen Z/Alpha) group, representing 50% of guests.
Recommendations for Hosts
- Target domestic marketing efforts towards travelers from Sidney and Connecticut.
- Tailor amenities and listing descriptions to appeal to the dominant Post-2000s (Gen Z/Alpha) demographic (e.g., highlight fast WiFi, smart home features, local guides).
- Highlight unique local experiences or amenities relevant to the primary guest profile.
- Consider seasonal promotions aligned with peak travel times for key origin markets.
Nearby Short-Term Rental Market Comparison
How does the Portage Lake Airbnb market stack up against its neighbors? Compare key performance metrics like average monthly revenue, ADR, and occupancy rates in surrounding areas to understand the broader regional STR landscape.
| Market | Active Properties | Monthly Revenue | Daily Rate | Avg. Occupancy |
|---|---|---|---|---|
| Taunton & Raynham Academy Grant | 11 | $3,401 | $299.08 | 50% |
| Beaver Cove | 28 | $3,066 | $408.38 | 37% |
| Ambejejus Lake | 21 | $2,474 | $377.29 | 42% |
| Enfield | 11 | $2,318 | $223.40 | 45% |
| Town of Saint Andrews | 72 | $2,192 | $218.59 | 46% |
| Oak Bay | 10 | $2,083 | $162.90 | 52% |
| Kamouraska | 12 | $1,954 | $176.27 | 43% |
| Notre-Dame-du-Portage | 10 | $1,924 | $147.05 | 54% |
| Greenville | 161 | $1,880 | $290.17 | 30% |
| Témiscouata-sur-le-Lac | 18 | $1,779 | $136.46 | 47% |