Newry Airbnb Market Analysis 2026: Short Term Rental Data & Vacation Rental Statistics in Maine, United States
Is Airbnb profitable in Newry in 2026? Explore comprehensive Airbnb analytics for Newry, Maine, United States to uncover income potential. This 2026 STR market report for Newry, based on AirROI data from February 2025 to January 2026, reveals key trends in the market of 302 active listings.
Whether you're considering an Airbnb investment in Newry, optimizing your existing vacation rental, or exploring rental arbitrage opportunities, understanding the Newry Airbnb data is crucial. Leveraging the low regulation environment is key to maximizing your short term rental income potential. Let's dive into the specifics.
Key Newry Airbnb Performance Metrics Overview
Monthly Airbnb Revenue Variations & Income Potential in Newry (2026)
Understanding the monthly revenue variations for Airbnb listings in Newry is key to maximizing your short term rental income potential. Seasonality significantly impacts earnings. Our analysis, based on data from the past 12 months, shows that the peak revenue month for STRs in Newry is typically February, while April often presents the lowest earnings, highlighting opportunities for strategic pricing adjustments during shoulder and low seasons. Explore the typical Airbnb income in Newry across different performance tiers:
- Best-in-class properties (Top 10%) achieve $12,019+ monthly, often utilizing dynamic pricing and superior guest experiences.
- Strong performing properties (Top 25%) earn $6,865 or more, indicating effective management and desirable locations/amenities.
- Typical properties (Median) generate around $3,292 per month, representing the average market performance.
- Entry-level properties (Bottom 25%) see earnings around $1,614, often with potential for optimization.
Average Monthly Airbnb Earnings Trend in Newry
Newry Airbnb Occupancy Rate Trends (2026)
Maximize your bookings by understanding the Newry STR occupancy trends. Seasonal demand shifts significantly influence how often properties are booked. Typically, Februarysees the highest demand (peak season occupancy), while September experiences the lowest (low season). Effective strategies, like adjusting minimum stays or offering promotions, can boost occupancy during slower periods. Here's how different property tiers perform in Newry:
- Best-in-class properties (Top 10%) achieve 60%+ occupancy, indicating high desirability and potentially optimized availability.
- Strong performing properties (Top 25%) maintain 42% or higher occupancy, suggesting good market fit and guest satisfaction.
- Typical properties (Median) have an occupancy rate around 27%.
- Entry-level properties (Bottom 25%) average 16% occupancy, potentially facing higher vacancy.
Average Monthly Occupancy Rate Trend in Newry
Average Daily Rate (ADR) Airbnb Trends in Newry (2026)
Effective short term rental pricing strategy in Newry involves understanding monthly ADR fluctuations. The Average Daily Rate (ADR) for Airbnb in Newry typically peaks in January and dips lowest during May. Leveraging Airbnb dynamic pricing tools or strategies based on this seasonality can significantly boost revenue. Here's a look at the typical nightly rates achieved:
- Best-in-class properties (Top 10%) command rates of $828+ per night, often due to premium features or locations.
- Strong performing properties (Top 25%) achieve nightly rates of $557 or more.
- Typical properties (Median) charge around $345 per night.
- Entry-level properties (Bottom 25%) earn around $246 per night.
Average Daily Rate (ADR) Trend by Month in Newry
Get Live Newry Market Intelligence 👇

Explore Real-time Analytics
Airbnb Seasonality Analysis & Trends in Newry (2026)
Peak Season (February, January, July)
- Revenue averages $7,686 per month
- Occupancy rates average 44.0%
- Daily rates average $509
Shoulder Season
- Revenue averages $5,422 per month
- Occupancy maintains around 29.3%
- Daily rates hold near $454
Low Season (April, October, November)
- Revenue drops to average $3,541 per month
- Occupancy decreases to average 22.0%
- Daily rates adjust to average $445
Seasonality Insights for Newry
- The Airbnb seasonality in Newry shows highly seasonal trends requiring careful strategy. While the sections above show seasonal averages, it's also insightful to look at the extremes:
- During the high season, the absolute peak month showcases Newry's highest earning potential, with monthly revenues capable of climbing to $9,205, occupancy reaching a high of 64.0%, and ADRs peaking at $582.
- Conversely, the slowest single month of the year, typically falling within the low season, marks the market's lowest point. In this month, revenue might dip to $2,908, occupancy could drop to 20.5%, and ADRs may adjust down to $391.
- Understanding both the seasonal averages and these monthly peaks and troughs in revenue, occupancy, and ADR is crucial for maximizing your Airbnb profit potential in Newry.
Seasonal Strategies for Maximizing Profit
- Peak Season: Maximize revenue through premium pricing and potentially longer minimum stays. Ensure high availability.
- Low Season: Offer competitive pricing, special promotions (e.g., extended stay discounts), and flexible cancellation policies. Target off-season travelers like remote workers or budget-conscious guests.
- Shoulder Seasons: Implement dynamic pricing that balances peak and low rates. Target weekend travelers or specific events. Offer slightly more flexible terms than peak season.
- Regularly analyze your own performance against these Newry seasonality benchmarks and adjust your pricing and availability strategy accordingly.
Best Areas for Airbnb Investment in Newry (2026)
Exploring the top neighborhoods for short-term rentals in Newry? This section highlights key areas, outlining why they are attractive for hosts and guests, along with notable local attractions. Consider these locations based on your target guest profile and investment strategy.
| Neighborhood / Area | Why Host Here? (Target Guests & Appeal) | Key Attractions & Landmarks |
|---|---|---|
| Lake Mattawamkeag | A picturesque location centered around the lake, popular for fishing, boating, and summer retreats. Attracts families and outdoor enthusiasts seeking a peaceful getaway. | Mattawamkeag Lake, Boating and fishing activities, Nature trails, Picnic areas, Wildlife watching |
| Downtown Newry | The hub of Newry, providing access to local shops, dining, and community events. Ideal for visitors who want to experience local culture. | Local restaurants, Community events, Newry Historical Society, Art galleries, Shopping boutiques |
| Sunday River Ski Resort | A major ski resort in the area, drawing winter sports enthusiasts year-round. Perfect for winter vacationers and summer hikers alike. | Skiing and snowboarding, Mountain biking, Hiking trails, Golf courses, Sunday River Village |
| Grafton Notch State Park | A natural paradise offering stunning views and outdoor adventure opportunities. Attracts hikers, nature lovers, and camping enthusiasts. | Hiking trails, Picturesque waterfalls, Scenic vistas, Leadership activities, Wildflower exploration |
| The Androscoggin River | A scenic area known for water sports and fishing. Ideal for those seeking active outdoor experiences along the river. | Kayaking and canoeing, Fishing spots, Scenic picnic areas, Biking trails, Wildlife habitats |
| Mahoosuc Range | Part of the Appalachian Mountains, offering incredible hiking experiences and beautiful natural scenery. Great for serious hikers and nature lovers. | Mountains and hiking trails, Camping areas, Scenic viewpoints, Wildflower trails, Boulder hopping sites |
| White Cap Mountain | Offers breathtaking views and is accessible for various outdoor activities, including skiing and hiking. Great for adventure seekers. | Ski slopes, Hiking paths, Snowshoeing, Wildlife viewing, Spectacular lookout points |
| Newry Village | A charming village atmosphere with easy access to both nature and community amenities. A perfect balance for visitors wanting a quaint experience. | Local markets, Community events, Maine's wilderness experience, Historic sites, Cultural festivals |
Understanding Airbnb License Requirements & STR Laws in Newry (2026)
While Newry, Maine, United States currently shows low STR regulations, specific Airbnb license requirements might still exist or change. Always verify the latest short term rental regulations and Airbnb license requirements directly with local government authorities for Newry to ensure full compliance before hosting.
(Source: AirROI data, 2026, finding no licensed listings among those analyzed)
Top Performing Airbnb Properties in Newry (2026)
Benchmark your potential! Explore examples of top-performing Airbnb properties in Newrybased on Trailing Twelve Month (TTM) revenue. Analyze their characteristics, revenue, occupancy rate, and ADR to understand what drives success in this market.
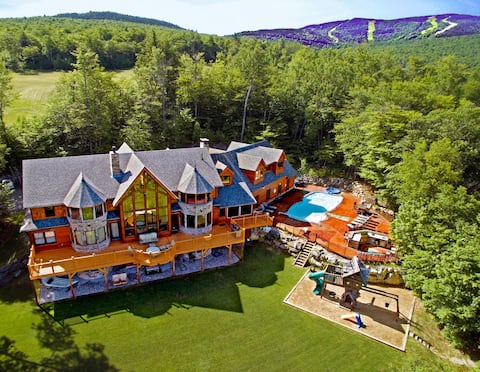
9 Bdrm Estate Sleep 26 Movie Theater,Pool,Golf,Ski
Entire Place • 9 bedrooms

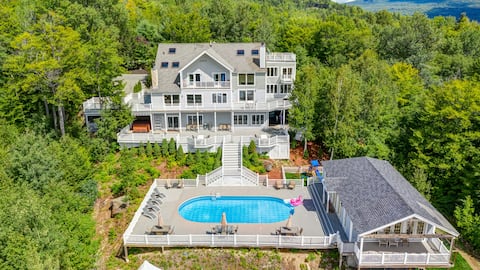
Skitopia mountain oasis with pool and spa
Entire Place • 7 bedrooms
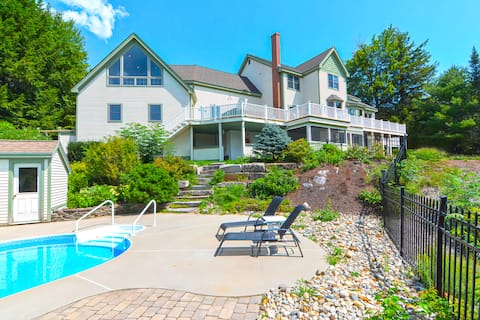
Ski Resort Views, 10 Bdrms, Hottub, Fireplaces
Entire Place • 10 bedrooms
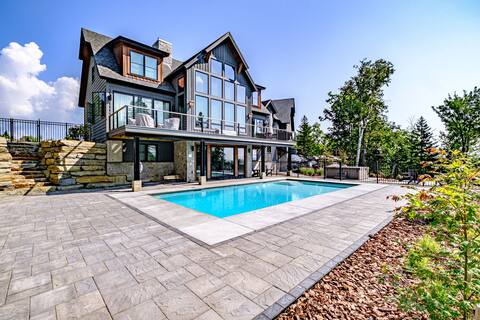
9 Bdrm, Sleep 24, HotTub, Pool, Theater, Game Room
Entire Place • 9 bedrooms

3 Mi to SR! Sleeps 25, Private, Hot Tub, Arcade!
Entire Place • 6 bedrooms
Exclusive Ski-in/Out Luxury Home at Alpine
Entire Place • 6 bedrooms
Note: Performance varies based on location, size, amenities, seasonality, and management quality. Data reflects the past 12 months.
Top Performing Airbnb Hosts in Newry (2026)
Learn from the best! This table showcases top-performing Airbnb hosts in Newry based on the number of properties managed and estimated total revenue over the past year. Analyze their scale and performance metrics.
| Host Name | Properties | Grossing Revenue | Stay Reviews | Avg Rating |
|---|---|---|---|---|
| Maine Ski Lodging Co. | 88 | $2,497,702 | 2212 | 4.79/5.0 |
| Mark | 17 | $1,003,652 | 465 | 4.91/5.0 |
| Visit Sunday River Co. | 16 | $948,760 | 842 | 4.92/5.0 |
| Julia | 46 | $889,595 | 873 | 4.81/5.0 |
| Gretchen | 1 | $604,513 | 83 | 4.99/5.0 |
| Amanda | 2 | $472,948 | 102 | 4.96/5.0 |
| Heidi | 23 | $455,250 | 1513 | 4.81/5.0 |
| The 5 Star Co-Host | 4 | $308,677 | 159 | 4.92/5.0 |
| Benjamin | 1 | $266,223 | 95 | 4.91/5.0 |
| Quinn | 1 | $250,938 | 84 | 4.92/5.0 |
Analyzing the strategies of top hosts, such as their property selection, pricing, and guest communication, can offer valuable lessons for optimizing your own Airbnb operations in Newry.
Dive Deeper: Advanced Newry STR Market Data (2026)
Ready to unlock more insights? AirROI provides access to advanced metrics and comprehensive Airbnb data for Newry. Explore detailed analytics beyond this report to refine your investment strategy, optimize pricing, and maximize your vacation rental profits.
Explore Advanced MetricsNewry Short-Term Rental Market Composition (2026): Property & Room Types
Room Type Distribution
Property Type Distribution
Market Composition Insights for Newry
- The Newry Airbnb market composition is heavily skewed towards Entire Home/Apt listings, which make up 100% of the 302 active rentals. This indicates strong guest preference for privacy and space.
- Looking at the property type distribution in Newry, House properties are the most common (54%), reflecting the local real estate landscape.
- Houses represent a significant 54% portion, catering likely to families or larger groups.
- Smaller segments like outdoor/unique, others, hotel/boutique (combined 4.2%) offer potential for unique stay experiences.
Newry Airbnb Room Capacity Analysis (2026): Bedroom Distribution
Distribution of Listings by Number of Bedrooms
Room Capacity Insights for Newry
- The dominant room capacity in Newry is 1 bedroom listings, making up 33.1% of the market. This suggests a strong demand for properties suitable for couples or solo travelers.
- Together, 1 bedroom and 5+ bedrooms properties represent 53.0% of the active Airbnb listings in Newry, indicating a high concentration in these sizes.
- A significant 47.8% of listings offer 3+ bedrooms, catering to larger groups and families seeking more space in Newry.
Newry Vacation Rental Guest Capacity Trends (2026)
Distribution of Listings by Guest Capacity
Guest Capacity Insights for Newry
- The most common guest capacity trend in Newry vacation rentals is listings accommodating 8+ guests (51.3%). This suggests the primary traveler segment is likely larger groups.
- Properties designed for 8+ guests and 6 guests dominate the Newry STR market, accounting for 76.5% of listings.
- 78.2% of properties accommodate 6+ guests, serving the market segment for larger families or group travel in Newry.
- On average, properties in Newry are equipped to host 6.6 guests.
Newry Airbnb Booking Patterns (2026): Available vs. Booked Days
Available Days Distribution
Booked Days Distribution
Booking Pattern Insights for Newry
- The most common availability pattern in Newry falls within the 271-366 days range, representing 77.5% of listings. This suggests many properties have significant open periods on their calendars.
- Approximately 97.4% of listings show high availability (181+ days open annually), indicating potential for increased bookings or specific owner usage patterns.
- For booked days, the 31-90 days range is most frequent in Newry (58.3%), reflecting common guest stay durations or potential owner blocking patterns.
- A notable 3.3% of properties secure long booking periods (181+ days booked per year), highlighting successful long-term rental strategies or significant owner usage.
Newry Airbnb Minimum Stay Requirements Analysis
Distribution of Listings by Minimum Night Requirement
1 Night
32 listings
10.6% of total
2 Nights
119 listings
39.4% of total
3 Nights
24 listings
7.9% of total
4-6 Nights
2 listings
0.7% of total
7-29 Nights
2 listings
0.7% of total
30+ Nights
123 listings
40.7% of total
Key Insights
- The most prevalent minimum stay requirement in Newry is 30+ Nights, adopted by 40.7% of listings. This highlights the market's preference for longer commitments.
- A significant segment (40.7%) caters to monthly stays (30+ nights) in Newry, pointing to opportunities in the extended-stay market.
Recommendations
- Align with the market by considering a 30+ Nights minimum stay, as 40.7% of Newry hosts use this setting.
- If feasible, allowing 1-night stays, especially midweek or during low season, could capture last-minute bookings, as only 10.6% currently do.
- A 2-night minimum appears standard (39.4%). Consider this for weekends or peak periods.
- Explore offering discounts for stays of 30+ nights to attract the 40.7% of the market seeking extended stays.
- Adjust minimum nights based on seasonality – potentially shorter during low season and longer during peak demand periods in Newry.
Newry Airbnb Cancellation Policy Trends Analysis (2026)
Super Strict 30 Days
8 listings
2.7% of total
Super Strict 60 Days
4 listings
1.3% of total
Flexible
7 listings
2.3% of total
Moderate
49 listings
16.3% of total
Firm
189 listings
62.8% of total
Strict
44 listings
14.6% of total
Cancellation Policy Insights for Newry
- The prevailing Airbnb cancellation policy trend in Newry is Firm, used by 62.8% of listings.
- A majority (77.4%) of hosts in Newry utilize Firm or Strict policies, indicating a market where hosts prioritize booking security.
Recommendations for Hosts
- Consider adopting a Firm policy to align with the 62.8% market standard in Newry.
- Using a Strict policy might deter some guests, as only 14.6% of listings use it. Evaluate if potential revenue protection outweighs possible lower booking rates.
- Regularly review your cancellation policy against competitors and market demand shifts in Newry.
Newry STR Booking Lead Time Analysis (2026)
Average Booking Lead Time by Month
Booking Lead Time Insights for Newry
- The overall average booking lead time for vacation rentals in Newry is 77 days.
- Guests book furthest in advance for stays during January (average 98 days), likely coinciding with peak travel demand or local events.
- The shortest booking windows occur for stays in September (average 54 days), indicating more last-minute travel plans during this time.
- Seasonally, Winter (92 days avg.) sees the longest lead times, while Fall (60 days avg.) has the shortest, reflecting typical travel planning cycles.
Recommendations for Hosts
- Use the overall average lead time (77 days) as a baseline for your pricing and availability strategy in Newry.
- For January stays, consider implementing length-of-stay discounts or slightly higher rates for bookings made less than 98 days out to capitalize on advance planning.
- Target marketing efforts for the Winter season well in advance (at least 92 days) to capture early planners.
- Monitor your own booking lead times against these Newry averages to identify opportunities for dynamic pricing adjustments.
Popular & Essential Airbnb Amenities in Newry (2026)
Amenity Prevalence
Amenity Insights for Newry
- Essential amenities in Newry that guests expect include: Wifi, Refrigerator, Coffee maker, TV, Kitchen, Free parking on premises, Smoke alarm, Dishes and silverware, Heating. Lacking these (any) could significantly impact bookings.
- Popular amenities like Microwave are common but not universal. Offering these can provide a competitive edge.
Recommendations for Hosts
- Ensure your listing includes all essential amenities for Newry: Wifi, Refrigerator, Coffee maker, TV, Kitchen, Free parking on premises, Smoke alarm, Dishes and silverware, Heating.
- Prioritize adding missing essentials: Wifi, Refrigerator, Coffee maker, TV, Kitchen, Free parking on premises, Smoke alarm, Dishes and silverware, Heating.
- Consider adding popular differentiators like Microwave to increase appeal.
- Highlight unique or less common amenities you offer (e.g., hot tub, dedicated workspace, EV charger) in your listing description and photos.
- Regularly check competitor amenities in Newry to stay competitive.
Newry Airbnb Guest Demographics & Profile Analysis (2026)
Guest Profile Summary for Newry
- The typical guest profile for Airbnb in Newry consists of primarily domestic travelers (97%), often arriving from nearby Boston, typically belonging to the Post-2000s (Gen Z/Alpha) group (50%), primarily speaking English or Spanish.
- Domestic travelers account for 96.8% of guests.
- Key international markets include United States (96.8%) and Canada (1.8%).
- Top languages spoken are English (70.5%) followed by Spanish (9.6%).
- A significant demographic segment is the Post-2000s (Gen Z/Alpha) group, representing 50% of guests.
Recommendations for Hosts
- Target domestic marketing efforts towards travelers from Boston and Portland.
- Tailor amenities and listing descriptions to appeal to the dominant Post-2000s (Gen Z/Alpha) demographic (e.g., highlight fast WiFi, smart home features, local guides).
- Highlight unique local experiences or amenities relevant to the primary guest profile.
- Consider seasonal promotions aligned with peak travel times for key origin markets.
Nearby Short-Term Rental Market Comparison
How does the Newry Airbnb market stack up against its neighbors? Compare key performance metrics like average monthly revenue, ADR, and occupancy rates in surrounding areas to understand the broader regional STR landscape.
| Market | Active Properties | Monthly Revenue | Daily Rate | Avg. Occupancy |
|---|---|---|---|---|
| South Berwick | 12 | $5,351 | $228.88 | 58% |
| Kennebunkport | 152 | $5,309 | $669.87 | 43% |
| Barnstead | 36 | $5,090 | $477.12 | 42% |
| Goffstown | 13 | $5,066 | $343.72 | 53% |
| Kennebunk | 228 | $4,794 | $523.86 | 45% |
| Jefferson | 28 | $4,793 | $474.72 | 40% |
| Falmouth | 63 | $4,691 | $450.26 | 51% |
| Wilmot | 11 | $4,667 | $334.67 | 51% |
| Dalton | 12 | $4,403 | $366.38 | 42% |
| Manchester | 12 | $4,389 | $406.26 | 46% |