Newcastle Airbnb Market Analysis 2026: Short Term Rental Data & Vacation Rental Statistics in Maine, United States
Is Airbnb profitable in Newcastle in 2026? Explore comprehensive Airbnb analytics for Newcastle, Maine, United States to uncover income potential. This 2026 STR market report for Newcastle, based on AirROI data from February 2025 to January 2026, reveals key trends in the niche market of 21 active listings.
Whether you're considering an Airbnb investment in Newcastle, optimizing your existing vacation rental, or exploring rental arbitrage opportunities, understanding the Newcastle Airbnb data is crucial. Leveraging the low regulation environment is key to maximizing your short term rental income potential. Let's dive into the specifics.
Key Newcastle Airbnb Performance Metrics Overview
Monthly Airbnb Revenue Variations & Income Potential in Newcastle (2026)
Understanding the monthly revenue variations for Airbnb listings in Newcastle is key to maximizing your short term rental income potential. Seasonality significantly impacts earnings. Our analysis, based on data from the past 12 months, shows that the peak revenue month for STRs in Newcastle is typically August, while March often presents the lowest earnings, highlighting opportunities for strategic pricing adjustments during shoulder and low seasons. Explore the typical Airbnb income in Newcastle across different performance tiers:
- Best-in-class properties (Top 10%) achieve $11,102+ monthly, often utilizing dynamic pricing and superior guest experiences.
- Strong performing properties (Top 25%) earn $5,771 or more, indicating effective management and desirable locations/amenities.
- Typical properties (Median) generate around $3,033 per month, representing the average market performance.
- Entry-level properties (Bottom 25%) see earnings around $1,719, often with potential for optimization.
Average Monthly Airbnb Earnings Trend in Newcastle
Newcastle Airbnb Occupancy Rate Trends (2026)
Maximize your bookings by understanding the Newcastle STR occupancy trends. Seasonal demand shifts significantly influence how often properties are booked. Typically, Augustsees the highest demand (peak season occupancy), while March experiences the lowest (low season). Effective strategies, like adjusting minimum stays or offering promotions, can boost occupancy during slower periods. Here's how different property tiers perform in Newcastle:
- Best-in-class properties (Top 10%) achieve 76%+ occupancy, indicating high desirability and potentially optimized availability.
- Strong performing properties (Top 25%) maintain 60% or higher occupancy, suggesting good market fit and guest satisfaction.
- Typical properties (Median) have an occupancy rate around 37%.
- Entry-level properties (Bottom 25%) average 21% occupancy, potentially facing higher vacancy.
Average Monthly Occupancy Rate Trend in Newcastle
Average Daily Rate (ADR) Airbnb Trends in Newcastle (2026)
Effective short term rental pricing strategy in Newcastle involves understanding monthly ADR fluctuations. The Average Daily Rate (ADR) for Airbnb in Newcastle typically peaks in December and dips lowest during March. Leveraging Airbnb dynamic pricing tools or strategies based on this seasonality can significantly boost revenue. Here's a look at the typical nightly rates achieved:
- Best-in-class properties (Top 10%) command rates of $454+ per night, often due to premium features or locations.
- Strong performing properties (Top 25%) achieve nightly rates of $365 or more.
- Typical properties (Median) charge around $303 per night.
- Entry-level properties (Bottom 25%) earn around $204 per night.
Average Daily Rate (ADR) Trend by Month in Newcastle
Get Live Newcastle Market Intelligence 👇

Explore Real-time Analytics
Airbnb Seasonality Analysis & Trends in Newcastle (2026)
Peak Season (August, July, November)
- Revenue averages $6,611 per month
- Occupancy rates average 58.7%
- Daily rates average $336
Shoulder Season
- Revenue averages $4,345 per month
- Occupancy maintains around 37.5%
- Daily rates hold near $338
Low Season (March, April, May)
- Revenue drops to average $2,744 per month
- Occupancy decreases to average 30.7%
- Daily rates adjust to average $295
Seasonality Insights for Newcastle
- The Airbnb seasonality in Newcastle shows highly seasonal trends requiring careful strategy. While the sections above show seasonal averages, it's also insightful to look at the extremes:
- During the high season, the absolute peak month showcases Newcastle's highest earning potential, with monthly revenues capable of climbing to $7,614, occupancy reaching a high of 72.2%, and ADRs peaking at $369.
- Conversely, the slowest single month of the year, typically falling within the low season, marks the market's lowest point. In this month, revenue might dip to $1,699, occupancy could drop to 20.0%, and ADRs may adjust down to $288.
- Understanding both the seasonal averages and these monthly peaks and troughs in revenue, occupancy, and ADR is crucial for maximizing your Airbnb profit potential in Newcastle.
Seasonal Strategies for Maximizing Profit
- Peak Season: Maximize revenue through premium pricing and potentially longer minimum stays. Ensure high availability.
- Low Season: Offer competitive pricing, special promotions (e.g., extended stay discounts), and flexible cancellation policies. Target off-season travelers like remote workers or budget-conscious guests.
- Shoulder Seasons: Implement dynamic pricing that balances peak and low rates. Target weekend travelers or specific events. Offer slightly more flexible terms than peak season.
- Regularly analyze your own performance against these Newcastle seasonality benchmarks and adjust your pricing and availability strategy accordingly.
Best Areas for Airbnb Investment in Newcastle (2026)
Exploring the top neighborhoods for short-term rentals in Newcastle? This section highlights key areas, outlining why they are attractive for hosts and guests, along with notable local attractions. Consider these locations based on your target guest profile and investment strategy.
| Neighborhood / Area | Why Host Here? (Target Guests & Appeal) | Key Attractions & Landmarks |
|---|---|---|
| Downtown Newcastle | The heart of Newcastle, with historical charm and proximity to local shops, restaurants, and the waterfront. Ideal for visitors who want a vibrant community atmosphere mixed with local history. | Newcastle Opera House, Glebe Park, Newcastle Museum, Local Markets, Willis Island |
| Newcastle Beach | A picturesque beach area popular for its scenic views and outdoor activities. Attracts families and outdoor enthusiasts looking for a coastal getaway. | Newcastle Beach, Nobbys Beach, Fort Scratchley, ANZAC Walk, Queens Wharf |
| Cooks Hill | Trendy neighborhood known for its eclectic mix of shops, cafes, and art galleries. Popular among young travelers looking for a hip and vibrant environment. | Bar Beach, Cooks Hill Cafes, Local Art Galleries, Newcastle East, Cooks Hill Markets |
| Hamilton | An up-and-coming area known for its vintage shops and lively dining scene. Draws those interested in local culture and nightlife. | Hamilton Station, Vintage Shops, Local Bars, Cafes, Live Music Venues |
| The Junction | A family-friendly neighborhood that combines small-town charm with urban amenities. Great for visitors looking for a relaxed stay with access to parks and local eateries. | Junction Fair Shopping Centre, Local Parks, Bathers Way, Train Station |
| Newcastle West | An industrial yet rapidly developing area that appeals to those interested in local history and the arts. Attracts those who appreciate a blend of old and new. | Newcastle Produce Markets, Historical Buildings, Local Breweries, Art Spaces |
| Mayfield | A location that features a mix of residential and commercial areas, known for its dining options and community feel. Great for longer stays with family or friends. | Mayfield Hotel, Local Cafes, Community Parks, Art Spaces, Shopping Options |
| Waratah | Known for its suburban charm and family-friendly atmosphere, Waratah provides a peaceful retreat while still being close to Newcastle city. Ideal for families and groups. | Waratah Park, Local Schools, Community Events, Shopping Strip |
Understanding Airbnb License Requirements & STR Laws in Newcastle (2026)
While Newcastle, Maine, United States currently shows low STR regulations, specific Airbnb license requirements might still exist or change. Always verify the latest short term rental regulations and Airbnb license requirements directly with local government authorities for Newcastle to ensure full compliance before hosting.
(Source: AirROI data, 2026, finding no licensed listings among those analyzed)
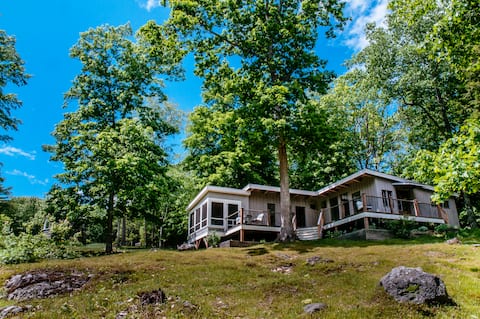
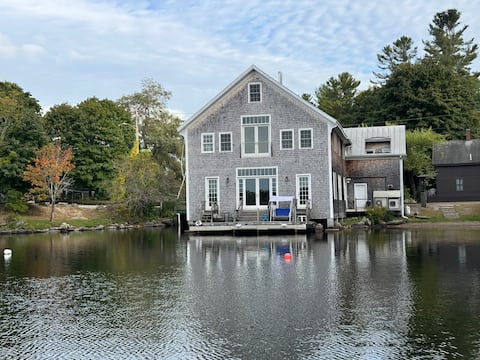
Top Performing Airbnb Properties in Newcastle (2026)
Benchmark your potential! Explore examples of top-performing Airbnb properties in Newcastlebased on Trailing Twelve Month (TTM) revenue. Analyze their characteristics, revenue, occupancy rate, and ADR to understand what drives success in this market.

Stay Together in Style
Entire Place • 6 bedrooms
Rustic Farmhouse at Oxbow Brewery
Entire Place • 3 bedrooms
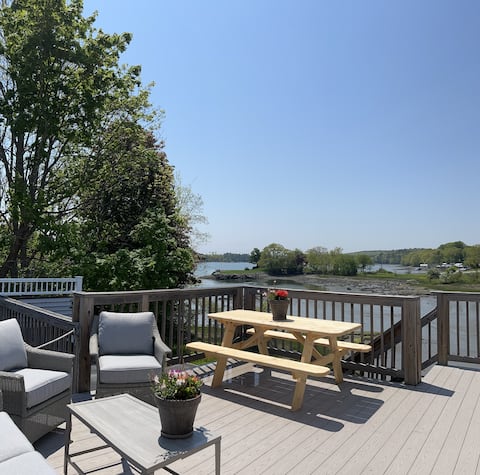
Modern In Town Condo With Ocean Views
Entire Place • 2 bedrooms
More Boathouse than Lakehouse
Entire Place • 4 bedrooms
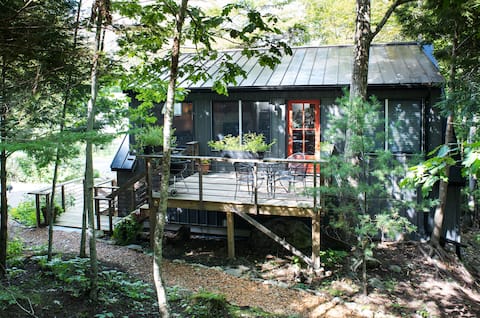
Modern 1-BR I Wooded Retreat I Mid-Coast Maine
Entire Place • 1 bedroom

Great Salt Bay Waterfront Home
Entire Place • 3 bedrooms
Note: Performance varies based on location, size, amenities, seasonality, and management quality. Data reflects the past 12 months.
Top Performing Airbnb Hosts in Newcastle (2026)
Learn from the best! This table showcases top-performing Airbnb hosts in Newcastle based on the number of properties managed and estimated total revenue over the past year. Analyze their scale and performance metrics.
| Host Name | Properties | Grossing Revenue | Stay Reviews | Avg Rating |
|---|---|---|---|---|
| Jay | 1 | $170,832 | 25 | 5.00/5.0 |
| Birch | 1 | $75,221 | 224 | 4.92/5.0 |
| Jonathon | 2 | $73,700 | 22 | 5.00/5.0 |
| Sydney | 2 | $66,462 | 53 | 4.98/5.0 |
| Debi | 1 | $48,189 | 122 | 4.98/5.0 |
| Adam | 1 | $41,192 | 79 | 4.86/5.0 |
| Liz | 2 | $39,739 | 151 | 4.97/5.0 |
| Karoline | 1 | $29,660 | 10 | 5.00/5.0 |
| Ellen | 1 | $26,820 | 31 | 4.87/5.0 |
| Melanie | 1 | $26,383 | 42 | 4.93/5.0 |
Analyzing the strategies of top hosts, such as their property selection, pricing, and guest communication, can offer valuable lessons for optimizing your own Airbnb operations in Newcastle.
Dive Deeper: Advanced Newcastle STR Market Data (2026)
Ready to unlock more insights? AirROI provides access to advanced metrics and comprehensive Airbnb data for Newcastle. Explore detailed analytics beyond this report to refine your investment strategy, optimize pricing, and maximize your vacation rental profits.
Explore Advanced MetricsNewcastle Short-Term Rental Market Composition (2026): Property & Room Types
Room Type Distribution
Property Type Distribution
Market Composition Insights for Newcastle
- The Newcastle Airbnb market composition is heavily skewed towards Entire Home/Apt listings, which make up 100% of the 21 active rentals. This indicates strong guest preference for privacy and space.
- Looking at the property type distribution in Newcastle, House properties are the most common (71.4%), reflecting the local real estate landscape.
- Houses represent a significant 71.4% portion, catering likely to families or larger groups.
- Smaller segments like hotel/boutique, unique stays (combined 9.6%) offer potential for unique stay experiences.
Newcastle Airbnb Room Capacity Analysis (2026): Bedroom Distribution
Distribution of Listings by Number of Bedrooms
Room Capacity Insights for Newcastle
- The dominant room capacity in Newcastle is 3 bedrooms listings, making up 42.9% of the market. This suggests a strong demand for properties suitable for families or small groups.
- Together, 3 bedrooms and 2 bedrooms properties represent 66.7% of the active Airbnb listings in Newcastle, indicating a high concentration in these sizes.
- A significant 61.9% of listings offer 3+ bedrooms, catering to larger groups and families seeking more space in Newcastle.
Newcastle Vacation Rental Guest Capacity Trends (2026)
Distribution of Listings by Guest Capacity
Guest Capacity Insights for Newcastle
- The most common guest capacity trend in Newcastle vacation rentals is listings accommodating 6 guests (28.6%). This suggests the primary traveler segment is likely larger groups.
- Properties designed for 6 guests and 4 guests dominate the Newcastle STR market, accounting for 52.4% of listings.
- 52.4% of properties accommodate 6+ guests, serving the market segment for larger families or group travel in Newcastle.
- On average, properties in Newcastle are equipped to host 5.6 guests.
Newcastle Airbnb Booking Patterns (2026): Available vs. Booked Days
Available Days Distribution
Booked Days Distribution
Booking Pattern Insights for Newcastle
- The most common availability pattern in Newcastle falls within the 271-366 days range, representing 61.9% of listings. This suggests many properties have significant open periods on their calendars.
- Approximately 90.5% of listings show high availability (181+ days open annually), indicating potential for increased bookings or specific owner usage patterns.
- For booked days, the 31-90 days range is most frequent in Newcastle (42.9%), reflecting common guest stay durations or potential owner blocking patterns.
- A notable 9.5% of properties secure long booking periods (181+ days booked per year), highlighting successful long-term rental strategies or significant owner usage.
Newcastle Airbnb Minimum Stay Requirements Analysis
Distribution of Listings by Minimum Night Requirement
1 Night
4 listings
19% of total
2 Nights
3 listings
14.3% of total
3 Nights
2 listings
9.5% of total
4-6 Nights
3 listings
14.3% of total
7-29 Nights
1 listings
4.8% of total
30+ Nights
8 listings
38.1% of total
Key Insights
- The most prevalent minimum stay requirement in Newcastle is 30+ Nights, adopted by 38.1% of listings. This highlights the market's preference for longer commitments.
- A significant segment (38.1%) caters to monthly stays (30+ nights) in Newcastle, pointing to opportunities in the extended-stay market.
Recommendations
- Align with the market by considering a 30+ Nights minimum stay, as 38.1% of Newcastle hosts use this setting.
- If feasible, allowing 1-night stays, especially midweek or during low season, could capture last-minute bookings, as only 19% currently do.
- Explore offering discounts for stays of 30+ nights to attract the 38.1% of the market seeking extended stays.
- Adjust minimum nights based on seasonality – potentially shorter during low season and longer during peak demand periods in Newcastle.
Newcastle Airbnb Cancellation Policy Trends Analysis (2026)
Super Strict 30 Days
1 listings
4.8% of total
Flexible
4 listings
19% of total
Moderate
6 listings
28.6% of total
Firm
7 listings
33.3% of total
Strict
3 listings
14.3% of total
Cancellation Policy Insights for Newcastle
- The prevailing Airbnb cancellation policy trend in Newcastle is Firm, used by 33.3% of listings.
- There's a relatively balanced mix between guest-friendly (47.6%) and stricter (47.6%) policies, offering choices for different guest needs.
Recommendations for Hosts
- Consider adopting a Firm policy to align with the 33.3% market standard in Newcastle.
- Using a Strict policy might deter some guests, as only 14.3% of listings use it. Evaluate if potential revenue protection outweighs possible lower booking rates.
- Regularly review your cancellation policy against competitors and market demand shifts in Newcastle.
Newcastle STR Booking Lead Time Analysis (2026)
Average Booking Lead Time by Month
Booking Lead Time Insights for Newcastle
- The overall average booking lead time for vacation rentals in Newcastle is 82 days.
- Guests book furthest in advance for stays during July (average 106 days), likely coinciding with peak travel demand or local events.
- The shortest booking windows occur for stays in January (average 16 days), indicating more last-minute travel plans during this time.
- Seasonally, Summer (96 days avg.) sees the longest lead times, while Winter (25 days avg.) has the shortest, reflecting typical travel planning cycles.
Recommendations for Hosts
- Use the overall average lead time (82 days) as a baseline for your pricing and availability strategy in Newcastle.
- For July stays, consider implementing length-of-stay discounts or slightly higher rates for bookings made less than 106 days out to capitalize on advance planning.
- Target marketing efforts for the Summer season well in advance (at least 96 days) to capture early planners.
- Monitor your own booking lead times against these Newcastle averages to identify opportunities for dynamic pricing adjustments.
Popular & Essential Airbnb Amenities in Newcastle (2026)
Amenity Prevalence
Amenity Insights for Newcastle
- Essential amenities in Newcastle that guests expect include: Free parking on premises, Kitchen, Coffee maker, Dishes and silverware. Lacking these (any) could significantly impact bookings.
- Popular amenities like Smoke alarm, Fire extinguisher, Hangers are common but not universal. Offering these can provide a competitive edge.
Recommendations for Hosts
- Ensure your listing includes all essential amenities for Newcastle: Free parking on premises, Kitchen, Coffee maker, Dishes and silverware.
- Prioritize adding missing essentials: Coffee maker, Dishes and silverware.
- Consider adding popular differentiators like Smoke alarm or Fire extinguisher to increase appeal.
- Highlight unique or less common amenities you offer (e.g., hot tub, dedicated workspace, EV charger) in your listing description and photos.
- Regularly check competitor amenities in Newcastle to stay competitive.
Newcastle Airbnb Guest Demographics & Profile Analysis (2026)
Guest Profile Summary for Newcastle
- The typical guest profile for Airbnb in Newcastle consists of primarily domestic travelers (98%), often arriving from nearby New York, typically belonging to the Post-2000s (Gen Z/Alpha) group (50%), primarily speaking English or Spanish.
- Domestic travelers account for 97.8% of guests.
- Key international markets include United States (97.8%) and DC (0.7%).
- Top languages spoken are English (68.9%) followed by Spanish (11.1%).
- A significant demographic segment is the Post-2000s (Gen Z/Alpha) group, representing 50% of guests.
Recommendations for Hosts
- Target domestic marketing efforts towards travelers from New York and Boston.
- Tailor amenities and listing descriptions to appeal to the dominant Post-2000s (Gen Z/Alpha) demographic (e.g., highlight fast WiFi, smart home features, local guides).
- Highlight unique local experiences or amenities relevant to the primary guest profile.
- Consider seasonal promotions aligned with peak travel times for key origin markets.
Nearby Short-Term Rental Market Comparison
How does the Newcastle Airbnb market stack up against its neighbors? Compare key performance metrics like average monthly revenue, ADR, and occupancy rates in surrounding areas to understand the broader regional STR landscape.
| Market | Active Properties | Monthly Revenue | Daily Rate | Avg. Occupancy |
|---|---|---|---|---|
| South Berwick | 12 | $5,351 | $228.88 | 58% |
| Kennebunkport | 152 | $5,309 | $669.87 | 43% |
| Bar Harbor | 510 | $5,047 | $413.86 | 58% |
| Kennebunk | 228 | $4,794 | $523.86 | 45% |
| Falmouth | 63 | $4,691 | $450.26 | 51% |
| Mount Desert | 198 | $4,605 | $435.23 | 52% |
| Trenton | 141 | $4,555 | $388.61 | 57% |
| Tremont | 158 | $4,450 | $380.52 | 55% |
| Manchester | 12 | $4,389 | $406.26 | 46% |
| Sanford | 25 | $4,331 | $328.21 | 47% |