Embden Airbnb Market Analysis 2026: Short Term Rental Data & Vacation Rental Statistics in Maine, United States
Is Airbnb profitable in Embden in 2026? Explore comprehensive Airbnb analytics for Embden, Maine, United States to uncover income potential. This 2026 STR market report for Embden, based on AirROI data from February 2025 to January 2026, reveals key trends in the niche market of 31 active listings.
Whether you're considering an Airbnb investment in Embden, optimizing your existing vacation rental, or exploring rental arbitrage opportunities, understanding the Embden Airbnb data is crucial. Leveraging the low regulation environment is key to maximizing your short term rental income potential. Let's dive into the specifics.
Key Embden Airbnb Performance Metrics Overview
Monthly Airbnb Revenue Variations & Income Potential in Embden (2026)
Understanding the monthly revenue variations for Airbnb listings in Embden is key to maximizing your short term rental income potential. Seasonality significantly impacts earnings. Our analysis, based on data from the past 12 months, shows that the peak revenue month for STRs in Embden is typically July, while April often presents the lowest earnings, highlighting opportunities for strategic pricing adjustments during shoulder and low seasons. Explore the typical Airbnb income in Embden across different performance tiers:
- Best-in-class properties (Top 10%) achieve $7,469+ monthly, often utilizing dynamic pricing and superior guest experiences.
- Strong performing properties (Top 25%) earn $4,723 or more, indicating effective management and desirable locations/amenities.
- Typical properties (Median) generate around $2,775 per month, representing the average market performance.
- Entry-level properties (Bottom 25%) see earnings around $1,583, often with potential for optimization.
Average Monthly Airbnb Earnings Trend in Embden
Embden Airbnb Occupancy Rate Trends (2026)
Maximize your bookings by understanding the Embden STR occupancy trends. Seasonal demand shifts significantly influence how often properties are booked. Typically, Julysees the highest demand (peak season occupancy), while January experiences the lowest (low season). Effective strategies, like adjusting minimum stays or offering promotions, can boost occupancy during slower periods. Here's how different property tiers perform in Embden:
- Best-in-class properties (Top 10%) achieve 59%+ occupancy, indicating high desirability and potentially optimized availability.
- Strong performing properties (Top 25%) maintain 42% or higher occupancy, suggesting good market fit and guest satisfaction.
- Typical properties (Median) have an occupancy rate around 31%.
- Entry-level properties (Bottom 25%) average 18% occupancy, potentially facing higher vacancy.
Average Monthly Occupancy Rate Trend in Embden
Average Daily Rate (ADR) Airbnb Trends in Embden (2026)
Effective short term rental pricing strategy in Embden involves understanding monthly ADR fluctuations. The Average Daily Rate (ADR) for Airbnb in Embden typically peaks in September and dips lowest during March. Leveraging Airbnb dynamic pricing tools or strategies based on this seasonality can significantly boost revenue. Here's a look at the typical nightly rates achieved:
- Best-in-class properties (Top 10%) command rates of $539+ per night, often due to premium features or locations.
- Strong performing properties (Top 25%) achieve nightly rates of $382 or more.
- Typical properties (Median) charge around $280 per night.
- Entry-level properties (Bottom 25%) earn around $216 per night.
Average Daily Rate (ADR) Trend by Month in Embden
Get Live Embden Market Intelligence 👇

Explore Real-time Analytics
Airbnb Seasonality Analysis & Trends in Embden (2026)
Peak Season (July, August, February)
- Revenue averages $6,319 per month
- Occupancy rates average 54.5%
- Daily rates average $327
Shoulder Season
- Revenue averages $3,089 per month
- Occupancy maintains around 27.4%
- Daily rates hold near $327
Low Season (April, September, November)
- Revenue drops to average $2,347 per month
- Occupancy decreases to average 21.1%
- Daily rates adjust to average $327
Seasonality Insights for Embden
- The Airbnb seasonality in Embden shows highly seasonal trends requiring careful strategy. While the sections above show seasonal averages, it's also insightful to look at the extremes:
- During the high season, the absolute peak month showcases Embden's highest earning potential, with monthly revenues capable of climbing to $7,973, occupancy reaching a high of 64.1%, and ADRs peaking at $342.
- Conversely, the slowest single month of the year, typically falling within the low season, marks the market's lowest point. In this month, revenue might dip to $2,137, occupancy could drop to 18.3%, and ADRs may adjust down to $302.
- Understanding both the seasonal averages and these monthly peaks and troughs in revenue, occupancy, and ADR is crucial for maximizing your Airbnb profit potential in Embden.
Seasonal Strategies for Maximizing Profit
- Peak Season: Maximize revenue through premium pricing and potentially longer minimum stays. Ensure high availability.
- Low Season: Offer competitive pricing, special promotions (e.g., extended stay discounts), and flexible cancellation policies. Target off-season travelers like remote workers or budget-conscious guests.
- Shoulder Seasons: Implement dynamic pricing that balances peak and low rates. Target weekend travelers or specific events. Offer slightly more flexible terms than peak season.
- Regularly analyze your own performance against these Embden seasonality benchmarks and adjust your pricing and availability strategy accordingly.
Best Areas for Airbnb Investment in Embden (2026)
Exploring the top neighborhoods for short-term rentals in Embden? This section highlights key areas, outlining why they are attractive for hosts and guests, along with notable local attractions. Consider these locations based on your target guest profile and investment strategy.
| Neighborhood / Area | Why Host Here? (Target Guests & Appeal) | Key Attractions & Landmarks |
|---|---|---|
| Sebago Lake | A popular destination for outdoor enthusiasts, Sebago Lake offers a variety of recreational activities including swimming, boating, and fishing. The natural beauty and accessibility make it a prime location for tourists seeking a getaway. | Sebago Lake State Park, Naples Causeway, Boat rentals, Sebago Lake beaches, Windham State Park |
| Moosehead Lake | The largest lake in Maine, Moosehead Lake is known for its stunning scenery and outdoor activities such as hiking, snowmobiling, and wildlife watching. It attracts visitors year-round, making it an ideal spot for Airbnb hosting. | Moosehead Lake Region, Kineo Island, Mount Kineo, Moosehead Marine Museum, ATV and snowmobile trails |
| Portland | Maine's largest city, Portland boasts a vibrant arts scene, historic architecture, and a strong culinary reputation. It is a popular destination for travelers looking for urban and coastal experiences. | Old Port, Portland Head Light, Eastern Promenade, Casco Bay Islands, World-class restaurants and breweries |
| Bar Harbor | Bar Harbor is the gateway to Acadia National Park and attracts numerous visitors each year for its natural beauty and outdoor adventures. It's a tourist magnet, especially in the summer and fall months. | Acadia National Park, Cadillac Mountain, Bar Harbor Village, Thunder Hole, Various hiking trails |
| Camden | This picturesque coastal town is known for its charming downtown and stunning harbor views. Camden is popular for its outdoor activities and scenic attractions, making it a sought-after Airbnb location. | Camden Harbor, Camden Hills State Park, Mount Battie, Camden Public Library, Scenic boat tours |
| Kennebunkport | A historic seaside village that is a favorite among tourists, Kennebunkport offers beautiful beaches, quaint shops, and lovely dining options. Its charm makes it a prime location for short-term rentals. | Dock Square, Goose Rocks Beach, Cape Porpoise, Rachel Carson National Wildlife Refuge, Historic homes and tours |
| York | Known for its beaches and family-friendly attractions, York is popular with summer tourists. The area offers a variety of activities from amusement parks to waterfront dining, making it a potential hotspot for Airbnb hosts. | York Beach, Short Sands Beach, Nubble Lighthouse, York's Wild Kingdom, The Old York Historical Society |
| Bridgton | Located near the scenic western Maine foothills, Bridgton is popular for its lakes and outdoor activities. Its proximity to ski resorts and lakes makes it a great year-round destination for visitors. | Bridgton Academy, Long Lake, Shawnee Peak ski area, Songo River, Bridgton Historical Society |
Understanding Airbnb License Requirements & STR Laws in Embden (2026)
While Embden, Maine, United States currently shows low STR regulations, specific Airbnb license requirements might still exist or change. Always verify the latest short term rental regulations and Airbnb license requirements directly with local government authorities for Embden to ensure full compliance before hosting.
(Source: AirROI data, 2026, finding no licensed listings among those analyzed)
Top Performing Airbnb Properties in Embden (2026)
Benchmark your potential! Explore examples of top-performing Airbnb properties in Embdenbased on Trailing Twelve Month (TTM) revenue. Analyze their characteristics, revenue, occupancy rate, and ADR to understand what drives success in this market.
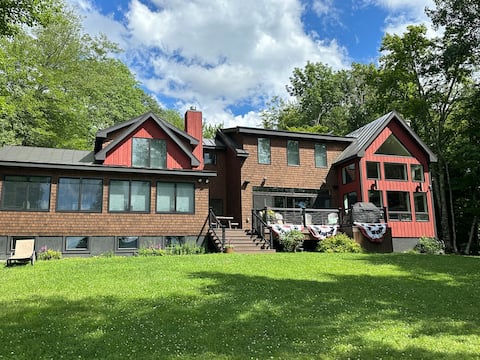
Serene Lakeside Camp - Embden, ME
Entire Place • 6 bedrooms
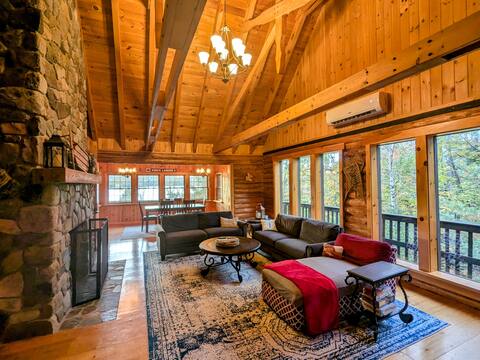
Ultimate Getaway for 24! Kayaks & dock, on trails
Entire Place • 9 bedrooms

A Christmas movie house! Entire home for 16
Entire Place • 6 bedrooms
Spacious 3 cabin compound w/docks on pristine lake
Entire Place • 6 bedrooms

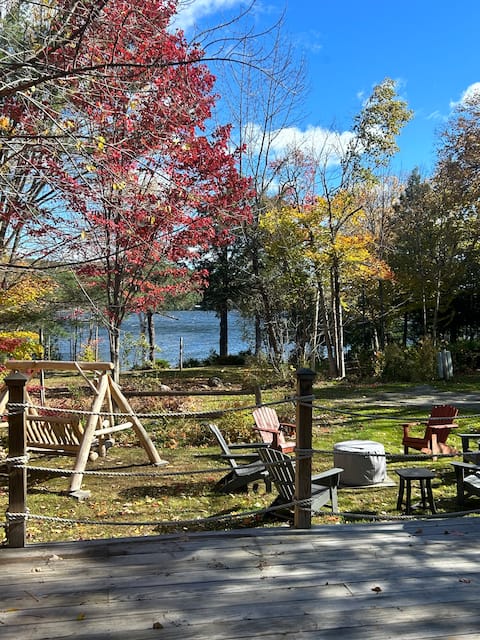
Gorgeous lakefront, sunsets, kayaks, fire pit
Entire Place • 3 bedrooms

Lakehouse for 16 w/dock on trail system!
Entire Place • 6 bedrooms
Note: Performance varies based on location, size, amenities, seasonality, and management quality. Data reflects the past 12 months.
Top Performing Airbnb Hosts in Embden (2026)
Learn from the best! This table showcases top-performing Airbnb hosts in Embden based on the number of properties managed and estimated total revenue over the past year. Analyze their scale and performance metrics.
| Host Name | Properties | Grossing Revenue | Stay Reviews | Avg Rating |
|---|---|---|---|---|
| Angel | 4 | $232,438 | 88 | 4.90/5.0 |
| Justin | 1 | $133,628 | 12 | 5.00/5.0 |
| Michelle | 2 | $76,631 | 22 | 4.90/5.0 |
| Samantha | 2 | $46,178 | 115 | 4.92/5.0 |
| Leslie | 1 | $41,233 | 115 | 4.82/5.0 |
| Christy | 2 | $40,782 | 50 | 4.97/5.0 |
| Kayla | 1 | $33,839 | 30 | 4.87/5.0 |
| Joanna | 1 | $32,902 | 17 | 5.00/5.0 |
| Evolve | 1 | $29,452 | 15 | 4.53/5.0 |
| Odette | 1 | $28,489 | 9 | 4.56/5.0 |
Analyzing the strategies of top hosts, such as their property selection, pricing, and guest communication, can offer valuable lessons for optimizing your own Airbnb operations in Embden.
Dive Deeper: Advanced Embden STR Market Data (2026)
Ready to unlock more insights? AirROI provides access to advanced metrics and comprehensive Airbnb data for Embden. Explore detailed analytics beyond this report to refine your investment strategy, optimize pricing, and maximize your vacation rental profits.
Explore Advanced MetricsEmbden Short-Term Rental Market Composition (2026): Property & Room Types
Room Type Distribution
Property Type Distribution
Market Composition Insights for Embden
- The Embden Airbnb market composition is heavily skewed towards Entire Home/Apt listings, which make up 100% of the 31 active rentals. This indicates strong guest preference for privacy and space.
- Looking at the property type distribution in Embden, House properties are the most common (54.8%), reflecting the local real estate landscape.
- Houses represent a significant 54.8% portion, catering likely to families or larger groups.
Embden Airbnb Room Capacity Analysis (2026): Bedroom Distribution
Distribution of Listings by Number of Bedrooms
Room Capacity Insights for Embden
- The dominant room capacity in Embden is 3 bedrooms listings, making up 38.7% of the market. This suggests a strong demand for properties suitable for families or small groups.
- Together, 3 bedrooms and 2 bedrooms properties represent 64.5% of the active Airbnb listings in Embden, indicating a high concentration in these sizes.
- A significant 67.8% of listings offer 3+ bedrooms, catering to larger groups and families seeking more space in Embden.
Embden Vacation Rental Guest Capacity Trends (2026)
Distribution of Listings by Guest Capacity
Guest Capacity Insights for Embden
- The most common guest capacity trend in Embden vacation rentals is listings accommodating 8+ guests (45.2%). This suggests the primary traveler segment is likely larger groups.
- Properties designed for 8+ guests and 6 guests dominate the Embden STR market, accounting for 77.5% of listings.
- 84.0% of properties accommodate 6+ guests, serving the market segment for larger families or group travel in Embden.
- On average, properties in Embden are equipped to host 6.6 guests.
Embden Airbnb Booking Patterns (2026): Available vs. Booked Days
Available Days Distribution
Booked Days Distribution
Booking Pattern Insights for Embden
- The most common availability pattern in Embden falls within the 271-366 days range, representing 67.7% of listings. This suggests many properties have significant open periods on their calendars.
- Approximately 96.7% of listings show high availability (181+ days open annually), indicating potential for increased bookings or specific owner usage patterns.
- For booked days, the 31-90 days range is most frequent in Embden (32.3%), reflecting common guest stay durations or potential owner blocking patterns.
- A notable 3.2% of properties secure long booking periods (181+ days booked per year), highlighting successful long-term rental strategies or significant owner usage.
Embden Airbnb Minimum Stay Requirements Analysis
Distribution of Listings by Minimum Night Requirement
1 Night
7 listings
22.6% of total
2 Nights
7 listings
22.6% of total
3 Nights
2 listings
6.5% of total
4-6 Nights
1 listings
3.2% of total
7-29 Nights
3 listings
9.7% of total
30+ Nights
11 listings
35.5% of total
Key Insights
- The most prevalent minimum stay requirement in Embden is 30+ Nights, adopted by 35.5% of listings. This highlights the market's preference for longer commitments.
- A significant segment (35.5%) caters to monthly stays (30+ nights) in Embden, pointing to opportunities in the extended-stay market.
Recommendations
- Align with the market by considering a 30+ Nights minimum stay, as 35.5% of Embden hosts use this setting.
- If feasible, allowing 1-night stays, especially midweek or during low season, could capture last-minute bookings, as only 22.6% currently do.
- Explore offering discounts for stays of 30+ nights to attract the 35.5% of the market seeking extended stays.
- Adjust minimum nights based on seasonality – potentially shorter during low season and longer during peak demand periods in Embden.
Embden Airbnb Cancellation Policy Trends Analysis (2026)
Super Strict 30 Days
1 listings
3.2% of total
Flexible
6 listings
19.4% of total
Moderate
7 listings
22.6% of total
Firm
12 listings
38.7% of total
Strict
5 listings
16.1% of total
Cancellation Policy Insights for Embden
- The prevailing Airbnb cancellation policy trend in Embden is Firm, used by 38.7% of listings.
- A majority (54.8%) of hosts in Embden utilize Firm or Strict policies, indicating a market where hosts prioritize booking security.
Recommendations for Hosts
- Consider adopting a Firm policy to align with the 38.7% market standard in Embden.
- Regularly review your cancellation policy against competitors and market demand shifts in Embden.
Embden STR Booking Lead Time Analysis (2026)
Average Booking Lead Time by Month
Booking Lead Time Insights for Embden
- The overall average booking lead time for vacation rentals in Embden is 67 days.
- Guests book furthest in advance for stays during November (average 117 days), likely coinciding with peak travel demand or local events.
- The shortest booking windows occur for stays in March (average 16 days), indicating more last-minute travel plans during this time.
- Seasonally, Summer (91 days avg.) sees the longest lead times, while Winter (54 days avg.) has the shortest, reflecting typical travel planning cycles.
Recommendations for Hosts
- Use the overall average lead time (67 days) as a baseline for your pricing and availability strategy in Embden.
- For November stays, consider implementing length-of-stay discounts or slightly higher rates for bookings made less than 117 days out to capitalize on advance planning.
- Target marketing efforts for the Summer season well in advance (at least 91 days) to capture early planners.
- Monitor your own booking lead times against these Embden averages to identify opportunities for dynamic pricing adjustments.
Popular & Essential Airbnb Amenities in Embden (2026)
Amenity Prevalence
Amenity Insights for Embden
- Essential amenities in Embden that guests expect include: Kitchen, Free parking on premises, Smoke alarm, Carbon monoxide alarm, Fire extinguisher. Lacking these (any) could significantly impact bookings.
- Popular amenities like Heating, Wifi, Hot water are common but not universal. Offering these can provide a competitive edge.
- Warning: Wifi is not universally provided but is considered essential globally. Ensure reliable Wifi is offered.
Recommendations for Hosts
- Ensure your listing includes all essential amenities for Embden: Kitchen, Free parking on premises, Smoke alarm, Carbon monoxide alarm, Fire extinguisher.
- Prioritize adding missing essentials: Carbon monoxide alarm, Fire extinguisher.
- Consider adding popular differentiators like Heating or Wifi to increase appeal.
- Highlight unique or less common amenities you offer (e.g., hot tub, dedicated workspace, EV charger) in your listing description and photos.
- Regularly check competitor amenities in Embden to stay competitive.
Embden Airbnb Guest Demographics & Profile Analysis (2026)
Guest Profile Summary for Embden
- The typical guest profile for Airbnb in Embden consists of primarily domestic travelers (98%), often arriving from nearby Portland, typically belonging to the Post-2000s (Gen Z/Alpha) group (50%), primarily speaking English or Spanish.
- Domestic travelers account for 97.6% of guests.
- Key international markets include United States (97.6%) and France (1.2%).
- Top languages spoken are English (81%) followed by Spanish (9.5%).
- A significant demographic segment is the Post-2000s (Gen Z/Alpha) group, representing 50% of guests.
Recommendations for Hosts
- Target domestic marketing efforts towards travelers from Portland and Boston.
- Tailor amenities and listing descriptions to appeal to the dominant Post-2000s (Gen Z/Alpha) demographic (e.g., highlight fast WiFi, smart home features, local guides).
- Highlight unique local experiences or amenities relevant to the primary guest profile.
- Consider seasonal promotions aligned with peak travel times for key origin markets.
Nearby Short-Term Rental Market Comparison
How does the Embden Airbnb market stack up against its neighbors? Compare key performance metrics like average monthly revenue, ADR, and occupancy rates in surrounding areas to understand the broader regional STR landscape.
| Market | Active Properties | Monthly Revenue | Daily Rate | Avg. Occupancy |
|---|---|---|---|---|
| South Berwick | 12 | $5,351 | $228.88 | 58% |
| Kennebunkport | 152 | $5,309 | $669.87 | 43% |
| Bar Harbor | 510 | $5,047 | $413.86 | 58% |
| Kennebunk | 228 | $4,794 | $523.86 | 45% |
| Falmouth | 63 | $4,691 | $450.26 | 51% |
| Mount Desert | 198 | $4,605 | $435.23 | 52% |
| Trenton | 141 | $4,555 | $388.61 | 57% |
| Tremont | 158 | $4,450 | $380.52 | 55% |
| Manchester | 12 | $4,389 | $406.26 | 46% |
| Sanford | 25 | $4,331 | $328.21 | 47% |