Eastbrook Airbnb Market Analysis 2026: Short Term Rental Data & Vacation Rental Statistics in Maine, United States
Is Airbnb profitable in Eastbrook in 2026? Explore comprehensive Airbnb analytics for Eastbrook, Maine, United States to uncover income potential. This 2026 STR market report for Eastbrook, based on AirROI data from February 2025 to January 2026, reveals key trends in the niche market of 20 active listings.
Whether you're considering an Airbnb investment in Eastbrook, optimizing your existing vacation rental, or exploring rental arbitrage opportunities, understanding the Eastbrook Airbnb data is crucial. Leveraging the low regulation environment is key to maximizing your short term rental income potential. Let's dive into the specifics.
Key Eastbrook Airbnb Performance Metrics Overview
Monthly Airbnb Revenue Variations & Income Potential in Eastbrook (2026)
Understanding the monthly revenue variations for Airbnb listings in Eastbrook is key to maximizing your short term rental income potential. Seasonality significantly impacts earnings. Our analysis, based on data from the past 12 months, shows that the peak revenue month for STRs in Eastbrook is typically July, while March often presents the lowest earnings, highlighting opportunities for strategic pricing adjustments during shoulder and low seasons. Explore the typical Airbnb income in Eastbrook across different performance tiers:
- Best-in-class properties (Top 10%) achieve $5,161+ monthly, often utilizing dynamic pricing and superior guest experiences.
- Strong performing properties (Top 25%) earn $4,157 or more, indicating effective management and desirable locations/amenities.
- Typical properties (Median) generate around $2,530 per month, representing the average market performance.
- Entry-level properties (Bottom 25%) see earnings around $1,569, often with potential for optimization.
Average Monthly Airbnb Earnings Trend in Eastbrook
Eastbrook Airbnb Occupancy Rate Trends (2026)
Maximize your bookings by understanding the Eastbrook STR occupancy trends. Seasonal demand shifts significantly influence how often properties are booked. Typically, Novembersees the highest demand (peak season occupancy), while January experiences the lowest (low season). Effective strategies, like adjusting minimum stays or offering promotions, can boost occupancy during slower periods. Here's how different property tiers perform in Eastbrook:
- Best-in-class properties (Top 10%) achieve 80%+ occupancy, indicating high desirability and potentially optimized availability.
- Strong performing properties (Top 25%) maintain 66% or higher occupancy, suggesting good market fit and guest satisfaction.
- Typical properties (Median) have an occupancy rate around 45%.
- Entry-level properties (Bottom 25%) average 26% occupancy, potentially facing higher vacancy.
Average Monthly Occupancy Rate Trend in Eastbrook
Average Daily Rate (ADR) Airbnb Trends in Eastbrook (2026)
Effective short term rental pricing strategy in Eastbrook involves understanding monthly ADR fluctuations. The Average Daily Rate (ADR) for Airbnb in Eastbrook typically peaks in July and dips lowest during April. Leveraging Airbnb dynamic pricing tools or strategies based on this seasonality can significantly boost revenue. Here's a look at the typical nightly rates achieved:
- Best-in-class properties (Top 10%) command rates of $289+ per night, often due to premium features or locations.
- Strong performing properties (Top 25%) achieve nightly rates of $252 or more.
- Typical properties (Median) charge around $208 per night.
- Entry-level properties (Bottom 25%) earn around $178 per night.
Average Daily Rate (ADR) Trend by Month in Eastbrook
Get Live Eastbrook Market Intelligence 👇

Explore Real-time Analytics
Airbnb Seasonality Analysis & Trends in Eastbrook (2026)
Peak Season (July, August, September)
- Revenue averages $4,556 per month
- Occupancy rates average 62.0%
- Daily rates average $220
Shoulder Season
- Revenue averages $2,879 per month
- Occupancy maintains around 45.9%
- Daily rates hold near $209
Low Season (February, March, December)
- Revenue drops to average $1,507 per month
- Occupancy decreases to average 37.7%
- Daily rates adjust to average $201
Seasonality Insights for Eastbrook
- The Airbnb seasonality in Eastbrook shows highly seasonal trends requiring careful strategy. While the sections above show seasonal averages, it's also insightful to look at the extremes:
- During the high season, the absolute peak month showcases Eastbrook's highest earning potential, with monthly revenues capable of climbing to $5,062, occupancy reaching a high of 69.2%, and ADRs peaking at $223.
- Conversely, the slowest single month of the year, typically falling within the low season, marks the market's lowest point. In this month, revenue might dip to $1,181, occupancy could drop to 9.7%, and ADRs may adjust down to $193.
- Understanding both the seasonal averages and these monthly peaks and troughs in revenue, occupancy, and ADR is crucial for maximizing your Airbnb profit potential in Eastbrook.
Seasonal Strategies for Maximizing Profit
- Peak Season: Maximize revenue through premium pricing and potentially longer minimum stays. Ensure high availability.
- Low Season: Offer competitive pricing, special promotions (e.g., extended stay discounts), and flexible cancellation policies. Target off-season travelers like remote workers or budget-conscious guests.
- Shoulder Seasons: Implement dynamic pricing that balances peak and low rates. Target weekend travelers or specific events. Offer slightly more flexible terms than peak season.
- Regularly analyze your own performance against these Eastbrook seasonality benchmarks and adjust your pricing and availability strategy accordingly.
Best Areas for Airbnb Investment in Eastbrook (2026)
Exploring the top neighborhoods for short-term rentals in Eastbrook? This section highlights key areas, outlining why they are attractive for hosts and guests, along with notable local attractions. Consider these locations based on your target guest profile and investment strategy.
| Neighborhood / Area | Why Host Here? (Target Guests & Appeal) | Key Attractions & Landmarks |
|---|---|---|
| Eastbrook Village | A charming and quaint village atmosphere, perfect for those looking for a peaceful retreat. Eastbrook is surrounded by natural beauty, making it an attractive option for nature lovers and outdoor enthusiasts. | Eastbrook Pond, Acadia National Park, Schoodic Peninsula, Bar Harbor, Maine Coast |
| Mount Desert Island | A popular area known for its stunning landscapes and proximity to Acadia National Park. It offers a mix of outdoor activities and charming towns, appealing to tourists year-round. | Acadia National Park, Sand Beach, Cadillac Mountain, Bar Harbor, Thunder Hole |
| Downeast Maine | An unspoiled, scenic region that attracts visitors seeking tranquility and outdoor adventures. The rugged coastline and small towns provide a unique experience. | Lubec, Campobello Island, Roosevelt Campobello International Park, Quoddy Head State Park |
| Ellsworth | A central hub for the Downeast region, offering visitors access to both the coast and Acadia National Park. Known for its local shops and restaurants. | Union River, Woodlawn Museum, Ellsworth Historical Society, Maine Coast Mall |
| Trenton | The gateway to Mount Desert Island and Acadia, Trenton attracts visitors looking for convenient access to both the island and the mainland. | Trenton Bridge Lobster Pound, Lamoine State Park, Mount Desert Island |
| Surry | A quiet, picturesque town that attracts those seeking peace and relaxation, with scenic views and a friendly community atmosphere. | Surry Gardens, Ellsworth Bay, Maine Coast Heritage Trust |
| Orland | Known for its beautiful lakes and rural charm, Orland offers visitors a chance to experience the natural beauty of Maine away from the busier tourist spots. | Great Pond, Orland Village, Boyden Lake |
| Castine | A historic coastal town that offers rich history and beautiful waterfront views. Castine is appealing for those interested in history and maritime culture. | Castine Historical Society, Fort George, Dyce Head Lighthouse |
Understanding Airbnb License Requirements & STR Laws in Eastbrook (2026)
While Eastbrook, Maine, United States currently shows low STR regulations, specific Airbnb license requirements might still exist or change. Always verify the latest short term rental regulations and Airbnb license requirements directly with local government authorities for Eastbrook to ensure full compliance before hosting.
(Source: AirROI data, 2026, finding no licensed listings among those analyzed)
Top Performing Airbnb Properties in Eastbrook (2026)
Benchmark your potential! Explore examples of top-performing Airbnb properties in Eastbrookbased on Trailing Twelve Month (TTM) revenue. Analyze their characteristics, revenue, occupancy rate, and ADR to understand what drives success in this market.
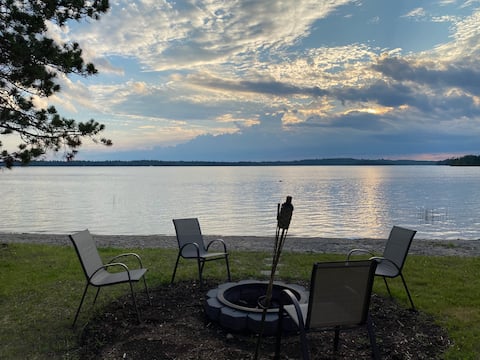
The Maine Getaway - Lakefront with Beach
Entire Place • 1 bedroom
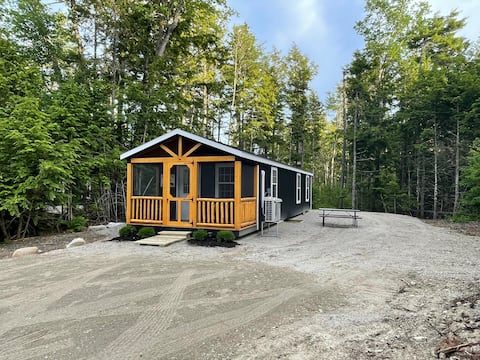
Bear Cabin Near Acadia, Downeast Maine, Fishing
Entire Place • 2 bedrooms
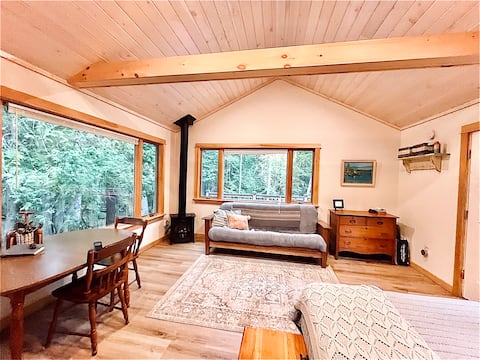
Hemlock Cabin.
Entire Place • N/A
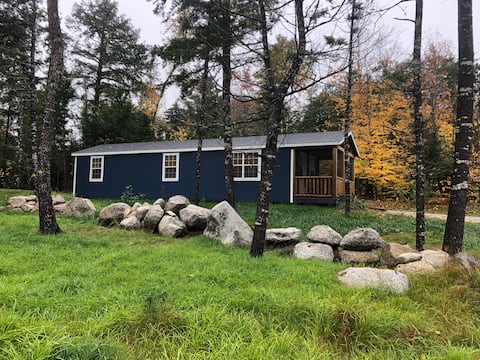
Maine Blueberry Cabin - Fishing Acadia Family Fun
Entire Place • 2 bedrooms
Pinecone Cabin in Eastbrook, Enjoy all of Maine!
Entire Place • 2 bedrooms
Eastbrook 2 bedroom home, close to Acadia Ntl Park
Entire Place • 2 bedrooms
Note: Performance varies based on location, size, amenities, seasonality, and management quality. Data reflects the past 12 months.
Top Performing Airbnb Hosts in Eastbrook (2026)
Learn from the best! This table showcases top-performing Airbnb hosts in Eastbrook based on the number of properties managed and estimated total revenue over the past year. Analyze their scale and performance metrics.
| Host Name | Properties | Grossing Revenue | Stay Reviews | Avg Rating |
|---|---|---|---|---|
| Amy | 4 | $154,909 | 582 | 4.96/5.0 |
| Susan | 2 | $51,211 | 10 | 4.70/5.0 |
| Jordyn | 1 | $46,254 | 149 | 4.99/5.0 |
| Lindsey | 1 | $41,712 | 310 | 4.95/5.0 |
| Kimberly | 2 | $32,187 | 84 | 4.92/5.0 |
| Lisbeth | 1 | $29,391 | 97 | 4.99/5.0 |
| Ron | 1 | $23,936 | 22 | 4.91/5.0 |
| Evolve | 1 | $19,010 | 16 | 5.00/5.0 |
| Salt Air | 1 | $18,647 | 8 | 4.88/5.0 |
| Terri | 1 | $15,704 | 52 | 4.83/5.0 |
Analyzing the strategies of top hosts, such as their property selection, pricing, and guest communication, can offer valuable lessons for optimizing your own Airbnb operations in Eastbrook.
Dive Deeper: Advanced Eastbrook STR Market Data (2026)
Ready to unlock more insights? AirROI provides access to advanced metrics and comprehensive Airbnb data for Eastbrook. Explore detailed analytics beyond this report to refine your investment strategy, optimize pricing, and maximize your vacation rental profits.
Explore Advanced MetricsEastbrook Short-Term Rental Market Composition (2026): Property & Room Types
Room Type Distribution
Property Type Distribution
Market Composition Insights for Eastbrook
- The Eastbrook Airbnb market composition is heavily skewed towards Entire Home/Apt listings, which make up 100% of the 20 active rentals. This indicates strong guest preference for privacy and space.
- Looking at the property type distribution in Eastbrook, Outdoor/Unique properties are the most common (55%), reflecting the local real estate landscape.
- Houses represent a significant 35% portion, catering likely to families or larger groups.
Eastbrook Airbnb Room Capacity Analysis (2026): Bedroom Distribution
Distribution of Listings by Number of Bedrooms
Room Capacity Insights for Eastbrook
- The dominant room capacity in Eastbrook is 2 bedrooms listings, making up 50% of the market. This suggests a strong demand for properties suitable for couples or solo travelers.
- Together, 2 bedrooms and 1 bedroom properties represent 75.0% of the active Airbnb listings in Eastbrook, indicating a high concentration in these sizes.
Eastbrook Vacation Rental Guest Capacity Trends (2026)
Distribution of Listings by Guest Capacity
Guest Capacity Insights for Eastbrook
- The most common guest capacity trend in Eastbrook vacation rentals is listings accommodating 6 guests (45%). This suggests the primary traveler segment is likely larger groups.
- Properties designed for 6 guests and 2 guests dominate the Eastbrook STR market, accounting for 65.0% of listings.
- 55.0% of properties accommodate 6+ guests, serving the market segment for larger families or group travel in Eastbrook.
- On average, properties in Eastbrook are equipped to host 4.8 guests.
Eastbrook Airbnb Booking Patterns (2026): Available vs. Booked Days
Available Days Distribution
Booked Days Distribution
Booking Pattern Insights for Eastbrook
- The most common availability pattern in Eastbrook falls within the 271-366 days range, representing 50% of listings. This suggests many properties have significant open periods on their calendars.
- Approximately 75.0% of listings show high availability (181+ days open annually), indicating potential for increased bookings or specific owner usage patterns.
- For booked days, the 31-90 days range is most frequent in Eastbrook (35%), reflecting common guest stay durations or potential owner blocking patterns.
- A notable 25.0% of properties secure long booking periods (181+ days booked per year), highlighting successful long-term rental strategies or significant owner usage.
Eastbrook Airbnb Minimum Stay Requirements Analysis
Distribution of Listings by Minimum Night Requirement
1 Night
3 listings
15% of total
3 Nights
3 listings
15% of total
4-6 Nights
4 listings
20% of total
7-29 Nights
2 listings
10% of total
30+ Nights
8 listings
40% of total
Key Insights
- The most prevalent minimum stay requirement in Eastbrook is 30+ Nights, adopted by 40% of listings. This highlights the market's preference for longer commitments.
- Very short stays (1-2 nights) are less common (15.0%), suggesting hosts prefer slightly longer bookings to optimize turnover.
- A significant segment (40%) caters to monthly stays (30+ nights) in Eastbrook, pointing to opportunities in the extended-stay market.
Recommendations
- Align with the market by considering a 30+ Nights minimum stay, as 40% of Eastbrook hosts use this setting.
- If feasible, allowing 1-night stays, especially midweek or during low season, could capture last-minute bookings, as only 15% currently do.
- Explore offering discounts for stays of 30+ nights to attract the 40% of the market seeking extended stays.
- Adjust minimum nights based on seasonality – potentially shorter during low season and longer during peak demand periods in Eastbrook.
Eastbrook Airbnb Cancellation Policy Trends Analysis (2026)
Super Strict 30 Days
2 listings
10% of total
Moderate
9 listings
45% of total
Firm
7 listings
35% of total
Strict
2 listings
10% of total
Cancellation Policy Insights for Eastbrook
- The prevailing Airbnb cancellation policy trend in Eastbrook is Moderate, used by 45% of listings.
- There's a relatively balanced mix between guest-friendly (45.0%) and stricter (45.0%) policies, offering choices for different guest needs.
Recommendations for Hosts
- Consider adopting a Moderate policy to align with the 45% market standard in Eastbrook.
- Using a Strict policy might deter some guests, as only 10% of listings use it. Evaluate if potential revenue protection outweighs possible lower booking rates.
- Regularly review your cancellation policy against competitors and market demand shifts in Eastbrook.
Eastbrook STR Booking Lead Time Analysis (2026)
Average Booking Lead Time by Month
Booking Lead Time Insights for Eastbrook
- The overall average booking lead time for vacation rentals in Eastbrook is 79 days.
- Guests book furthest in advance for stays during March (average 219 days), likely coinciding with peak travel demand or local events.
- The shortest booking windows occur for stays in December (average 18 days), indicating more last-minute travel plans during this time.
- Seasonally, Spring (155 days avg.) sees the longest lead times, while Winter (47 days avg.) has the shortest, reflecting typical travel planning cycles.
Recommendations for Hosts
- Use the overall average lead time (79 days) as a baseline for your pricing and availability strategy in Eastbrook.
- For March stays, consider implementing length-of-stay discounts or slightly higher rates for bookings made less than 219 days out to capitalize on advance planning.
- Target marketing efforts for the Spring season well in advance (at least 155 days) to capture early planners.
- Monitor your own booking lead times against these Eastbrook averages to identify opportunities for dynamic pricing adjustments.
Popular & Essential Airbnb Amenities in Eastbrook (2026)
Amenity Prevalence
Amenity Insights for Eastbrook
- Essential amenities in Eastbrook that guests expect include: Free parking on premises, Hot water. Lacking these (any) could significantly impact bookings.
- Popular amenities like Fire pit, Hair dryer, Fire extinguisher are common but not universal. Offering these can provide a competitive edge.
Recommendations for Hosts
- Ensure your listing includes all essential amenities for Eastbrook: Free parking on premises, Hot water.
- Prioritize adding missing essentials: Hot water.
- Consider adding popular differentiators like Fire pit or Hair dryer to increase appeal.
- Highlight unique or less common amenities you offer (e.g., hot tub, dedicated workspace, EV charger) in your listing description and photos.
- Regularly check competitor amenities in Eastbrook to stay competitive.
Eastbrook Airbnb Guest Demographics & Profile Analysis (2026)
Guest Profile Summary for Eastbrook
- The typical guest profile for Airbnb in Eastbrook consists of primarily domestic travelers (96%), often arriving from nearby Boston, typically belonging to the Post-2000s (Gen Z/Alpha) group (50%), primarily speaking English or Spanish.
- Domestic travelers account for 95.6% of guests.
- Key international markets include United States (95.6%) and Canada (2.2%).
- Top languages spoken are English (76.6%) followed by Spanish (7.8%).
- A significant demographic segment is the Post-2000s (Gen Z/Alpha) group, representing 50% of guests.
Recommendations for Hosts
- Target domestic marketing efforts towards travelers from Boston and New York.
- Tailor amenities and listing descriptions to appeal to the dominant Post-2000s (Gen Z/Alpha) demographic (e.g., highlight fast WiFi, smart home features, local guides).
- Highlight unique local experiences or amenities relevant to the primary guest profile.
- Consider seasonal promotions aligned with peak travel times for key origin markets.
Nearby Short-Term Rental Market Comparison
How does the Eastbrook Airbnb market stack up against its neighbors? Compare key performance metrics like average monthly revenue, ADR, and occupancy rates in surrounding areas to understand the broader regional STR landscape.
| Market | Active Properties | Monthly Revenue | Daily Rate | Avg. Occupancy |
|---|---|---|---|---|
| Bar Harbor | 510 | $5,047 | $413.86 | 58% |
| Mount Desert | 198 | $4,605 | $435.23 | 52% |
| Trenton | 141 | $4,555 | $388.61 | 57% |
| Tremont | 158 | $4,450 | $380.52 | 55% |
| Manchester | 12 | $4,389 | $406.26 | 46% |
| Southwest Harbor | 260 | $4,311 | $406.14 | 54% |
| Lamoine | 97 | $3,923 | $327.88 | 55% |
| Georgetown | 45 | $3,816 | $379.01 | 50% |
| Otis | 38 | $3,656 | $334.83 | 51% |
| Gouldsboro | 127 | $3,459 | $365.85 | 48% |