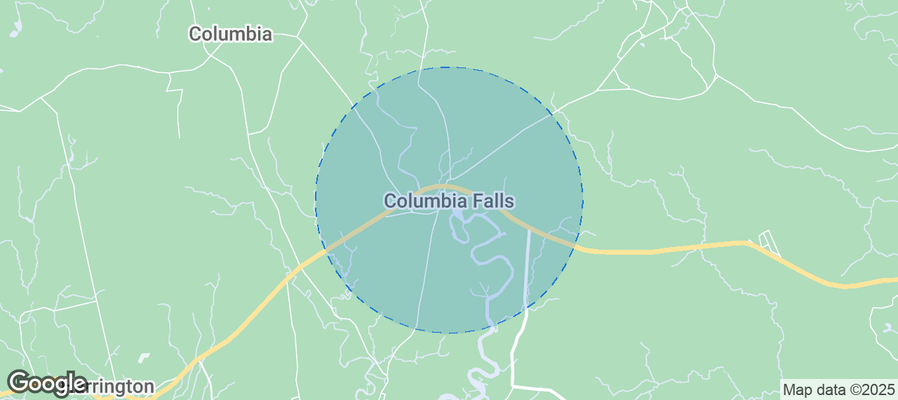
Columbia Falls Airbnb Market Analysis 2025: Short Term Rental Data & Vacation Rental Statistics in Maine, United States
Is Airbnb profitable in Columbia Falls in 2025? Explore comprehensive Airbnb analytics for Columbia Falls, Maine, United States to uncover income potential. This 2025 STR market report for Columbia Falls, based on AirROI data from November 2024 to October 2025, reveals key trends in the niche market of 18 active listings.
Whether you're considering an Airbnb investment in Columbia Falls, optimizing your existing vacation rental, or exploring rental arbitrage opportunities, understanding the Columbia Falls Airbnb data is crucial. Leveraging the low regulation environment is key to maximizing your short term rental income potential. Let's dive into the specifics.
Key Columbia Falls Airbnb Performance Metrics Overview
Monthly Airbnb Revenue Variations & Income Potential in Columbia Falls (2025)
Understanding the monthly revenue variations for Airbnb listings in Columbia Falls is key to maximizing your short term rental income potential. Seasonality significantly impacts earnings. Our analysis, based on data from the past 12 months, shows that the peak revenue month for STRs in Columbia Falls is typically September, while December often presents the lowest earnings, highlighting opportunities for strategic pricing adjustments during shoulder and low seasons. Explore the typical Airbnb income in Columbia Falls across different performance tiers:
- Best-in-class properties (Top 10%) achieve $2,141+ monthly, often utilizing dynamic pricing and superior guest experiences.
- Strong performing properties (Top 25%) earn $1,375 or more, indicating effective management and desirable locations/amenities.
- Typical properties (Median) generate around $619 per month, representing the average market performance.
- Entry-level properties (Bottom 25%) see earnings around $484, often with potential for optimization.
Average Monthly Airbnb Earnings Trend in Columbia Falls
Columbia Falls Airbnb Occupancy Rate Trends (2025)
Maximize your bookings by understanding the Columbia Falls STR occupancy trends. Seasonal demand shifts significantly influence how often properties are booked. Typically, Septembersees the highest demand (peak season occupancy), while October experiences the lowest (low season). Effective strategies, like adjusting minimum stays or offering promotions, can boost occupancy during slower periods. Here's how different property tiers perform in Columbia Falls:
- Best-in-class properties (Top 10%) achieve 25%+ occupancy, indicating high desirability and potentially optimized availability.
- Strong performing properties (Top 25%) maintain 20% or higher occupancy, suggesting good market fit and guest satisfaction.
- Typical properties (Median) have an occupancy rate around 12%.
- Entry-level properties (Bottom 25%) average 10% occupancy, potentially facing higher vacancy.
Average Monthly Occupancy Rate Trend in Columbia Falls
Average Daily Rate (ADR) Airbnb Trends in Columbia Falls (2025)
Effective short term rental pricing strategy in Columbia Falls involves understanding monthly ADR fluctuations. The Average Daily Rate (ADR) for Airbnb in Columbia Falls typically peaks in June and dips lowest during November. Leveraging Airbnb dynamic pricing tools or strategies based on this seasonality can significantly boost revenue. Here's a look at the typical nightly rates achieved:
- Best-in-class properties (Top 10%) command rates of $262+ per night, often due to premium features or locations.
- Strong performing properties (Top 25%) achieve nightly rates of $213 or more.
- Typical properties (Median) charge around $193 per night.
- Entry-level properties (Bottom 25%) earn around $136 per night.
Average Daily Rate (ADR) Trend by Month in Columbia Falls
Get Live Columbia Falls Market Intelligence 👇
Explore Real-time Analytics
Airbnb Seasonality Analysis & Trends in Columbia Falls (2025)
Peak Season (September, August, July)
- Revenue averages $1,505 per month
- Occupancy rates average 21.2%
- Daily rates average $202
Shoulder Season
- Revenue averages $430 per month
- Occupancy maintains around 7.1%
- Daily rates hold near $186
Low Season (March, April, November)
- Revenue drops to average $0 per month
- Occupancy decreases to average 0.0%
- Daily rates adjust to average $179
Seasonality Insights for Columbia Falls
- The Airbnb seasonality in Columbia Falls shows highly seasonal trends requiring careful strategy. While the sections above show seasonal averages, it's also insightful to look at the extremes:
- During the high season, the absolute peak month showcases Columbia Falls's highest earning potential, with monthly revenues capable of climbing to $1,749, occupancy reaching a high of 29.1%, and ADRs peaking at $206.
- Conversely, the slowest single month of the year, typically falling within the low season, marks the market's lowest point. In this month, revenue might dip to $0, occupancy could drop to 0.0%, and ADRs may adjust down to $172.
- Understanding both the seasonal averages and these monthly peaks and troughs in revenue, occupancy, and ADR is crucial for maximizing your Airbnb profit potential in Columbia Falls.
Seasonal Strategies for Maximizing Profit
- Peak Season: Maximize revenue through premium pricing and potentially longer minimum stays. Ensure high availability.
- Low Season: Offer competitive pricing, special promotions (e.g., extended stay discounts), and flexible cancellation policies. Target off-season travelers like remote workers or budget-conscious guests.
- Shoulder Seasons: Implement dynamic pricing that balances peak and low rates. Target weekend travelers or specific events. Offer slightly more flexible terms than peak season.
- Regularly analyze your own performance against these Columbia Falls seasonality benchmarks and adjust your pricing and availability strategy accordingly.
Best Areas for Airbnb Investment in Columbia Falls (2025)
Exploring the top neighborhoods for short-term rentals in Columbia Falls? This section highlights key areas, outlining why they are attractive for hosts and guests, along with notable local attractions. Consider these locations based on your target guest profile and investment strategy.
| Neighborhood / Area | Why Host Here? (Target Guests & Appeal) | Key Attractions & Landmarks |
|---|---|---|
| Downtown Columbia Falls | The heart of Columbia Falls, it offers easy access to local amenities and attractions. Ideal for travelers looking to explore the local culture and enjoy small-town charm. | Columbia Falls Historical Society, Shaw's Restaurant, local shops and cafes, Columbia Falls Library |
| Maine Coast | A breathtaking stretch of coastline that attracts tourists year-round. Perfect for visitors wanting to experience the beauty of Maine's nature and outdoor activities. | Acadia National Park, Bar Harbor, Baxter State Park, Cadillac Mountain, Coastal Maine Botanical Gardens |
| Mount Desert Island | Famous for its stunning landscapes and hiking opportunities, this area is popular among nature lovers. Ideal for those seeking outdoor adventures and picturesque scenery. | Acadia National Park, Jordan Pond, Sand Beach, Summit of Cadillac Mountain, Carriage Roads |
| Lakes Region | Known for its pristine lakes and recreational activities. A great spot for families and outdoor enthusiasts looking to enjoy water sports and relaxation. | Long Lake, Brandy Pond, Sebago Lake, fishing and boating opportunities, hiking trails |
| Local Vineyards | An emerging destination for wine enthusiasts, with beautiful vineyards and tasting experiences. Attracts tourists interested in local food and wine culture. | Blue Hill Wine Company, Stonehouse Vineyard, wine tastings, scenic vineyard tours |
| Local Art Scene | Columbia Falls features a small but vibrant art community, drawing visitors interested in local arts and cultural events. | art galleries, local craft fairs, art studios, artists’ open houses |
| Ski Areas | Nearby ski resorts offer winter sports and activities, making Columbia Falls a year-round destination for outdoor adventure seekers. | Bigrock Ski Area, snowmobiling, cross country skiing, winter hiking |
| Historic Sites | Rich in history, Columbia Falls has several sites of interest for those wanting to delve into the past of the region. | Columbia Falls Historic District, the old sawmill, historic homes, local museums |
Understanding Airbnb License Requirements & STR Laws in Columbia Falls (2025)
While Columbia Falls, Maine, United States currently shows low STR regulations, specific Airbnb license requirements might still exist or change. Always verify the latest short term rental regulations and Airbnb license requirements directly with local government authorities for Columbia Falls to ensure full compliance before hosting.
(Source: AirROI data, 2025, finding no licensed listings among those analyzed)
Top Performing Airbnb Properties in Columbia Falls (2025)
Benchmark your potential! Explore examples of top-performing Airbnb properties in Columbia Fallsbased on Trailing Twelve Month (TTM) revenue. Analyze their characteristics, revenue, occupancy rate, and ADR to understand what drives success in this market.
Entire home- 4 bedrooms, 2 full baths.
Entire Place • 4 bedrooms

Blueberry Bluff 2
Entire Place • 4 bedrooms
#3 - Flagpole View Cabins - Deluxe Cabin
Entire Place • 1 bedroom

#37 - Flagpole View Cabins - King Cabin
Entire Place • N/A
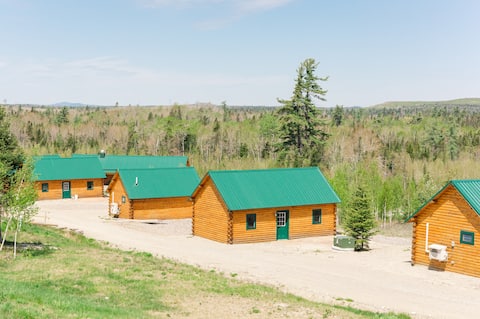
#4 - Flagpole View Cabins - Deluxe Cabin
Entire Place • 1 bedroom

#38 - Flagpole View Cabins - King Cabin
Entire Place • N/A
Note: Performance varies based on location, size, amenities, seasonality, and management quality. Data reflects the past 12 months.
Top Performing Airbnb Hosts in Columbia Falls (2025)
Learn from the best! This table showcases top-performing Airbnb hosts in Columbia Falls based on the number of properties managed and estimated total revenue over the past year. Analyze their scale and performance metrics.
| Host Name | Properties | Grossing Revenue | Stay Reviews | Avg Rating |
|---|---|---|---|---|
| Flagpole View | 14 | $40,648 | 51 | 4.62/5.0 |
| Lydie | 1 | $12,729 | 4 | 5.00/5.0 |
| John | 1 | $10,905 | 25 | 4.80/5.0 |
| Shirley | 1 | $1,392 | 90 | 4.83/5.0 |
| Scott | 1 | $143 | 12 | 4.33/5.0 |
Analyzing the strategies of top hosts, such as their property selection, pricing, and guest communication, can offer valuable lessons for optimizing your own Airbnb operations in Columbia Falls.
Dive Deeper: Advanced Columbia Falls STR Market Data (2025)
Ready to unlock more insights? AirROI provides access to advanced metrics and comprehensive Airbnb data for Columbia Falls. Explore detailed analytics beyond this report to refine your investment strategy, optimize pricing, and maximize your vacation rental profits.
Explore Advanced MetricsColumbia Falls Short-Term Rental Market Composition (2025): Property & Room Types
Room Type Distribution
Property Type Distribution
Market Composition Insights for Columbia Falls
- The Columbia Falls Airbnb market composition is heavily skewed towards Entire Home/Apt listings, which make up 94.4% of the 18 active rentals. This indicates strong guest preference for privacy and space.
- Looking at the property type distribution in Columbia Falls, Others properties are the most common (77.8%), reflecting the local real estate landscape.
- Houses represent a significant 16.7% portion, catering likely to families or larger groups.
Columbia Falls Airbnb Room Capacity Analysis (2025): Bedroom Distribution
Distribution of Listings by Number of Bedrooms
Room Capacity Insights for Columbia Falls
- The dominant room capacity in Columbia Falls is 1 bedroom listings, making up 38.9% of the market. This suggests a strong demand for properties suitable for couples or solo travelers.
- Together, 1 bedroom and 4 bedrooms properties represent 50.0% of the active Airbnb listings in Columbia Falls, indicating a high concentration in these sizes.
Columbia Falls Vacation Rental Guest Capacity Trends (2025)
Distribution of Listings by Guest Capacity
Guest Capacity Insights for Columbia Falls
- The most common guest capacity trend in Columbia Falls vacation rentals is listings accommodating 2 guests (38.9%). This suggests the primary traveler segment is likely couples or solo travelers.
- Properties designed for 2 guests and 6 guests dominate the Columbia Falls STR market, accounting for 72.2% of listings.
- 44.4% of properties accommodate 6+ guests, serving the market segment for larger families or group travel in Columbia Falls.
- On average, properties in Columbia Falls are equipped to host 4.3 guests.
Columbia Falls Airbnb Booking Patterns (2025): Available vs. Booked Days
Available Days Distribution
Booked Days Distribution
Booking Pattern Insights for Columbia Falls
- The most common availability pattern in Columbia Falls falls within the 271-366 days range, representing 100% of listings. This suggests many properties have significant open periods on their calendars.
- Approximately 100.0% of listings show high availability (181+ days open annually), indicating potential for increased bookings or specific owner usage patterns.
- For booked days, the 1-30 days range is most frequent in Columbia Falls (94.4%), reflecting common guest stay durations or potential owner blocking patterns.
Columbia Falls Airbnb Minimum Stay Requirements Analysis
Distribution of Listings by Minimum Night Requirement
1 Night
17 listings
94.4% of total
2 Nights
1 listings
5.6% of total
Key Insights
- The most prevalent minimum stay requirement in Columbia Falls is 1 Night, adopted by 94.4% of listings. This highlights the market's preference for shorter, flexible bookings.
- A strong majority (100.0%) of the Columbia Falls Airbnb data shows acceptance of very short stays (1-2 nights), indicating a dynamic, high-turnover market.
Recommendations
- Align with the market by considering a 1 Night minimum stay, as 94.4% of Columbia Falls hosts use this setting.
- Adjust minimum nights based on seasonality – potentially shorter during low season and longer during peak demand periods in Columbia Falls.
Columbia Falls Airbnb Cancellation Policy Trends Analysis (2025)
Flexible
16 listings
88.9% of total
Firm
2 listings
11.1% of total
Cancellation Policy Insights for Columbia Falls
- The prevailing Airbnb cancellation policy trend in Columbia Falls is Flexible, used by 88.9% of listings.
- The market strongly favors guest-friendly terms, with 88.9% of listings offering Flexible or Moderate policies. This suggests guests in Columbia Falls may expect booking flexibility.
Recommendations for Hosts
- Consider adopting a Flexible policy to align with the 88.9% market standard in Columbia Falls.
- Given the high prevalence of Flexible policies (88.9%), offering this can enhance booking appeal, especially during shoulder seasons.
- Regularly review your cancellation policy against competitors and market demand shifts in Columbia Falls.
Columbia Falls STR Booking Lead Time Analysis (2025)
Average Booking Lead Time by Month
Booking Lead Time Insights for Columbia Falls
- The overall average booking lead time for vacation rentals in Columbia Falls is 129 days.
- Guests book furthest in advance for stays during September (average 221 days), likely coinciding with peak travel demand or local events.
- The shortest booking windows occur for stays in November (average 0 days), indicating more last-minute travel plans during this time.
- Seasonally, Fall (95 days avg.) sees the longest lead times, while Winter (10 days avg.) has the shortest, reflecting typical travel planning cycles.
Recommendations for Hosts
- Use the overall average lead time (129 days) as a baseline for your pricing and availability strategy in Columbia Falls.
- For September stays, consider implementing length-of-stay discounts or slightly higher rates for bookings made less than 221 days out to capitalize on advance planning.
- During November, focus on last-minute booking availability and promotions, as guests book with very short notice (0 days avg.).
- Target marketing efforts for the Fall season well in advance (at least 95 days) to capture early planners.
- Monitor your own booking lead times against these Columbia Falls averages to identify opportunities for dynamic pricing adjustments.
Popular & Essential Airbnb Amenities in Columbia Falls (2025)
Amenity Prevalence
Amenity Insights for Columbia Falls
- Essential amenities in Columbia Falls that guests expect include: Fire extinguisher, Free parking on premises, Smoke alarm, Hot water. Lacking these (any) could significantly impact bookings.
- Popular amenities like Pets allowed, Essentials, Heating are common but not universal. Offering these can provide a competitive edge.
Recommendations for Hosts
- Ensure your listing includes all essential amenities for Columbia Falls: Fire extinguisher, Free parking on premises, Smoke alarm, Hot water.
- Consider adding popular differentiators like Pets allowed or Essentials to increase appeal.
- Highlight unique or less common amenities you offer (e.g., hot tub, dedicated workspace, EV charger) in your listing description and photos.
- Regularly check competitor amenities in Columbia Falls to stay competitive.
Columbia Falls Airbnb Guest Demographics & Profile Analysis (2025)
Guest Profile Summary for Columbia Falls
- The typical guest profile for Airbnb in Columbia Falls consists of primarily domestic travelers (100%), often arriving from nearby New York, typically belonging to the Post-2000s (Gen Z/Alpha) group (50%), primarily speaking English or Korean.
- Domestic travelers account for 100.0% of guests.
- Top languages spoken are English (66.7%) followed by Korean (16.7%).
- A significant demographic segment is the Post-2000s (Gen Z/Alpha) group, representing 50% of guests.
Recommendations for Hosts
- Target domestic marketing efforts towards travelers from New York and Standish.
- Tailor amenities and listing descriptions to appeal to the dominant Post-2000s (Gen Z/Alpha) demographic (e.g., highlight fast WiFi, smart home features, local guides).
- Highlight unique local experiences or amenities relevant to the primary guest profile.
- Consider seasonal promotions aligned with peak travel times for key origin markets.
Nearby Short-Term Rental Market Comparison
How does the Columbia Falls Airbnb market stack up against its neighbors? Compare key performance metrics like average monthly revenue, ADR, and occupancy rates in surrounding areas to understand the broader regional STR landscape.
| Market | Active Properties | Monthly Revenue | Daily Rate | Avg. Occupancy |
|---|---|---|---|---|
| Bar Harbor | 493 | $5,024 | $411.23 | 56% |
| Mount Desert | 180 | $4,595 | $425.19 | 50% |
| Trenton | 123 | $4,563 | $375.84 | 53% |
| Tremont | 148 | $4,496 | $380.05 | 54% |
| Southwest Harbor | 240 | $4,380 | $412.44 | 52% |
| Lamoine | 92 | $3,939 | $327.43 | 54% |
| Otis | 35 | $3,583 | $322.02 | 50% |
| Dedham | 37 | $3,370 | $388.29 | 41% |
| Machiasport | 15 | $3,349 | $227.08 | 55% |
| Gouldsboro | 127 | $3,288 | $353.10 | 45% |