China Airbnb Market Analysis 2026: Short Term Rental Data & Vacation Rental Statistics in Maine, United States
Is Airbnb profitable in China in 2026? Explore comprehensive Airbnb analytics for China, Maine, United States to uncover income potential. This 2026 STR market report for China, based on AirROI data from February 2025 to January 2026, reveals key trends in the niche market of 21 active listings.
Whether you're considering an Airbnb investment in China, optimizing your existing vacation rental, or exploring rental arbitrage opportunities, understanding the China Airbnb data is crucial. Leveraging the low regulation environment is key to maximizing your short term rental income potential. Let's dive into the specifics.
Key China Airbnb Performance Metrics Overview
Monthly Airbnb Revenue Variations & Income Potential in China (2026)
Understanding the monthly revenue variations for Airbnb listings in China is key to maximizing your short term rental income potential. Seasonality significantly impacts earnings. Our analysis, based on data from the past 12 months, shows that the peak revenue month for STRs in China is typically July, while March often presents the lowest earnings, highlighting opportunities for strategic pricing adjustments during shoulder and low seasons. Explore the typical Airbnb income in China across different performance tiers:
- Best-in-class properties (Top 10%) achieve $5,316+ monthly, often utilizing dynamic pricing and superior guest experiences.
- Strong performing properties (Top 25%) earn $4,066 or more, indicating effective management and desirable locations/amenities.
- Typical properties (Median) generate around $2,380 per month, representing the average market performance.
- Entry-level properties (Bottom 25%) see earnings around $1,713, often with potential for optimization.
Average Monthly Airbnb Earnings Trend in China
China Airbnb Occupancy Rate Trends (2026)
Maximize your bookings by understanding the China STR occupancy trends. Seasonal demand shifts significantly influence how often properties are booked. Typically, Aprilsees the highest demand (peak season occupancy), while March experiences the lowest (low season). Effective strategies, like adjusting minimum stays or offering promotions, can boost occupancy during slower periods. Here's how different property tiers perform in China:
- Best-in-class properties (Top 10%) achieve 69%+ occupancy, indicating high desirability and potentially optimized availability.
- Strong performing properties (Top 25%) maintain 55% or higher occupancy, suggesting good market fit and guest satisfaction.
- Typical properties (Median) have an occupancy rate around 30%.
- Entry-level properties (Bottom 25%) average 21% occupancy, potentially facing higher vacancy.
Average Monthly Occupancy Rate Trend in China
Average Daily Rate (ADR) Airbnb Trends in China (2026)
Effective short term rental pricing strategy in China involves understanding monthly ADR fluctuations. The Average Daily Rate (ADR) for Airbnb in China typically peaks in June and dips lowest during October. Leveraging Airbnb dynamic pricing tools or strategies based on this seasonality can significantly boost revenue. Here's a look at the typical nightly rates achieved:
- Best-in-class properties (Top 10%) command rates of $346+ per night, often due to premium features or locations.
- Strong performing properties (Top 25%) achieve nightly rates of $293 or more.
- Typical properties (Median) charge around $210 per night.
- Entry-level properties (Bottom 25%) earn around $150 per night.
Average Daily Rate (ADR) Trend by Month in China
Get Live China Market Intelligence 👇

Explore Real-time Analytics
Airbnb Seasonality Analysis & Trends in China (2026)
Peak Season (July, August, February)
- Revenue averages $4,104 per month
- Occupancy rates average 54.3%
- Daily rates average $247
Shoulder Season
- Revenue averages $2,779 per month
- Occupancy maintains around 40.3%
- Daily rates hold near $232
Low Season (January, March, November)
- Revenue drops to average $1,986 per month
- Occupancy decreases to average 22.5%
- Daily rates adjust to average $222
Seasonality Insights for China
- The Airbnb seasonality in China shows highly seasonal trends requiring careful strategy. While the sections above show seasonal averages, it's also insightful to look at the extremes:
- During the high season, the absolute peak month showcases China's highest earning potential, with monthly revenues capable of climbing to $4,326, occupancy reaching a high of 59.2%, and ADRs peaking at $257.
- Conversely, the slowest single month of the year, typically falling within the low season, marks the market's lowest point. In this month, revenue might dip to $1,776, occupancy could drop to 6.5%, and ADRs may adjust down to $216.
- Understanding both the seasonal averages and these monthly peaks and troughs in revenue, occupancy, and ADR is crucial for maximizing your Airbnb profit potential in China.
Seasonal Strategies for Maximizing Profit
- Peak Season: Maximize revenue through premium pricing and potentially longer minimum stays. Ensure high availability.
- Low Season: Offer competitive pricing, special promotions (e.g., extended stay discounts), and flexible cancellation policies. Target off-season travelers like remote workers or budget-conscious guests.
- Shoulder Seasons: Implement dynamic pricing that balances peak and low rates. Target weekend travelers or specific events. Offer slightly more flexible terms than peak season.
- Regularly analyze your own performance against these China seasonality benchmarks and adjust your pricing and availability strategy accordingly.
Best Areas for Airbnb Investment in China (2026)
Exploring the top neighborhoods for short-term rentals in China? This section highlights key areas, outlining why they are attractive for hosts and guests, along with notable local attractions. Consider these locations based on your target guest profile and investment strategy.
| Neighborhood / Area | Why Host Here? (Target Guests & Appeal) | Key Attractions & Landmarks |
|---|---|---|
| China Lake | A popular spot for fishing, boating, and summer recreation. The lake attracts tourists looking for water activities and scenic views, making it an ideal location for vacation rentals. | China Lake, China Salt Water Farm, Benson's Restaurant, Leroy's Place, Kennebec River |
| China Village | A charming small village with a quaint atmosphere, perfect for families and couples looking for a peaceful getaway. It offers local shops and a sense of community. | China Lake, Local stores and cafes, Community events, Historical sites |
| Waterville | Nearby city with a vibrant arts scene and college town atmosphere. Hosts events and activities that draw visitors year-round, providing a steady stream of potential guests. | Colby College Museum of Art, Waterville Opera House, Rail Trail, Lake Messalonskee, Downtown Waterville |
| Augusta | The capital city of Maine, offering rich history, governmental attractions, and recreational activities. Attracts both business and leisure travelers. | Maine State House, Vaughan Woods and Historic Homestead, Old Fort Western, Capitol Park, Savage Oakes Vineyard |
| Belgrade Lakes | Known for its stunning natural beauty and outdoor activities, attracting nature lovers and those seeking recreational opportunities. A great area for summer rentals. | Belgrade Lakes, Lakeview Golf Course, Belgrade Regional Conservation Alliance, Outdoor activities, Scenic hiking trails |
| Mount Vernon | A small, scenic town with beautiful landscapes and access to recreational activities such as hiking and boating. Ideal for those looking to escape the hustle and bustle. | Mount Vernon Village, Nearby lakes and trails, Quarry Road Trails, Nature preserves |
| Farmingdale | A small town that offers a quiet rural experience while being close to the city amenities of Augusta. Attracts visitors looking for a peaceful stay with convenience. | Local parks, Kennebec River, Historical sites, Community events |
| Hallowell | A historic town with a vibrant arts scene, antique shops, and scenic river views. Attracts tourists interested in culture, history, and shopping. | Hallowell Railroad Station, Local galleries and shops, Kennebec River, Community arts events |
Understanding Airbnb License Requirements & STR Laws in China (2026)
While China, Maine, United States currently shows low STR regulations, specific Airbnb license requirements might still exist or change. Always verify the latest short term rental regulations and Airbnb license requirements directly with local government authorities for China to ensure full compliance before hosting.
(Source: AirROI data, 2026, finding no licensed listings among those analyzed)
Top Performing Airbnb Properties in China (2026)
Benchmark your potential! Explore examples of top-performing Airbnb properties in Chinabased on Trailing Twelve Month (TTM) revenue. Analyze their characteristics, revenue, occupancy rate, and ADR to understand what drives success in this market.
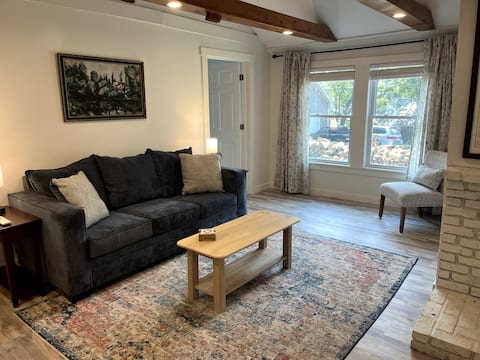
Hillside Cabin
Entire Place • 2 bedrooms

Loon Lodge On China Lake
Entire Place • 4 bedrooms

Rustic Family Cabin on China Lake
Entire Place • 4 bedrooms
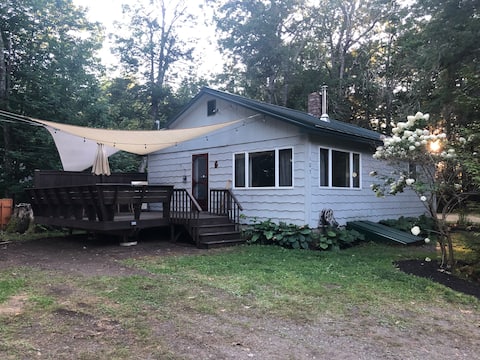
Private Cabin on Beautiful China Lake
Entire Place • 4 bedrooms

Beautiful, Private, Lakefront Home
Entire Place • 2 bedrooms

Charming Private camp on China Lake
Entire Place • 2 bedrooms
Note: Performance varies based on location, size, amenities, seasonality, and management quality. Data reflects the past 12 months.
Top Performing Airbnb Hosts in China (2026)
Learn from the best! This table showcases top-performing Airbnb hosts in China based on the number of properties managed and estimated total revenue over the past year. Analyze their scale and performance metrics.
| Host Name | Properties | Grossing Revenue | Stay Reviews | Avg Rating |
|---|---|---|---|---|
| Michelle | 2 | $57,665 | 69 | 5.00/5.0 |
| Kimberly | 1 | $35,962 | 22 | 4.95/5.0 |
| Laurette | 1 | $35,203 | 58 | 5.00/5.0 |
| Jessica G | 1 | $33,851 | 185 | 4.89/5.0 |
| Natasha | 3 | $28,370 | 24 | 4.94/5.0 |
| Michael | 1 | $26,609 | 77 | 4.91/5.0 |
| Linda | 1 | $25,484 | 5 | 4.80/5.0 |
| Mark | 2 | $23,189 | 165 | 4.97/5.0 |
| Katie | 1 | $21,327 | 82 | 4.66/5.0 |
| Ashley | 1 | $19,591 | 59 | 4.86/5.0 |
Analyzing the strategies of top hosts, such as their property selection, pricing, and guest communication, can offer valuable lessons for optimizing your own Airbnb operations in China.
Dive Deeper: Advanced China STR Market Data (2026)
Ready to unlock more insights? AirROI provides access to advanced metrics and comprehensive Airbnb data for China. Explore detailed analytics beyond this report to refine your investment strategy, optimize pricing, and maximize your vacation rental profits.
Explore Advanced MetricsChina Short-Term Rental Market Composition (2026): Property & Room Types
Room Type Distribution
Property Type Distribution
Market Composition Insights for China
- The China Airbnb market composition is heavily skewed towards Entire Home/Apt listings, which make up 95.2% of the 21 active rentals. This indicates strong guest preference for privacy and space.
- Looking at the property type distribution in China, House properties are the most common (76.2%), reflecting the local real estate landscape.
- Houses represent a significant 76.2% portion, catering likely to families or larger groups.
- Smaller segments like hotel/boutique, apartment/condo (combined 9.6%) offer potential for unique stay experiences.
China Airbnb Room Capacity Analysis (2026): Bedroom Distribution
Distribution of Listings by Number of Bedrooms
Room Capacity Insights for China
- The dominant room capacity in China is 2 bedrooms listings, making up 38.1% of the market. This suggests a strong demand for properties suitable for couples or solo travelers.
- Together, 2 bedrooms and 3 bedrooms properties represent 71.4% of the active Airbnb listings in China, indicating a high concentration in these sizes.
- A significant 47.6% of listings offer 3+ bedrooms, catering to larger groups and families seeking more space in China.
China Vacation Rental Guest Capacity Trends (2026)
Distribution of Listings by Guest Capacity
Guest Capacity Insights for China
- The most common guest capacity trend in China vacation rentals is listings accommodating 8+ guests (28.6%). This suggests the primary traveler segment is likely larger groups.
- Properties designed for 8+ guests and 4 guests dominate the China STR market, accounting for 57.2% of listings.
- 57.2% of properties accommodate 6+ guests, serving the market segment for larger families or group travel in China.
- On average, properties in China are equipped to host 5.5 guests.
China Airbnb Booking Patterns (2026): Available vs. Booked Days
Available Days Distribution
Booked Days Distribution
Booking Pattern Insights for China
- The most common availability pattern in China falls within the 271-366 days range, representing 71.4% of listings. This suggests many properties have significant open periods on their calendars.
- Approximately 90.4% of listings show high availability (181+ days open annually), indicating potential for increased bookings or specific owner usage patterns.
- For booked days, the 31-90 days range is most frequent in China (52.4%), reflecting common guest stay durations or potential owner blocking patterns.
- A notable 9.5% of properties secure long booking periods (181+ days booked per year), highlighting successful long-term rental strategies or significant owner usage.
China Airbnb Minimum Stay Requirements Analysis
Distribution of Listings by Minimum Night Requirement
1 Night
3 listings
14.3% of total
2 Nights
1 listings
4.8% of total
3 Nights
1 listings
4.8% of total
4-6 Nights
5 listings
23.8% of total
7-29 Nights
3 listings
14.3% of total
30+ Nights
8 listings
38.1% of total
Key Insights
- The most prevalent minimum stay requirement in China is 30+ Nights, adopted by 38.1% of listings. This highlights the market's preference for longer commitments.
- Very short stays (1-2 nights) are less common (19.1%), suggesting hosts prefer slightly longer bookings to optimize turnover.
- A significant segment (38.1%) caters to monthly stays (30+ nights) in China, pointing to opportunities in the extended-stay market.
Recommendations
- Align with the market by considering a 30+ Nights minimum stay, as 38.1% of China hosts use this setting.
- If feasible, allowing 1-night stays, especially midweek or during low season, could capture last-minute bookings, as only 14.3% currently do.
- Explore offering discounts for stays of 30+ nights to attract the 38.1% of the market seeking extended stays.
- Adjust minimum nights based on seasonality – potentially shorter during low season and longer during peak demand periods in China.
China Airbnb Cancellation Policy Trends Analysis (2026)
Flexible
5 listings
23.8% of total
Moderate
5 listings
23.8% of total
Firm
8 listings
38.1% of total
Strict
3 listings
14.3% of total
Cancellation Policy Insights for China
- The prevailing Airbnb cancellation policy trend in China is Firm, used by 38.1% of listings.
- A majority (52.4%) of hosts in China utilize Firm or Strict policies, indicating a market where hosts prioritize booking security.
Recommendations for Hosts
- Consider adopting a Firm policy to align with the 38.1% market standard in China.
- Using a Strict policy might deter some guests, as only 14.3% of listings use it. Evaluate if potential revenue protection outweighs possible lower booking rates.
- Regularly review your cancellation policy against competitors and market demand shifts in China.
China STR Booking Lead Time Analysis (2026)
Average Booking Lead Time by Month
Booking Lead Time Insights for China
- The overall average booking lead time for vacation rentals in China is 99 days.
- Guests book furthest in advance for stays during May (average 147 days), likely coinciding with peak travel demand or local events.
- The shortest booking windows occur for stays in November (average 9 days), indicating more last-minute travel plans during this time.
- Seasonally, Spring (126 days avg.) sees the longest lead times, while Winter (40 days avg.) has the shortest, reflecting typical travel planning cycles.
Recommendations for Hosts
- Use the overall average lead time (99 days) as a baseline for your pricing and availability strategy in China.
- For May stays, consider implementing length-of-stay discounts or slightly higher rates for bookings made less than 147 days out to capitalize on advance planning.
- During November, focus on last-minute booking availability and promotions, as guests book with very short notice (9 days avg.).
- Target marketing efforts for the Spring season well in advance (at least 126 days) to capture early planners.
- Monitor your own booking lead times against these China averages to identify opportunities for dynamic pricing adjustments.
Popular & Essential Airbnb Amenities in China (2026)
Amenity Prevalence
Amenity Insights for China
- Essential amenities in China that guests expect include: Free parking on premises, Kitchen. Lacking these (any) could significantly impact bookings.
- Popular amenities like Wifi, Hot water, Smoke alarm are common but not universal. Offering these can provide a competitive edge.
- Warning: Wifi is not universally provided but is considered essential globally. Ensure reliable Wifi is offered.
Recommendations for Hosts
- Ensure your listing includes all essential amenities for China: Free parking on premises, Kitchen.
- Prioritize adding missing essentials: Kitchen.
- Consider adding popular differentiators like Wifi or Hot water to increase appeal.
- Highlight unique or less common amenities you offer (e.g., hot tub, dedicated workspace, EV charger) in your listing description and photos.
- Regularly check competitor amenities in China to stay competitive.
China Airbnb Guest Demographics & Profile Analysis (2026)
Guest Profile Summary for China
- The typical guest profile for Airbnb in China consists of primarily domestic travelers (100%), often arriving from nearby New York, typically belonging to the Post-2000s (Gen Z/Alpha) group (50%), primarily speaking English or French.
- Domestic travelers account for 100.0% of guests.
- Top languages spoken are English (82.6%) followed by French (8.7%).
- A significant demographic segment is the Post-2000s (Gen Z/Alpha) group, representing 50% of guests.
Recommendations for Hosts
- Target domestic marketing efforts towards travelers from New York and Levittown.
- Tailor amenities and listing descriptions to appeal to the dominant Post-2000s (Gen Z/Alpha) demographic (e.g., highlight fast WiFi, smart home features, local guides).
- Highlight unique local experiences or amenities relevant to the primary guest profile.
- Consider seasonal promotions aligned with peak travel times for key origin markets.
Nearby Short-Term Rental Market Comparison
How does the China Airbnb market stack up against its neighbors? Compare key performance metrics like average monthly revenue, ADR, and occupancy rates in surrounding areas to understand the broader regional STR landscape.
| Market | Active Properties | Monthly Revenue | Daily Rate | Avg. Occupancy |
|---|---|---|---|---|
| South Berwick | 12 | $5,351 | $228.88 | 58% |
| Kennebunkport | 152 | $5,309 | $669.87 | 43% |
| Bar Harbor | 510 | $5,047 | $413.86 | 58% |
| Kennebunk | 228 | $4,794 | $523.86 | 45% |
| Falmouth | 63 | $4,691 | $450.26 | 51% |
| Mount Desert | 198 | $4,605 | $435.23 | 52% |
| Trenton | 141 | $4,555 | $388.61 | 57% |
| Tremont | 158 | $4,450 | $380.52 | 55% |
| Manchester | 12 | $4,389 | $406.26 | 46% |
| Sanford | 25 | $4,331 | $328.21 | 47% |