Pāhoa Airbnb Market Analysis 2026: Short Term Rental Data & Vacation Rental Statistics in Hawaii, United States
Is Airbnb profitable in Pāhoa in 2026? Explore comprehensive Airbnb analytics for Pāhoa, Hawaii, United States to uncover income potential. This 2026 STR market report for Pāhoa, based on AirROI data from February 2025 to January 2026, reveals key trends in the market of 292 active listings.
Whether you're considering an Airbnb investment in Pāhoa, optimizing your existing vacation rental, or exploring rental arbitrage opportunities, understanding the Pāhoa Airbnb data is crucial. Navigating the high regulation landscape is key to maximizing your short term rental income potential. Let's dive into the specifics.
Key Pāhoa Airbnb Performance Metrics Overview
Monthly Airbnb Revenue Variations & Income Potential in Pāhoa (2026)
Understanding the monthly revenue variations for Airbnb listings in Pāhoa is key to maximizing your short term rental income potential. Seasonality significantly impacts earnings. Our analysis, based on data from the past 12 months, shows that the peak revenue month for STRs in Pāhoa is typically December, while September often presents the lowest earnings, highlighting opportunities for strategic pricing adjustments during shoulder and low seasons. Explore the typical Airbnb income in Pāhoa across different performance tiers:
- Best-in-class properties (Top 10%) achieve $6,117+ monthly, often utilizing dynamic pricing and superior guest experiences.
- Strong performing properties (Top 25%) earn $3,567 or more, indicating effective management and desirable locations/amenities.
- Typical properties (Median) generate around $1,970 per month, representing the average market performance.
- Entry-level properties (Bottom 25%) see earnings around $979, often with potential for optimization.
Average Monthly Airbnb Earnings Trend in Pāhoa
Pāhoa Airbnb Occupancy Rate Trends (2026)
Maximize your bookings by understanding the Pāhoa STR occupancy trends. Seasonal demand shifts significantly influence how often properties are booked. Typically, Februarysees the highest demand (peak season occupancy), while June experiences the lowest (low season). Effective strategies, like adjusting minimum stays or offering promotions, can boost occupancy during slower periods. Here's how different property tiers perform in Pāhoa:
- Best-in-class properties (Top 10%) achieve 87%+ occupancy, indicating high desirability and potentially optimized availability.
- Strong performing properties (Top 25%) maintain 73% or higher occupancy, suggesting good market fit and guest satisfaction.
- Typical properties (Median) have an occupancy rate around 51%.
- Entry-level properties (Bottom 25%) average 27% occupancy, potentially facing higher vacancy.
Average Monthly Occupancy Rate Trend in Pāhoa
Average Daily Rate (ADR) Airbnb Trends in Pāhoa (2026)
Effective short term rental pricing strategy in Pāhoa involves understanding monthly ADR fluctuations. The Average Daily Rate (ADR) for Airbnb in Pāhoa typically peaks in December and dips lowest during April. Leveraging Airbnb dynamic pricing tools or strategies based on this seasonality can significantly boost revenue. Here's a look at the typical nightly rates achieved:
- Best-in-class properties (Top 10%) command rates of $315+ per night, often due to premium features or locations.
- Strong performing properties (Top 25%) achieve nightly rates of $181 or more.
- Typical properties (Median) charge around $125 per night.
- Entry-level properties (Bottom 25%) earn around $91 per night.
Average Daily Rate (ADR) Trend by Month in Pāhoa
Get Live Pāhoa Market Intelligence 👇

Explore Real-time Analytics
Airbnb Seasonality Analysis & Trends in Pāhoa (2026)
Peak Season (December, February, July)
- Revenue averages $3,190 per month
- Occupancy rates average 53.4%
- Daily rates average $171
Shoulder Season
- Revenue averages $2,898 per month
- Occupancy maintains around 49.4%
- Daily rates hold near $171
Low Season (April, June, September)
- Revenue drops to average $2,707 per month
- Occupancy decreases to average 47.6%
- Daily rates adjust to average $167
Seasonality Insights for Pāhoa
- The Airbnb seasonality in Pāhoa shows relatively stable year-round demand. While the sections above show seasonal averages, it's also insightful to look at the extremes:
- During the high season, the absolute peak month showcases Pāhoa's highest earning potential, with monthly revenues capable of climbing to $3,287, occupancy reaching a high of 60.5%, and ADRs peaking at $184.
- Conversely, the slowest single month of the year, typically falling within the low season, marks the market's lowest point. In this month, revenue might dip to $2,637, occupancy could drop to 44.1%, and ADRs may adjust down to $158.
- Understanding both the seasonal averages and these monthly peaks and troughs in revenue, occupancy, and ADR is crucial for maximizing your Airbnb profit potential in Pāhoa.
Seasonal Strategies for Maximizing Profit
- Peak Season: Maximize revenue through premium pricing and potentially longer minimum stays. Ensure high availability.
- Low Season: Offer competitive pricing, special promotions (e.g., extended stay discounts), and flexible cancellation policies. Target off-season travelers like remote workers or budget-conscious guests.
- Shoulder Seasons: Implement dynamic pricing that balances peak and low rates. Target weekend travelers or specific events. Offer slightly more flexible terms than peak season.
- Regularly analyze your own performance against these Pāhoa seasonality benchmarks and adjust your pricing and availability strategy accordingly.
Best Areas for Airbnb Investment in Pāhoa (2026)
Exploring the top neighborhoods for short-term rentals in Pāhoa? This section highlights key areas, outlining why they are attractive for hosts and guests, along with notable local attractions. Consider these locations based on your target guest profile and investment strategy.
| Neighborhood / Area | Why Host Here? (Target Guests & Appeal) | Key Attractions & Landmarks |
|---|---|---|
| Pāhoa Town | A vibrant town with local charm, Pāhoa offers access to various dining options, shops, and the nearby scenic coastline, making it appealing for visitors looking to experience local culture. | Pāhoa Village Museum, Kehena Black Sand Beach, Apau Beach, Turtle Lava Tube, Rainbow Falls |
| Kaimu Beach | Known for its unique volcanic black sand beach, Kaimu Beach attracts visitors seeking natural beauty and outdoor activities, including swimming and sunbathing. | Kaimu Black Sand Beach, Pele's Chair, Kalapana Caves |
| Hilo | The largest town on the Big Island, Hilo is rich in history and culture, with beautiful botanical gardens and waterfalls, making it a great spot for tourists. | Liliuokalani Gardens, Rainbow Falls, Hilo Farmers Market, Imiloa Astronomy Center, The Pacific Tsunami Museum |
| Lava Tree State Park | A unique natural attraction featuring lava formations and walking trails, great for nature enthusiasts and those interested in Hawaiian geology and history. | Lava Tree State Park, Historic Lava Flow Sites, Hiking Trails |
| Ahalanui Beach Park | A geothermal warm pond beach park that is popular for relaxing and swimming, offering a tranquil environment for visitors. | Ahalanui Warm Pond, Pāhoa's beaches |
| Punalu'u Black Sand Beach | Famous for its black sand and Hawaiian green sea turtles, Punalu'u is a stunning beach destination attracting nature lovers and beachgoers. | Punalu'u Black Sand Beach, Turtle Observations, Hiking Trails |
| Kalapana | An area with a unique volcanic history, Kalapana is close to lava flow viewing areas and offers a deep connection to Hawaiian culture. | Kalapana Black Sand Beach, Lava Viewing Sites, Cultural Hawaiian Events |
| Papakōlea Green Sand Beach | One of the few green sand beaches in the world, Papakōlea offers a distinct beach experience and draws adventurous travelers looking to explore rare natural landscapes. | Papakōlea Beach, Hiking Trails to the Beach, Unique Geological Features |
Understanding Airbnb License Requirements & STR Laws in Pāhoa (2026)
Yes, Pāhoa, Hawaii, United States enforces high STR regulations. Obtaining a license and ensuring compliance is almost certainly required according to current 2026 STR laws. Always verify the latest short term rental regulations and Airbnb license requirements directly with local government authorities for Pāhoa to ensure full compliance before hosting.
(Source: AirROI data, 2026, based on 42% licensed listings)
Top Performing Airbnb Properties in Pāhoa (2026)
Benchmark your potential! Explore examples of top-performing Airbnb properties in Pāhoabased on Trailing Twelve Month (TTM) revenue. Analyze their characteristics, revenue, occupancy rate, and ADR to understand what drives success in this market.
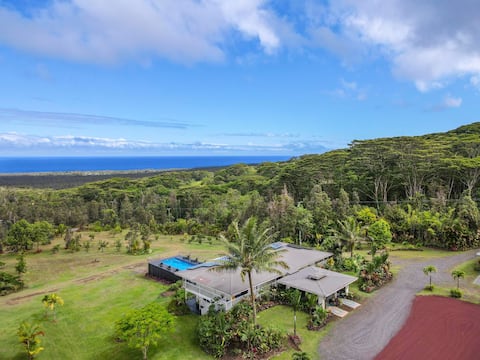
Private Oceanview Retreat, Gardens, Orchards, pool
Entire Place • 5 bedrooms
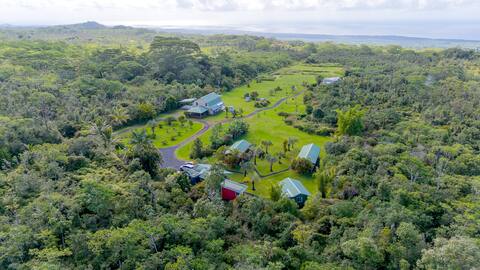
Puna Rainforest Hotspring Estate
Entire Place • 10 bedrooms
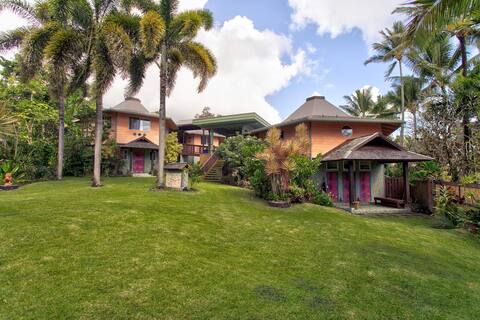
Balinese Beach House With Pool
Entire Place • 5 bedrooms

Puna Rainforest Retreat Hotspring
Entire Place • 4 bedrooms

Kehena Beach Loft
Entire Place • 1 bedroom

World Class Vacation Home
Entire Place • 3 bedrooms
Note: Performance varies based on location, size, amenities, seasonality, and management quality. Data reflects the past 12 months.
Top Performing Airbnb Hosts in Pāhoa (2026)
Learn from the best! This table showcases top-performing Airbnb hosts in Pāhoa based on the number of properties managed and estimated total revenue over the past year. Analyze their scale and performance metrics.
| Host Name | Properties | Grossing Revenue | Stay Reviews | Avg Rating |
|---|---|---|---|---|
| Jacklynn | 6 | $492,159 | 2138 | 4.93/5.0 |
| Sammy | 1 | $287,659 | 98 | 4.99/5.0 |
| Greg | 2 | $259,928 | 215 | 4.99/5.0 |
| Andre Robin | 5 | $196,288 | 1601 | 4.76/5.0 |
| Jade | 5 | $191,993 | 2446 | 4.87/5.0 |
| Jenn & Kristian | 2 | $170,992 | 158 | 4.91/5.0 |
| Caleb | 1 | $167,780 | 60 | 4.92/5.0 |
| Terry | 2 | $163,561 | 64 | 4.96/5.0 |
| Jacob Paul | 5 | $157,702 | 448 | 4.90/5.0 |
| Iliahi | 2 | $136,888 | 310 | 4.85/5.0 |
Analyzing the strategies of top hosts, such as their property selection, pricing, and guest communication, can offer valuable lessons for optimizing your own Airbnb operations in Pāhoa.
Dive Deeper: Advanced Pāhoa STR Market Data (2026)
Ready to unlock more insights? AirROI provides access to advanced metrics and comprehensive Airbnb data for Pāhoa. Explore detailed analytics beyond this report to refine your investment strategy, optimize pricing, and maximize your vacation rental profits.
Explore Advanced MetricsPāhoa Short-Term Rental Market Composition (2026): Property & Room Types
Room Type Distribution
Property Type Distribution
Market Composition Insights for Pāhoa
- The Pāhoa Airbnb market composition is heavily skewed towards Entire Home/Apt listings, which make up 87.3% of the 292 active rentals. This indicates strong guest preference for privacy and space.
- Looking at the property type distribution in Pāhoa, House properties are the most common (53.8%), reflecting the local real estate landscape.
- Houses represent a significant 53.8% portion, catering likely to families or larger groups.
- The presence of 15.1% Hotel/Boutique listings indicates integration with traditional hospitality.
- Smaller segments like unique stays (combined 0.7%) offer potential for unique stay experiences.
Pāhoa Airbnb Room Capacity Analysis (2026): Bedroom Distribution
Distribution of Listings by Number of Bedrooms
Room Capacity Insights for Pāhoa
- The dominant room capacity in Pāhoa is 1 bedroom listings, making up 48.3% of the market. This suggests a strong demand for properties suitable for couples or solo travelers.
- Together, 1 bedroom and 2 bedrooms properties represent 70.6% of the active Airbnb listings in Pāhoa, indicating a high concentration in these sizes.
Pāhoa Vacation Rental Guest Capacity Trends (2026)
Distribution of Listings by Guest Capacity
Guest Capacity Insights for Pāhoa
- The most common guest capacity trend in Pāhoa vacation rentals is listings accommodating 2 guests (31.2%). This suggests the primary traveler segment is likely couples or solo travelers.
- Properties designed for 2 guests and 4 guests dominate the Pāhoa STR market, accounting for 47.6% of listings.
- 23.7% of properties accommodate 6+ guests, serving the market segment for larger families or group travel in Pāhoa.
- On average, properties in Pāhoa are equipped to host 3.5 guests.
Pāhoa Airbnb Booking Patterns (2026): Available vs. Booked Days
Available Days Distribution
Booked Days Distribution
Booking Pattern Insights for Pāhoa
- The most common availability pattern in Pāhoa falls within the 271-366 days range, representing 40.4% of listings. This suggests many properties have significant open periods on their calendars.
- Approximately 65.7% of listings show high availability (181+ days open annually), indicating potential for increased bookings or specific owner usage patterns.
- For booked days, the 91-180 days range is most frequent in Pāhoa (27.1%), reflecting common guest stay durations or potential owner blocking patterns.
- A notable 35.0% of properties secure long booking periods (181+ days booked per year), highlighting successful long-term rental strategies or significant owner usage.
Pāhoa Airbnb Minimum Stay Requirements Analysis
Distribution of Listings by Minimum Night Requirement
1 Night
98 listings
33.6% of total
2 Nights
72 listings
24.7% of total
3 Nights
29 listings
9.9% of total
4-6 Nights
8 listings
2.7% of total
7-29 Nights
8 listings
2.7% of total
30+ Nights
77 listings
26.4% of total
Key Insights
- The most prevalent minimum stay requirement in Pāhoa is 1 Night, adopted by 33.6% of listings. This highlights the market's preference for shorter, flexible bookings.
- A significant segment (26.4%) caters to monthly stays (30+ nights) in Pāhoa, pointing to opportunities in the extended-stay market.
Recommendations
- Align with the market by considering a 1 Night minimum stay, as 33.6% of Pāhoa hosts use this setting.
- Explore offering discounts for stays of 30+ nights to attract the 26.4% of the market seeking extended stays.
- Adjust minimum nights based on seasonality – potentially shorter during low season and longer during peak demand periods in Pāhoa.
Pāhoa Airbnb Cancellation Policy Trends Analysis (2026)
Super Strict 30 Days
3 listings
1% of total
Limited
8 listings
2.7% of total
Flexible
32 listings
11% of total
Moderate
86 listings
29.5% of total
Firm
132 listings
45.2% of total
Strict
31 listings
10.6% of total
Cancellation Policy Insights for Pāhoa
- The prevailing Airbnb cancellation policy trend in Pāhoa is Firm, used by 45.2% of listings.
- A majority (55.8%) of hosts in Pāhoa utilize Firm or Strict policies, indicating a market where hosts prioritize booking security.
Recommendations for Hosts
- Consider adopting a Firm policy to align with the 45.2% market standard in Pāhoa.
- Using a Strict policy might deter some guests, as only 10.6% of listings use it. Evaluate if potential revenue protection outweighs possible lower booking rates.
- Regularly review your cancellation policy against competitors and market demand shifts in Pāhoa.
Pāhoa STR Booking Lead Time Analysis (2026)
Average Booking Lead Time by Month
Booking Lead Time Insights for Pāhoa
- The overall average booking lead time for vacation rentals in Pāhoa is 57 days.
- Guests book furthest in advance for stays during January (average 67 days), likely coinciding with peak travel demand or local events.
- The shortest booking windows occur for stays in June (average 48 days), indicating more last-minute travel plans during this time.
- Seasonally, Winter (63 days avg.) sees the longest lead times, while Summer (52 days avg.) has the shortest, reflecting typical travel planning cycles.
Recommendations for Hosts
- Use the overall average lead time (57 days) as a baseline for your pricing and availability strategy in Pāhoa.
- Target marketing efforts for the Winter season well in advance (at least 63 days) to capture early planners.
- Monitor your own booking lead times against these Pāhoa averages to identify opportunities for dynamic pricing adjustments.
Popular & Essential Airbnb Amenities in Pāhoa (2026)
Amenity Prevalence
Amenity Insights for Pāhoa
- Essential amenities in Pāhoa that guests expect include: Free parking on premises. Lacking these (this) could significantly impact bookings.
- Popular amenities like Wifi, Hot water, Dishes and silverware are common but not universal. Offering these can provide a competitive edge.
- Warning: Wifi is not universally provided but is considered essential globally. Ensure reliable Wifi is offered.
Recommendations for Hosts
- Ensure your listing includes all essential amenities for Pāhoa: Free parking on premises.
- Prioritize adding missing essentials: Free parking on premises.
- Consider adding popular differentiators like Wifi or Hot water to increase appeal.
- Highlight unique or less common amenities you offer (e.g., hot tub, dedicated workspace, EV charger) in your listing description and photos.
- Regularly check competitor amenities in Pāhoa to stay competitive.
Pāhoa Airbnb Guest Demographics & Profile Analysis (2026)
Guest Profile Summary for Pāhoa
- The typical guest profile for Airbnb in Pāhoa consists of primarily domestic travelers (85%), often arriving from nearby Los Angeles, typically belonging to the Post-2000s (Gen Z/Alpha) group (50%), primarily speaking English or Spanish.
- Domestic travelers account for 84.8% of guests.
- Key international markets include United States (84.8%) and Canada (3.9%).
- Top languages spoken are English (59.1%) followed by Spanish (11.2%).
- A significant demographic segment is the Post-2000s (Gen Z/Alpha) group, representing 50% of guests.
Recommendations for Hosts
- Target domestic marketing efforts towards travelers from Los Angeles and Honolulu.
- Tailor amenities and listing descriptions to appeal to the dominant Post-2000s (Gen Z/Alpha) demographic (e.g., highlight fast WiFi, smart home features, local guides).
- Highlight unique local experiences or amenities relevant to the primary guest profile.
- Consider seasonal promotions aligned with peak travel times for key origin markets.
Nearby Short-Term Rental Market Comparison
How does the Pāhoa Airbnb market stack up against its neighbors? Compare key performance metrics like average monthly revenue, ADR, and occupancy rates in surrounding areas to understand the broader regional STR landscape.
| Market | Active Properties | Monthly Revenue | Daily Rate | Avg. Occupancy |
|---|---|---|---|---|
| Waimea | 416 | $8,098 | $819.38 | 43% |
| Puakō | 62 | $7,820 | $874.88 | 44% |
| Hana | 68 | $7,791 | $413.38 | 65% |
| Honalo | 24 | $7,044 | $410.83 | 56% |
| Waikoloa Beach Resort | 27 | $6,060 | $544.82 | 46% |
| Kamuela | 93 | $5,561 | $1009.77 | 30% |
| Wainaku | 21 | $4,722 | $344.15 | 49% |
| Kahaluu-Keauhou | 767 | $4,704 | $402.19 | 45% |
| Kailua-Kona | 364 | $4,330 | $431.23 | 51% |
| Kapalaoa | 366 | $4,260 | $423.53 | 43% |