Mountain Home Airbnb Market Analysis 2026: Short Term Rental Data & Vacation Rental Statistics in Arkansas, United States
Is Airbnb profitable in Mountain Home in 2026? Explore comprehensive Airbnb analytics for Mountain Home, Arkansas, United States to uncover income potential. This 2026 STR market report for Mountain Home, based on AirROI data from February 2025 to January 2026, reveals key trends in the niche market of 130 active listings.
Whether you're considering an Airbnb investment in Mountain Home, optimizing your existing vacation rental, or exploring rental arbitrage opportunities, understanding the Mountain Home Airbnb data is crucial. Leveraging the low regulation environment is key to maximizing your short term rental income potential. Let's dive into the specifics.
Key Mountain Home Airbnb Performance Metrics Overview
Monthly Airbnb Revenue Variations & Income Potential in Mountain Home (2026)
Understanding the monthly revenue variations for Airbnb listings in Mountain Home is key to maximizing your short term rental income potential. Seasonality significantly impacts earnings. Our analysis, based on data from the past 12 months, shows that the peak revenue month for STRs in Mountain Home is typically July, while January often presents the lowest earnings, highlighting opportunities for strategic pricing adjustments during shoulder and low seasons. Explore the typical Airbnb income in Mountain Home across different performance tiers:
- Best-in-class properties (Top 10%) achieve $4,393+ monthly, often utilizing dynamic pricing and superior guest experiences.
- Strong performing properties (Top 25%) earn $2,796 or more, indicating effective management and desirable locations/amenities.
- Typical properties (Median) generate around $1,548 per month, representing the average market performance.
- Entry-level properties (Bottom 25%) see earnings around $756, often with potential for optimization.
Average Monthly Airbnb Earnings Trend in Mountain Home
Mountain Home Airbnb Occupancy Rate Trends (2026)
Maximize your bookings by understanding the Mountain Home STR occupancy trends. Seasonal demand shifts significantly influence how often properties are booked. Typically, Julysees the highest demand (peak season occupancy), while January experiences the lowest (low season). Effective strategies, like adjusting minimum stays or offering promotions, can boost occupancy during slower periods. Here's how different property tiers perform in Mountain Home:
- Best-in-class properties (Top 10%) achieve 66%+ occupancy, indicating high desirability and potentially optimized availability.
- Strong performing properties (Top 25%) maintain 45% or higher occupancy, suggesting good market fit and guest satisfaction.
- Typical properties (Median) have an occupancy rate around 28%.
- Entry-level properties (Bottom 25%) average 14% occupancy, potentially facing higher vacancy.
Average Monthly Occupancy Rate Trend in Mountain Home
Average Daily Rate (ADR) Airbnb Trends in Mountain Home (2026)
Effective short term rental pricing strategy in Mountain Home involves understanding monthly ADR fluctuations. The Average Daily Rate (ADR) for Airbnb in Mountain Home typically peaks in September and dips lowest during March. Leveraging Airbnb dynamic pricing tools or strategies based on this seasonality can significantly boost revenue. Here's a look at the typical nightly rates achieved:
- Best-in-class properties (Top 10%) command rates of $353+ per night, often due to premium features or locations.
- Strong performing properties (Top 25%) achieve nightly rates of $234 or more.
- Typical properties (Median) charge around $166 per night.
- Entry-level properties (Bottom 25%) earn around $134 per night.
Average Daily Rate (ADR) Trend by Month in Mountain Home
Get Live Mountain Home Market Intelligence 👇

Explore Real-time Analytics
Airbnb Seasonality Analysis & Trends in Mountain Home (2026)
Peak Season (July, June, October)
- Revenue averages $3,249 per month
- Occupancy rates average 40.8%
- Daily rates average $219
Shoulder Season
- Revenue averages $2,077 per month
- Occupancy maintains around 31.2%
- Daily rates hold near $206
Low Season (January, February, September)
- Revenue drops to average $1,555 per month
- Occupancy decreases to average 27.1%
- Daily rates adjust to average $210
Seasonality Insights for Mountain Home
- The Airbnb seasonality in Mountain Home shows highly seasonal trends requiring careful strategy. While the sections above show seasonal averages, it's also insightful to look at the extremes:
- During the high season, the absolute peak month showcases Mountain Home's highest earning potential, with monthly revenues capable of climbing to $3,727, occupancy reaching a high of 43.1%, and ADRs peaking at $222.
- Conversely, the slowest single month of the year, typically falling within the low season, marks the market's lowest point. In this month, revenue might dip to $1,360, occupancy could drop to 23.4%, and ADRs may adjust down to $193.
- Understanding both the seasonal averages and these monthly peaks and troughs in revenue, occupancy, and ADR is crucial for maximizing your Airbnb profit potential in Mountain Home.
Seasonal Strategies for Maximizing Profit
- Peak Season: Maximize revenue through premium pricing and potentially longer minimum stays. Ensure high availability.
- Low Season: Offer competitive pricing, special promotions (e.g., extended stay discounts), and flexible cancellation policies. Target off-season travelers like remote workers or budget-conscious guests.
- Shoulder Seasons: Implement dynamic pricing that balances peak and low rates. Target weekend travelers or specific events. Offer slightly more flexible terms than peak season.
- Regularly analyze your own performance against these Mountain Home seasonality benchmarks and adjust your pricing and availability strategy accordingly.
Best Areas for Airbnb Investment in Mountain Home (2026)
Exploring the top neighborhoods for short-term rentals in Mountain Home? This section highlights key areas, outlining why they are attractive for hosts and guests, along with notable local attractions. Consider these locations based on your target guest profile and investment strategy.
| Neighborhood / Area | Why Host Here? (Target Guests & Appeal) | Key Attractions & Landmarks |
|---|---|---|
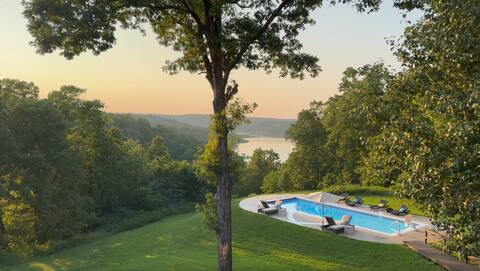
| Bull Shoals Lake waterfront | A popular destination for outdoor recreation, Bull Shoals Lake attracts visitors looking for fishing, boating, and camping experiences. The scenic beauty and tranquility make it an ideal spot for vacation rentals. | Bull Shoals State Park, Fishing on Bull Shoals Lake, Canoeing and Kayaking, Hiking Trails, Scenic Overlooks |
| Downtown Mountain Home | The heart of Mountain Home with charming local shops, cafes, and restaurants. This area attracts visitors wanting to experience local culture and community, making it great for Airbnb hosting. | Local Farmers Market, Shop Local Boutiques, Cafes and Restaurants, Community Events, Heritage Center |
| Norfork Lake | Known for its crystal-clear waters and beautiful shoreline, Norfork Lake is a major draw for vacationers seeking a peaceful retreat, perfect for water activities and relaxation. | Norfork Lake Resort Area, Fishing and Water Sports, Scenic Boat Tours, Hiking Trails, Wildlife Watching |
| Ozark National Forest | This stunning natural area offers opportunities for hiking, camping, and exploring the outdoors. It's a great location for those who want to immerse themselves in nature during their stay. | Hiking Trails, Wildlife Viewing, Camping Areas, Natural Springs, Scenic Drives |
| Baxter County Historical Society | Attracts history buffs and tourists interested in the region's heritage. Having an Airbnb nearby can cater to these visitors, especially during local events. | Historical Exhibits, Local Art, Guided Tours, Cultural Events, Community Festivals |
| Glade Top Trail | Renowned for its scenic drives and breathtaking views, particularly in fall. This area attracts photographers and nature lovers looking for picturesque landscapes. | Scenic Overlooks, Wildflower Viewings, Hiking Trails, Picnic Areas, Wildlife Watching |
| Mountain Home Shopping District | Shopping attractions, ranging from big box stores to local boutiques, make it a convenient place for visitors. It's a practical area for Airbnb hosts looking to cater to shopping enthusiasts. | Shopping Centers, Diverse Restaurants, Movie Theaters, Local Festivals, Annual Sales Events |
| Retail and Commercial Districts | With various retail and commercial options, this area appeals to business travelers and families visiting the area, making it a good fit for Airbnb rentals. | Shopping Malls, Dining Options, Family-Friendly Activities, Multiplex Cinemas, Bowling Alleys |
Understanding Airbnb License Requirements & STR Laws in Mountain Home (2026)
While Mountain Home, Arkansas, United States currently shows low STR regulations, specific Airbnb license requirements might still exist or change. Always verify the latest short term rental regulations and Airbnb license requirements directly with local government authorities for Mountain Home to ensure full compliance before hosting.
(Source: AirROI data, 2026, finding no licensed listings among those analyzed)
Top Performing Airbnb Properties in Mountain Home (2026)
Benchmark your potential! Explore examples of top-performing Airbnb properties in Mountain Homebased on Trailing Twelve Month (TTM) revenue. Analyze their characteristics, revenue, occupancy rate, and ADR to understand what drives success in this market.

Lakefront House • Sleeps 30 • Pool • Marina 10 min
Entire Place • 8 bedrooms
Lakefront House • Sleeps 18 • Pool • Marina 7 mins
Entire Place • 5 bedrooms
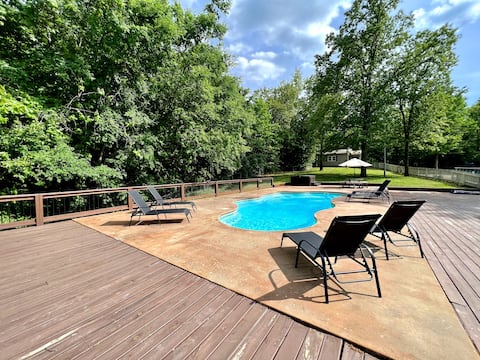
My Sweet Mtn. Home -Guest House w/ Pool & Hot Tub!
Entire Place • 6 bedrooms
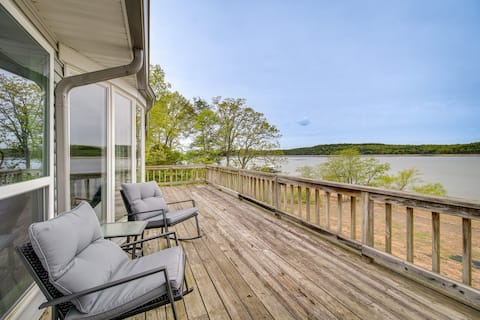
Serene Lakefront Mountain Home Getaway w/ Atrium!
Entire Place • 4 bedrooms

Spacious Family Home w/ Fire Pit by Norfork Lake!
Entire Place • 4 bedrooms

Beautiful Lake Home-Red Eye Lodge on Norfork Lake
Entire Place • 5 bedrooms
Note: Performance varies based on location, size, amenities, seasonality, and management quality. Data reflects the past 12 months.
Top Performing Airbnb Hosts in Mountain Home (2026)
Learn from the best! This table showcases top-performing Airbnb hosts in Mountain Home based on the number of properties managed and estimated total revenue over the past year. Analyze their scale and performance metrics.
| Host Name | Properties | Grossing Revenue | Stay Reviews | Avg Rating |
|---|---|---|---|---|
| Evolve | 29 | $632,934 | 686 | 4.75/5.0 |
| Hilary | 2 | $308,546 | 86 | 4.92/5.0 |
| Walt | 7 | $179,491 | 414 | 4.98/5.0 |
| Megan | 2 | $131,623 | 163 | 4.95/5.0 |
| Abe | 6 | $107,167 | 25 | 5.00/5.0 |
| Karla | 10 | $94,235 | 556 | 4.97/5.0 |
| Dauna | 3 | $64,842 | 248 | 4.94/5.0 |
| Lorie | 1 | $51,076 | 61 | 4.95/5.0 |
| Larry | 2 | $50,952 | 181 | 4.97/5.0 |
| Fish And Fiddle Resort | 11 | $50,431 | 48 | 4.98/5.0 |
Analyzing the strategies of top hosts, such as their property selection, pricing, and guest communication, can offer valuable lessons for optimizing your own Airbnb operations in Mountain Home.
Dive Deeper: Advanced Mountain Home STR Market Data (2026)
Ready to unlock more insights? AirROI provides access to advanced metrics and comprehensive Airbnb data for Mountain Home. Explore detailed analytics beyond this report to refine your investment strategy, optimize pricing, and maximize your vacation rental profits.
Explore Advanced MetricsMountain Home Short-Term Rental Market Composition (2026): Property & Room Types
Room Type Distribution
Property Type Distribution
Market Composition Insights for Mountain Home
- The Mountain Home Airbnb market composition is heavily skewed towards Entire Home/Apt listings, which make up 99.2% of the 130 active rentals. This indicates strong guest preference for privacy and space.
- Looking at the property type distribution in Mountain Home, House properties are the most common (49.2%), reflecting the local real estate landscape.
- Houses represent a significant 49.2% portion, catering likely to families or larger groups.
- Smaller segments like hotel/boutique, others, unique stays (combined 3.9%) offer potential for unique stay experiences.
Mountain Home Airbnb Room Capacity Analysis (2026): Bedroom Distribution
Distribution of Listings by Number of Bedrooms
Room Capacity Insights for Mountain Home
- The dominant room capacity in Mountain Home is 2 bedrooms listings, making up 30.8% of the market. This suggests a strong demand for properties suitable for couples or solo travelers.
- Together, 2 bedrooms and 3 bedrooms properties represent 55.4% of the active Airbnb listings in Mountain Home, indicating a high concentration in these sizes.
- A significant 44.6% of listings offer 3+ bedrooms, catering to larger groups and families seeking more space in Mountain Home.
Mountain Home Vacation Rental Guest Capacity Trends (2026)
Distribution of Listings by Guest Capacity
Guest Capacity Insights for Mountain Home
- The most common guest capacity trend in Mountain Home vacation rentals is listings accommodating 8+ guests (37.7%). This suggests the primary traveler segment is likely larger groups.
- Properties designed for 8+ guests and 4 guests dominate the Mountain Home STR market, accounting for 56.9% of listings.
- 60.8% of properties accommodate 6+ guests, serving the market segment for larger families or group travel in Mountain Home.
- On average, properties in Mountain Home are equipped to host 6.0 guests.
Mountain Home Airbnb Booking Patterns (2026): Available vs. Booked Days
Available Days Distribution
Booked Days Distribution
Booking Pattern Insights for Mountain Home
- The most common availability pattern in Mountain Home falls within the 271-366 days range, representing 63.1% of listings. This suggests many properties have significant open periods on their calendars.
- Approximately 93.1% of listings show high availability (181+ days open annually), indicating potential for increased bookings or specific owner usage patterns.
- For booked days, the 31-90 days range is most frequent in Mountain Home (39.2%), reflecting common guest stay durations or potential owner blocking patterns.
- A notable 9.2% of properties secure long booking periods (181+ days booked per year), highlighting successful long-term rental strategies or significant owner usage.
Mountain Home Airbnb Minimum Stay Requirements Analysis
Distribution of Listings by Minimum Night Requirement
1 Night
20 listings
15.4% of total
2 Nights
60 listings
46.2% of total
3 Nights
8 listings
6.2% of total
30+ Nights
42 listings
32.3% of total
Key Insights
- The most prevalent minimum stay requirement in Mountain Home is 2 Nights, adopted by 46.2% of listings. This highlights the market's preference for shorter, flexible bookings.
- A strong majority (61.6%) of the Mountain Home Airbnb data shows acceptance of very short stays (1-2 nights), indicating a dynamic, high-turnover market.
- A significant segment (32.3%) caters to monthly stays (30+ nights) in Mountain Home, pointing to opportunities in the extended-stay market.
Recommendations
- Align with the market by considering a 2 Nights minimum stay, as 46.2% of Mountain Home hosts use this setting.
- If feasible, allowing 1-night stays, especially midweek or during low season, could capture last-minute bookings, as only 15.4% currently do.
- A 2-night minimum appears standard (46.2%). Consider this for weekends or peak periods.
- Explore offering discounts for stays of 30+ nights to attract the 32.3% of the market seeking extended stays.
- Adjust minimum nights based on seasonality – potentially shorter during low season and longer during peak demand periods in Mountain Home.
Mountain Home Airbnb Cancellation Policy Trends Analysis (2026)
Limited
1 listings
0.8% of total
Flexible
29 listings
22.7% of total
Moderate
21 listings
16.4% of total
Firm
45 listings
35.2% of total
Strict
32 listings
25% of total
Cancellation Policy Insights for Mountain Home
- The prevailing Airbnb cancellation policy trend in Mountain Home is Firm, used by 35.2% of listings.
- A majority (60.2%) of hosts in Mountain Home utilize Firm or Strict policies, indicating a market where hosts prioritize booking security.
Recommendations for Hosts
- Consider adopting a Firm policy to align with the 35.2% market standard in Mountain Home.
- Regularly review your cancellation policy against competitors and market demand shifts in Mountain Home.
Mountain Home STR Booking Lead Time Analysis (2026)
Average Booking Lead Time by Month
Booking Lead Time Insights for Mountain Home
- The overall average booking lead time for vacation rentals in Mountain Home is 49 days.
- Guests book furthest in advance for stays during July (average 70 days), likely coinciding with peak travel demand or local events.
- The shortest booking windows occur for stays in February (average 19 days), indicating more last-minute travel plans during this time.
- Seasonally, Summer (58 days avg.) sees the longest lead times, while Winter (27 days avg.) has the shortest, reflecting typical travel planning cycles.
Recommendations for Hosts
- Use the overall average lead time (49 days) as a baseline for your pricing and availability strategy in Mountain Home.
- For July stays, consider implementing length-of-stay discounts or slightly higher rates for bookings made less than 70 days out to capitalize on advance planning.
- Target marketing efforts for the Summer season well in advance (at least 58 days) to capture early planners.
- Monitor your own booking lead times against these Mountain Home averages to identify opportunities for dynamic pricing adjustments.
Popular & Essential Airbnb Amenities in Mountain Home (2026)
Amenity Prevalence
Amenity Insights for Mountain Home
- Essential amenities in Mountain Home that guests expect include: Wifi, Air conditioning, TV. Lacking these (any) could significantly impact bookings.
- Popular amenities like Smoke alarm, Refrigerator, Kitchen are common but not universal. Offering these can provide a competitive edge.
Recommendations for Hosts
- Ensure your listing includes all essential amenities for Mountain Home: Wifi, Air conditioning, TV.
- Prioritize adding missing essentials: Wifi, Air conditioning, TV.
- Consider adding popular differentiators like Smoke alarm or Refrigerator to increase appeal.
- Highlight unique or less common amenities you offer (e.g., hot tub, dedicated workspace, EV charger) in your listing description and photos.
- Regularly check competitor amenities in Mountain Home to stay competitive.
Mountain Home Airbnb Guest Demographics & Profile Analysis (2026)
Guest Profile Summary for Mountain Home
- The typical guest profile for Airbnb in Mountain Home consists of primarily domestic travelers (99%), often arriving from nearby Jonesboro, typically belonging to the Post-2000s (Gen Z/Alpha) group (50%), primarily speaking English or Spanish.
- Domestic travelers account for 99.4% of guests.
- Key international markets include United States (99.4%) and United Kingdom (0.2%).
- Top languages spoken are English (88.6%) followed by Spanish (7.6%).
- A significant demographic segment is the Post-2000s (Gen Z/Alpha) group, representing 50% of guests.
Recommendations for Hosts
- Target domestic marketing efforts towards travelers from Jonesboro and Bentonville.
- Tailor amenities and listing descriptions to appeal to the dominant Post-2000s (Gen Z/Alpha) demographic (e.g., highlight fast WiFi, smart home features, local guides).
- Highlight unique local experiences or amenities relevant to the primary guest profile.
- Consider seasonal promotions aligned with peak travel times for key origin markets.
Nearby Short-Term Rental Market Comparison
How does the Mountain Home Airbnb market stack up against its neighbors? Compare key performance metrics like average monthly revenue, ADR, and occupancy rates in surrounding areas to understand the broader regional STR landscape.
| Market | Active Properties | Monthly Revenue | Daily Rate | Avg. Occupancy |
|---|---|---|---|---|
| Blue Eye | 32 | $5,674 | $427.78 | 50% |
| Hollister | 317 | $4,744 | $431.85 | 42% |
| Omaha | 38 | $3,581 | $270.03 | 48% |
| Ridgedale | 121 | $3,353 | $429.21 | 38% |
| Flippin | 35 | $3,256 | $268.96 | 39% |
| Branson West | 267 | $3,068 | $246.89 | 43% |
| Ponca | 40 | $2,893 | $371.63 | 31% |
| Kimberling City | 351 | $2,826 | $332.93 | 33% |
| Kirbyville | 20 | $2,817 | $282.48 | 32% |
| Lampe | 96 | $2,606 | $389.22 | 33% |