Kingston Airbnb Market Analysis 2026: Short Term Rental Data & Vacation Rental Statistics in Arkansas, United States
Is Airbnb profitable in Kingston in 2026? Explore comprehensive Airbnb analytics for Kingston, Arkansas, United States to uncover income potential. This 2026 STR market report for Kingston, based on AirROI data from February 2025 to January 2026, reveals key trends in the niche market of 23 active listings.
Whether you're considering an Airbnb investment in Kingston, optimizing your existing vacation rental, or exploring rental arbitrage opportunities, understanding the Kingston Airbnb data is crucial. Leveraging the low regulation environment is key to maximizing your short term rental income potential. Let's dive into the specifics.
Key Kingston Airbnb Performance Metrics Overview
Monthly Airbnb Revenue Variations & Income Potential in Kingston (2026)
Understanding the monthly revenue variations for Airbnb listings in Kingston is key to maximizing your short term rental income potential. Seasonality significantly impacts earnings. Our analysis, based on data from the past 12 months, shows that the peak revenue month for STRs in Kingston is typically October, while February often presents the lowest earnings, highlighting opportunities for strategic pricing adjustments during shoulder and low seasons. Explore the typical Airbnb income in Kingston across different performance tiers:
- Best-in-class properties (Top 10%) achieve $2,748+ monthly, often utilizing dynamic pricing and superior guest experiences.
- Strong performing properties (Top 25%) earn $2,040 or more, indicating effective management and desirable locations/amenities.
- Typical properties (Median) generate around $1,157 per month, representing the average market performance.
- Entry-level properties (Bottom 25%) see earnings around $647, often with potential for optimization.
Average Monthly Airbnb Earnings Trend in Kingston
Kingston Airbnb Occupancy Rate Trends (2026)
Maximize your bookings by understanding the Kingston STR occupancy trends. Seasonal demand shifts significantly influence how often properties are booked. Typically, Octobersees the highest demand (peak season occupancy), while December experiences the lowest (low season). Effective strategies, like adjusting minimum stays or offering promotions, can boost occupancy during slower periods. Here's how different property tiers perform in Kingston:
- Best-in-class properties (Top 10%) achieve 58%+ occupancy, indicating high desirability and potentially optimized availability.
- Strong performing properties (Top 25%) maintain 44% or higher occupancy, suggesting good market fit and guest satisfaction.
- Typical properties (Median) have an occupancy rate around 27%.
- Entry-level properties (Bottom 25%) average 16% occupancy, potentially facing higher vacancy.
Average Monthly Occupancy Rate Trend in Kingston
Average Daily Rate (ADR) Airbnb Trends in Kingston (2026)
Effective short term rental pricing strategy in Kingston involves understanding monthly ADR fluctuations. The Average Daily Rate (ADR) for Airbnb in Kingston typically peaks in June and dips lowest during November. Leveraging Airbnb dynamic pricing tools or strategies based on this seasonality can significantly boost revenue. Here's a look at the typical nightly rates achieved:
- Best-in-class properties (Top 10%) command rates of $212+ per night, often due to premium features or locations.
- Strong performing properties (Top 25%) achieve nightly rates of $167 or more.
- Typical properties (Median) charge around $149 per night.
- Entry-level properties (Bottom 25%) earn around $126 per night.
Average Daily Rate (ADR) Trend by Month in Kingston
Get Live Kingston Market Intelligence 👇

Explore Real-time Analytics
Airbnb Seasonality Analysis & Trends in Kingston (2026)
Peak Season (October, May, March)
- Revenue averages $2,047 per month
- Occupancy rates average 41.3%
- Daily rates average $155
Shoulder Season
- Revenue averages $1,388 per month
- Occupancy maintains around 28.8%
- Daily rates hold near $156
Low Season (February, August, September)
- Revenue drops to average $1,080 per month
- Occupancy decreases to average 24.9%
- Daily rates adjust to average $157
Seasonality Insights for Kingston
- The Airbnb seasonality in Kingston shows highly seasonal trends requiring careful strategy. While the sections above show seasonal averages, it's also insightful to look at the extremes:
- During the high season, the absolute peak month showcases Kingston's highest earning potential, with monthly revenues capable of climbing to $2,423, occupancy reaching a high of 50.3%, and ADRs peaking at $164.
- Conversely, the slowest single month of the year, typically falling within the low season, marks the market's lowest point. In this month, revenue might dip to $962, occupancy could drop to 23.4%, and ADRs may adjust down to $152.
- Understanding both the seasonal averages and these monthly peaks and troughs in revenue, occupancy, and ADR is crucial for maximizing your Airbnb profit potential in Kingston.
Seasonal Strategies for Maximizing Profit
- Peak Season: Maximize revenue through premium pricing and potentially longer minimum stays. Ensure high availability.
- Low Season: Offer competitive pricing, special promotions (e.g., extended stay discounts), and flexible cancellation policies. Target off-season travelers like remote workers or budget-conscious guests.
- Shoulder Seasons: Implement dynamic pricing that balances peak and low rates. Target weekend travelers or specific events. Offer slightly more flexible terms than peak season.
- Regularly analyze your own performance against these Kingston seasonality benchmarks and adjust your pricing and availability strategy accordingly.
Best Areas for Airbnb Investment in Kingston (2026)
Exploring the top neighborhoods for short-term rentals in Kingston? This section highlights key areas, outlining why they are attractive for hosts and guests, along with notable local attractions. Consider these locations based on your target guest profile and investment strategy.
| Neighborhood / Area | Why Host Here? (Target Guests & Appeal) | Key Attractions & Landmarks |
|---|---|---|
| Downtown Kingston | The heart of Kingston with a variety of activities and attractions. It's a vibrant area that attracts both tourists and business travelers, making it ideal for short-term rentals. | Kingston Museum, Malcolm X Buffalo Soldier Gallery, Pinnacle Mountain State Park, Local shops and restaurants, Public transportation access |
| Lake Catherine State Park | A beautiful natural area with recreational opportunities such as hiking, fishing, and boating, ideal for nature lovers seeking a relaxing getaway. | Lake Catherine, Hiking trails, Fishing spots, Campsites and cabins, Scenic views |
| Shorter College Area | A college town atmosphere that attracts students and visitors, making it a prime location for hosting Airbnbs looking for budget-friendly accommodations. | Shorter College, Local cafes and bookstores, Parks and greenery, Community events, Cultural festivals |
| Hot Springs | Just a short drive away, this area is famous for its hot springs, historic bathhouses, and vibrant arts scene, attracting tourists year-round. | Hot Springs National Park, Bathhouse Row, Garvan Woodland Gardens, Oaklawn Racing Casino Resort, Local art galleries |
| Fairfield Bay | A family-friendly community by the lake, perfect for summer vacations. Offers outdoor activities such as boating and golfing, appealing to families and groups. | Greers Ferry Lake, Golf courses, Marinas and boat rentals, Hiking trails, Community events |
| Mountain View | Known as the Folk Music Capital of the World, Mountain View attracts music lovers and those wanting a peaceful rural retreat. | Ozark Folk Center State Park, Live music events, Caves and natural beauty, Local artisan shops, Scenic drives |
| Gravette | A growing town in Northwest Arkansas that offers a mix of rural charm and urban amenities, appealing to visitors looking for a quaint getaway. | Gravette Historical Museum, Parks and recreational activities, Local dining options, Community festivals, Proximity to larger cities |
| Beaver Lake | A popular destination for fishing, boating, and outdoor activities, Beaver Lake is an attractive spot for tourists seeking adventure and relaxation in nature. | Beaver Lake Marina, Fishing and boating, Hiking trails, Scenic vistas, Wildlife watching |
Understanding Airbnb License Requirements & STR Laws in Kingston (2026)
While Kingston, Arkansas, United States currently shows low STR regulations, specific Airbnb license requirements might still exist or change. Always verify the latest short term rental regulations and Airbnb license requirements directly with local government authorities for Kingston to ensure full compliance before hosting.
(Source: AirROI data, 2026, finding no licensed listings among those analyzed)
Top Performing Airbnb Properties in Kingston (2026)
Benchmark your potential! Explore examples of top-performing Airbnb properties in Kingstonbased on Trailing Twelve Month (TTM) revenue. Analyze their characteristics, revenue, occupancy rate, and ADR to understand what drives success in this market.
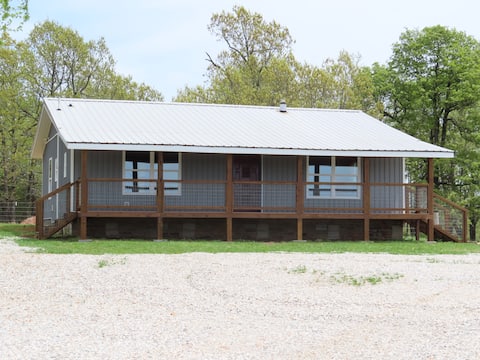
3/4 of a mile to Wilderness Rider Buffalo Ranch!
Entire Place • 3 bedrooms

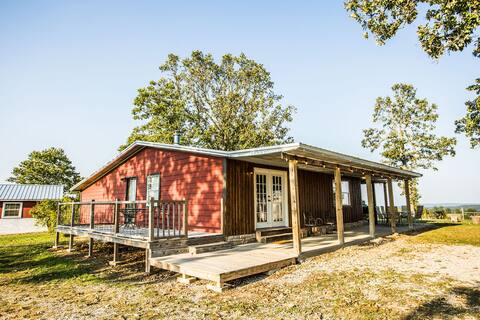
River Run Hideaway
Entire Place • 1 bedroom
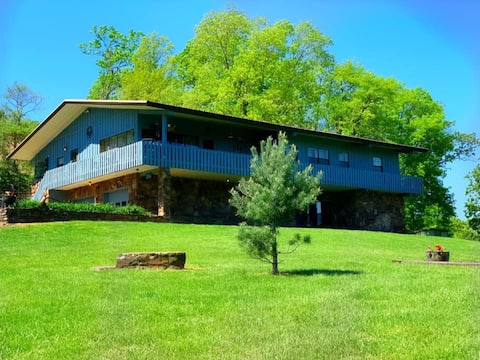
The Roost-Close to Buffalo River&Wilderness Rider
Entire Place • 2 bedrooms
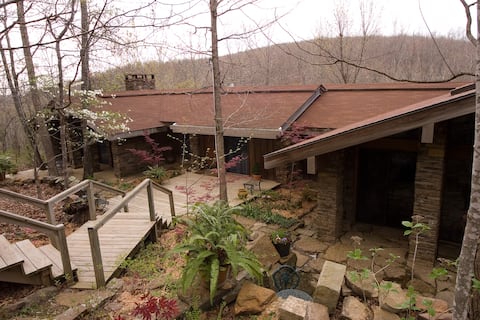
A&M Lodge at Treat’s Farm, join us in the country,
Entire Place • 6 bedrooms
Azalea Falls Lodge - Upper Buffalo Ozark Getaway
Entire Place • 3 bedrooms

All The Pretty Sunsets-Close to Wilderness Rider
Entire Place • 3 bedrooms
Note: Performance varies based on location, size, amenities, seasonality, and management quality. Data reflects the past 12 months.
Top Performing Airbnb Hosts in Kingston (2026)
Learn from the best! This table showcases top-performing Airbnb hosts in Kingston based on the number of properties managed and estimated total revenue over the past year. Analyze their scale and performance metrics.
| Host Name | Properties | Grossing Revenue | Stay Reviews | Avg Rating |
|---|---|---|---|---|
| Maggie | 3 | $57,804 | 153 | 4.95/5.0 |
| Tracy | 1 | $39,242 | 27 | 4.96/5.0 |
| Debbie | 3 | $28,016 | 157 | 4.99/5.0 |
| Ashley & Kellie | 1 | $26,951 | 29 | 4.93/5.0 |
| Stephanie | 2 | $23,007 | 119 | 4.89/5.0 |
| Myle | 1 | $22,685 | 89 | 4.94/5.0 |
| Kathy | 1 | $22,330 | 105 | 4.85/5.0 |
| Ronald | 1 | $19,318 | 395 | 4.92/5.0 |
| Paula | 2 | $19,298 | 86 | 4.96/5.0 |
| Anita | 1 | $15,377 | 65 | 4.98/5.0 |
Analyzing the strategies of top hosts, such as their property selection, pricing, and guest communication, can offer valuable lessons for optimizing your own Airbnb operations in Kingston.
Dive Deeper: Advanced Kingston STR Market Data (2026)
Ready to unlock more insights? AirROI provides access to advanced metrics and comprehensive Airbnb data for Kingston. Explore detailed analytics beyond this report to refine your investment strategy, optimize pricing, and maximize your vacation rental profits.
Explore Advanced MetricsKingston Short-Term Rental Market Composition (2026): Property & Room Types
Room Type Distribution
Property Type Distribution
Market Composition Insights for Kingston
- The Kingston Airbnb market composition is heavily skewed towards Entire Home/Apt listings, which make up 100% of the 23 active rentals. This indicates strong guest preference for privacy and space.
- Looking at the property type distribution in Kingston, Outdoor/Unique properties are the most common (60.9%), reflecting the local real estate landscape.
- Houses represent a significant 26.1% portion, catering likely to families or larger groups.
Kingston Airbnb Room Capacity Analysis (2026): Bedroom Distribution
Distribution of Listings by Number of Bedrooms
Room Capacity Insights for Kingston
- The dominant room capacity in Kingston is 1 bedroom listings, making up 43.5% of the market. This suggests a strong demand for properties suitable for couples or solo travelers.
- Together, 1 bedroom and 3 bedrooms properties represent 69.6% of the active Airbnb listings in Kingston, indicating a high concentration in these sizes.
- A significant 30.4% of listings offer 3+ bedrooms, catering to larger groups and families seeking more space in Kingston.
Kingston Vacation Rental Guest Capacity Trends (2026)
Distribution of Listings by Guest Capacity
Guest Capacity Insights for Kingston
- The most common guest capacity trend in Kingston vacation rentals is listings accommodating 4 guests (39.1%). This suggests the primary traveler segment is likely small families or groups.
- Properties designed for 4 guests and 8+ guests dominate the Kingston STR market, accounting for 65.2% of listings.
- 39.1% of properties accommodate 6+ guests, serving the market segment for larger families or group travel in Kingston.
- On average, properties in Kingston are equipped to host 5.0 guests.
Kingston Airbnb Booking Patterns (2026): Available vs. Booked Days
Available Days Distribution
Booked Days Distribution
Booking Pattern Insights for Kingston
- The most common availability pattern in Kingston falls within the 271-366 days range, representing 56.5% of listings. This suggests many properties have significant open periods on their calendars.
- Approximately 95.6% of listings show high availability (181+ days open annually), indicating potential for increased bookings or specific owner usage patterns.
- For booked days, the 31-90 days range is most frequent in Kingston (52.2%), reflecting common guest stay durations or potential owner blocking patterns.
- A notable 4.3% of properties secure long booking periods (181+ days booked per year), highlighting successful long-term rental strategies or significant owner usage.
Kingston Airbnb Minimum Stay Requirements Analysis
Distribution of Listings by Minimum Night Requirement
1 Night
4 listings
17.4% of total
2 Nights
15 listings
65.2% of total
30+ Nights
4 listings
17.4% of total
Key Insights
- The most prevalent minimum stay requirement in Kingston is 2 Nights, adopted by 65.2% of listings. This highlights the market's preference for shorter, flexible bookings.
- A strong majority (82.6%) of the Kingston Airbnb data shows acceptance of very short stays (1-2 nights), indicating a dynamic, high-turnover market.
- A significant segment (17.4%) caters to monthly stays (30+ nights) in Kingston, pointing to opportunities in the extended-stay market.
Recommendations
- Align with the market by considering a 2 Nights minimum stay, as 65.2% of Kingston hosts use this setting.
- If feasible, allowing 1-night stays, especially midweek or during low season, could capture last-minute bookings, as only 17.4% currently do.
- A 2-night minimum appears standard (65.2%). Consider this for weekends or peak periods.
- Explore offering discounts for stays of 30+ nights to attract the 17.4% of the market seeking extended stays.
- Adjust minimum nights based on seasonality – potentially shorter during low season and longer during peak demand periods in Kingston.
Kingston Airbnb Cancellation Policy Trends Analysis (2026)
Flexible
1 listings
4.3% of total
Moderate
12 listings
52.2% of total
Firm
7 listings
30.4% of total
Strict
3 listings
13% of total
Cancellation Policy Insights for Kingston
- The prevailing Airbnb cancellation policy trend in Kingston is Moderate, used by 52.2% of listings.
- There's a relatively balanced mix between guest-friendly (56.5%) and stricter (43.4%) policies, offering choices for different guest needs.
Recommendations for Hosts
- Consider adopting a Moderate policy to align with the 52.2% market standard in Kingston.
- Using a Strict policy might deter some guests, as only 13% of listings use it. Evaluate if potential revenue protection outweighs possible lower booking rates.
- Regularly review your cancellation policy against competitors and market demand shifts in Kingston.
Kingston STR Booking Lead Time Analysis (2026)
Average Booking Lead Time by Month
Booking Lead Time Insights for Kingston
- The overall average booking lead time for vacation rentals in Kingston is 33 days.
- Guests book furthest in advance for stays during October (average 56 days), likely coinciding with peak travel demand or local events.
- The shortest booking windows occur for stays in January (average 7 days), indicating more last-minute travel plans during this time.
- Seasonally, Fall (41 days avg.) sees the longest lead times, while Winter (20 days avg.) has the shortest, reflecting typical travel planning cycles.
Recommendations for Hosts
- Use the overall average lead time (33 days) as a baseline for your pricing and availability strategy in Kingston.
- For October stays, consider implementing length-of-stay discounts or slightly higher rates for bookings made less than 56 days out to capitalize on advance planning.
- During January, focus on last-minute booking availability and promotions, as guests book with very short notice (7 days avg.).
- Target marketing efforts for the Fall season well in advance (at least 41 days) to capture early planners.
- Monitor your own booking lead times against these Kingston averages to identify opportunities for dynamic pricing adjustments.
Popular & Essential Airbnb Amenities in Kingston (2026)
Amenity Prevalence
Amenity Insights for Kingston
- Essential amenities in Kingston that guests expect include: Heating, TV, Coffee maker, Kitchen, Dishes and silverware, Air conditioning. Lacking these (any) could significantly impact bookings.
- Popular amenities like Hot water, Fire extinguisher, Microwave are common but not universal. Offering these can provide a competitive edge.
Recommendations for Hosts
- Ensure your listing includes all essential amenities for Kingston: Heating, TV, Coffee maker, Kitchen, Dishes and silverware, Air conditioning.
- Prioritize adding missing essentials: TV, Coffee maker, Kitchen, Dishes and silverware, Air conditioning.
- Consider adding popular differentiators like Hot water or Fire extinguisher to increase appeal.
- Highlight unique or less common amenities you offer (e.g., hot tub, dedicated workspace, EV charger) in your listing description and photos.
- Regularly check competitor amenities in Kingston to stay competitive.
Kingston Airbnb Guest Demographics & Profile Analysis (2026)
Guest Profile Summary for Kingston
- The typical guest profile for Airbnb in Kingston consists of primarily domestic travelers (100%), often arriving from nearby Little Rock, typically belonging to the Post-2000s (Gen Z/Alpha) group (50%), primarily speaking English or Spanish.
- Domestic travelers account for 100.0% of guests.
- Top languages spoken are English (89.4%) followed by Spanish (4.3%).
- A significant demographic segment is the Post-2000s (Gen Z/Alpha) group, representing 50% of guests.
Recommendations for Hosts
- Target domestic marketing efforts towards travelers from Little Rock and Kansas City.
- Tailor amenities and listing descriptions to appeal to the dominant Post-2000s (Gen Z/Alpha) demographic (e.g., highlight fast WiFi, smart home features, local guides).
- Highlight unique local experiences or amenities relevant to the primary guest profile.
- Consider seasonal promotions aligned with peak travel times for key origin markets.
Nearby Short-Term Rental Market Comparison
How does the Kingston Airbnb market stack up against its neighbors? Compare key performance metrics like average monthly revenue, ADR, and occupancy rates in surrounding areas to understand the broader regional STR landscape.
| Market | Active Properties | Monthly Revenue | Daily Rate | Avg. Occupancy |
|---|---|---|---|---|
| Blue Eye | 32 | $5,674 | $427.78 | 50% |
| Hollister | 317 | $4,744 | $431.85 | 42% |
| Omaha | 38 | $3,581 | $270.03 | 48% |
| Ridgedale | 121 | $3,353 | $429.21 | 38% |
| Flippin | 35 | $3,256 | $268.96 | 39% |
| Branson West | 267 | $3,068 | $246.89 | 43% |
| Little Flock | 17 | $2,955 | $370.27 | 40% |
| Lowell | 30 | $2,905 | $254.69 | 43% |
| Ponca | 40 | $2,893 | $371.63 | 31% |
| Kimberling City | 351 | $2,826 | $332.93 | 33% |