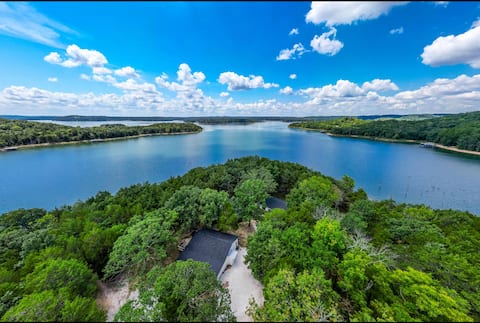
Garfield Airbnb Market Analysis 2026: Short Term Rental Data & Vacation Rental Statistics in Arkansas, United States
Is Airbnb profitable in Garfield in 2026? Explore comprehensive Airbnb analytics for Garfield, Arkansas, United States to uncover income potential. This 2026 STR market report for Garfield, based on AirROI data from February 2025 to January 2026, reveals key trends in the niche market of 121 active listings.
Whether you're considering an Airbnb investment in Garfield, optimizing your existing vacation rental, or exploring rental arbitrage opportunities, understanding the Garfield Airbnb data is crucial. Leveraging the low regulation environment is key to maximizing your short term rental income potential. Let's dive into the specifics.
Key Garfield Airbnb Performance Metrics Overview
Monthly Airbnb Revenue Variations & Income Potential in Garfield (2026)
Understanding the monthly revenue variations for Airbnb listings in Garfield is key to maximizing your short term rental income potential. Seasonality significantly impacts earnings. Our analysis, based on data from the past 12 months, shows that the peak revenue month for STRs in Garfield is typically July, while January often presents the lowest earnings, highlighting opportunities for strategic pricing adjustments during shoulder and low seasons. Explore the typical Airbnb income in Garfield across different performance tiers:
- Best-in-class properties (Top 10%) achieve $6,140+ monthly, often utilizing dynamic pricing and superior guest experiences.
- Strong performing properties (Top 25%) earn $4,028 or more, indicating effective management and desirable locations/amenities.
- Typical properties (Median) generate around $2,292 per month, representing the average market performance.
- Entry-level properties (Bottom 25%) see earnings around $1,214, often with potential for optimization.
Average Monthly Airbnb Earnings Trend in Garfield
Garfield Airbnb Occupancy Rate Trends (2026)
Maximize your bookings by understanding the Garfield STR occupancy trends. Seasonal demand shifts significantly influence how often properties are booked. Typically, Julysees the highest demand (peak season occupancy), while January experiences the lowest (low season). Effective strategies, like adjusting minimum stays or offering promotions, can boost occupancy during slower periods. Here's how different property tiers perform in Garfield:
- Best-in-class properties (Top 10%) achieve 63%+ occupancy, indicating high desirability and potentially optimized availability.
- Strong performing properties (Top 25%) maintain 47% or higher occupancy, suggesting good market fit and guest satisfaction.
- Typical properties (Median) have an occupancy rate around 31%.
- Entry-level properties (Bottom 25%) average 18% occupancy, potentially facing higher vacancy.
Average Monthly Occupancy Rate Trend in Garfield
Average Daily Rate (ADR) Airbnb Trends in Garfield (2026)
Effective short term rental pricing strategy in Garfield involves understanding monthly ADR fluctuations. The Average Daily Rate (ADR) for Airbnb in Garfield typically peaks in June and dips lowest during February. Leveraging Airbnb dynamic pricing tools or strategies based on this seasonality can significantly boost revenue. Here's a look at the typical nightly rates achieved:
- Best-in-class properties (Top 10%) command rates of $480+ per night, often due to premium features or locations.
- Strong performing properties (Top 25%) achieve nightly rates of $364 or more.
- Typical properties (Median) charge around $256 per night.
- Entry-level properties (Bottom 25%) earn around $187 per night.
Average Daily Rate (ADR) Trend by Month in Garfield
Get Live Garfield Market Intelligence 👇

Explore Real-time Analytics
Airbnb Seasonality Analysis & Trends in Garfield (2026)
Peak Season (July, June, August)
- Revenue averages $4,643 per month
- Occupancy rates average 48.1%
- Daily rates average $305
Shoulder Season
- Revenue averages $2,820 per month
- Occupancy maintains around 32.6%
- Daily rates hold near $294
Low Season (January, February, April)
- Revenue drops to average $1,505 per month
- Occupancy decreases to average 21.7%
- Daily rates adjust to average $273
Seasonality Insights for Garfield
- The Airbnb seasonality in Garfield shows highly seasonal trends requiring careful strategy. While the sections above show seasonal averages, it's also insightful to look at the extremes:
- During the high season, the absolute peak month showcases Garfield's highest earning potential, with monthly revenues capable of climbing to $5,599, occupancy reaching a high of 57.9%, and ADRs peaking at $309.
- Conversely, the slowest single month of the year, typically falling within the low season, marks the market's lowest point. In this month, revenue might dip to $1,260, occupancy could drop to 13.9%, and ADRs may adjust down to $257.
- Understanding both the seasonal averages and these monthly peaks and troughs in revenue, occupancy, and ADR is crucial for maximizing your Airbnb profit potential in Garfield.
Seasonal Strategies for Maximizing Profit
- Peak Season: Maximize revenue through premium pricing and potentially longer minimum stays. Ensure high availability.
- Low Season: Offer competitive pricing, special promotions (e.g., extended stay discounts), and flexible cancellation policies. Target off-season travelers like remote workers or budget-conscious guests.
- Shoulder Seasons: Implement dynamic pricing that balances peak and low rates. Target weekend travelers or specific events. Offer slightly more flexible terms than peak season.
- Regularly analyze your own performance against these Garfield seasonality benchmarks and adjust your pricing and availability strategy accordingly.
Best Areas for Airbnb Investment in Garfield (2026)
Exploring the top neighborhoods for short-term rentals in Garfield? This section highlights key areas, outlining why they are attractive for hosts and guests, along with notable local attractions. Consider these locations based on your target guest profile and investment strategy.
| Neighborhood / Area | Why Host Here? (Target Guests & Appeal) | Key Attractions & Landmarks |
|---|---|---|
| Downtown Garfield | The heart of Garfield with charming local shops and eateries. Perfect for visitors looking to experience the local culture and community. Close to parks and family-friendly activities. | Garfield Community Park, Local Farmers Market, Downtown Shops, Garfield Historical Museum |
| Lake Bianca | A scenic area featuring a beautiful lake, ideal for nature enthusiasts and families. Attracts visitors for fishing, boating, and tranquility. | Lake Bianca, Fishing Spots, Picnic Areas, Walking Trails |
| Rogers | Nearby Rogers, known for its growing attractions and amenities, appeals to travelers wanting a bit more urban access while enjoying the rural charm of Garfield. | Rogers Historical Museum, The Promenade at Pine St., Lake Atalanta, Rogers Aquatic Center |
| Hobbs State Park | Located just outside Garfield, this park offers an outdoor paradise with hiking, biking, and camping opportunities. Great for visitors who enjoy adventure and nature. | Hiking Trails, Nature Center, Camping Sites, Lake Beaver |
| Pea Ridge | A quickly growing town with historical significance, near Garfield. Attracts history buffs and those wishing to immerse themselves in local heritage. | Pea Ridge National Military Park, Local History Tours, Scenic Views |
| Ozark National Forest | A vast expanse of protected land with stunning landscapes, ideal for outdoor activities and eco-tourism. Perfect for those looking to escape into nature. | Hiking Trails, Wildlife Watching, Camping, Scenic Drives |
| War Eagle Mill | A picturesque site with a historic mill and charming surroundings, ideal for day trips and experiencing local crafts and goods. | War Eagle Mill, Craft Shows, River Views, Nature Trails |
| Bella Vista | A nearby upscale community known for its lakes, golf courses, and recreational opportunities, attractive for tourists looking for a more upscale experience. | Bella Vista Golf Club, Lake Avalon, Walking Trails, Art Galleries |
Understanding Airbnb License Requirements & STR Laws in Garfield (2026)
While Garfield, Arkansas, United States currently shows low STR regulations, specific Airbnb license requirements might still exist or change. Always verify the latest short term rental regulations and Airbnb license requirements directly with local government authorities for Garfield to ensure full compliance before hosting.
(Source: AirROI data, 2026, finding no licensed listings among those analyzed)
Top Performing Airbnb Properties in Garfield (2026)
Benchmark your potential! Explore examples of top-performing Airbnb properties in Garfieldbased on Trailing Twelve Month (TTM) revenue. Analyze their characteristics, revenue, occupancy rate, and ADR to understand what drives success in this market.

Arcade Palace on the Lake
Entire Place • 5 bedrooms

Kayak/Paddleboard/Across fr POOL/Tennis/Pickleball
Entire Place • 4 bedrooms
Gameroom, Lakefront, Gentle walk to water
Entire Place • 7 bedrooms

Camp Roberts-Lakefront-Sleeps 19-Big Lake View
Entire Place • 8 bedrooms

Tranquil Cove-Beaver Lake Access-Amazing Views
Entire Place • 3 bedrooms

Eagle Nest Lakehouse-Lake front to Beaver Lake
Entire Place • 5 bedrooms
Note: Performance varies based on location, size, amenities, seasonality, and management quality. Data reflects the past 12 months.
Top Performing Airbnb Hosts in Garfield (2026)
Learn from the best! This table showcases top-performing Airbnb hosts in Garfield based on the number of properties managed and estimated total revenue over the past year. Analyze their scale and performance metrics.
| Host Name | Properties | Grossing Revenue | Stay Reviews | Avg Rating |
|---|---|---|---|---|
| Ellen | 34 | $478,664 | 387 | 4.80/5.0 |
| Evolve | 8 | $279,419 | 192 | 4.77/5.0 |
| Cohova | 5 | $257,116 | 130 | 4.72/5.0 |
| Harminder | 2 | $151,105 | 256 | 4.72/5.0 |
| Beverly | 4 | $114,220 | 631 | 4.95/5.0 |
| Chelsea | 3 | $110,974 | 157 | 4.88/5.0 |
| Rebekah | 1 | $84,911 | 240 | 4.93/5.0 |
| Kimberly | 1 | $69,076 | 65 | 4.85/5.0 |
| Nicole | 1 | $68,710 | 31 | 5.00/5.0 |
| Jace And Erin | 1 | $66,062 | 63 | 4.98/5.0 |
Analyzing the strategies of top hosts, such as their property selection, pricing, and guest communication, can offer valuable lessons for optimizing your own Airbnb operations in Garfield.
Dive Deeper: Advanced Garfield STR Market Data (2026)
Ready to unlock more insights? AirROI provides access to advanced metrics and comprehensive Airbnb data for Garfield. Explore detailed analytics beyond this report to refine your investment strategy, optimize pricing, and maximize your vacation rental profits.
Explore Advanced MetricsGarfield Short-Term Rental Market Composition (2026): Property & Room Types
Room Type Distribution
Property Type Distribution
Market Composition Insights for Garfield
- The Garfield Airbnb market composition is heavily skewed towards Entire Home/Apt listings, which make up 98.3% of the 121 active rentals. This indicates strong guest preference for privacy and space.
- Looking at the property type distribution in Garfield, House properties are the most common (76.9%), reflecting the local real estate landscape.
- Houses represent a significant 76.9% portion, catering likely to families or larger groups.
- Smaller segments like apartment/condo, others (combined 4.9%) offer potential for unique stay experiences.
Garfield Airbnb Room Capacity Analysis (2026): Bedroom Distribution
Distribution of Listings by Number of Bedrooms
Room Capacity Insights for Garfield
- The dominant room capacity in Garfield is 4 bedrooms listings, making up 29.8% of the market. This suggests a strong demand for properties suitable for families or small groups.
- Together, 4 bedrooms and 3 bedrooms properties represent 57.1% of the active Airbnb listings in Garfield, indicating a high concentration in these sizes.
- A significant 68.7% of listings offer 3+ bedrooms, catering to larger groups and families seeking more space in Garfield.
Garfield Vacation Rental Guest Capacity Trends (2026)
Distribution of Listings by Guest Capacity
Guest Capacity Insights for Garfield
- The most common guest capacity trend in Garfield vacation rentals is listings accommodating 8+ guests (69.4%). This suggests the primary traveler segment is likely larger groups.
- Properties designed for 8+ guests and 6 guests dominate the Garfield STR market, accounting for 81.0% of listings.
- 83.5% of properties accommodate 6+ guests, serving the market segment for larger families or group travel in Garfield.
- On average, properties in Garfield are equipped to host 7.0 guests.
Garfield Airbnb Booking Patterns (2026): Available vs. Booked Days
Available Days Distribution
Booked Days Distribution
Booking Pattern Insights for Garfield
- The most common availability pattern in Garfield falls within the 271-366 days range, representing 55.4% of listings. This suggests many properties have significant open periods on their calendars.
- Approximately 94.2% of listings show high availability (181+ days open annually), indicating potential for increased bookings or specific owner usage patterns.
- For booked days, the 91-180 days range is most frequent in Garfield (40.5%), reflecting common guest stay durations or potential owner blocking patterns.
- A notable 6.6% of properties secure long booking periods (181+ days booked per year), highlighting successful long-term rental strategies or significant owner usage.
Garfield Airbnb Minimum Stay Requirements Analysis
Distribution of Listings by Minimum Night Requirement
1 Night
9 listings
7.4% of total
2 Nights
49 listings
40.5% of total
3 Nights
9 listings
7.4% of total
4-6 Nights
1 listings
0.8% of total
30+ Nights
53 listings
43.8% of total
Key Insights
- The most prevalent minimum stay requirement in Garfield is 30+ Nights, adopted by 43.8% of listings. This highlights the market's preference for longer commitments.
- A significant segment (43.8%) caters to monthly stays (30+ nights) in Garfield, pointing to opportunities in the extended-stay market.
Recommendations
- Align with the market by considering a 30+ Nights minimum stay, as 43.8% of Garfield hosts use this setting.
- If feasible, allowing 1-night stays, especially midweek or during low season, could capture last-minute bookings, as only 7.4% currently do.
- A 2-night minimum appears standard (40.5%). Consider this for weekends or peak periods.
- Explore offering discounts for stays of 30+ nights to attract the 43.8% of the market seeking extended stays.
- Adjust minimum nights based on seasonality – potentially shorter during low season and longer during peak demand periods in Garfield.
Garfield Airbnb Cancellation Policy Trends Analysis (2026)
Limited
8 listings
6.6% of total
Super Strict 30 Days
2 listings
1.7% of total
Flexible
11 listings
9.1% of total
Moderate
25 listings
20.7% of total
Firm
63 listings
52.1% of total
Strict
12 listings
9.9% of total
Cancellation Policy Insights for Garfield
- The prevailing Airbnb cancellation policy trend in Garfield is Firm, used by 52.1% of listings.
- A majority (62.0%) of hosts in Garfield utilize Firm or Strict policies, indicating a market where hosts prioritize booking security.
- Strict cancellation policies are quite rare (9.9%), potentially making listings with this policy less competitive unless justified by high demand or property type.
Recommendations for Hosts
- Consider adopting a Firm policy to align with the 52.1% market standard in Garfield.
- Using a Strict policy might deter some guests, as only 9.9% of listings use it. Evaluate if potential revenue protection outweighs possible lower booking rates.
- Regularly review your cancellation policy against competitors and market demand shifts in Garfield.
Garfield STR Booking Lead Time Analysis (2026)
Average Booking Lead Time by Month
Booking Lead Time Insights for Garfield
- The overall average booking lead time for vacation rentals in Garfield is 56 days.
- Guests book furthest in advance for stays during July (average 75 days), likely coinciding with peak travel demand or local events.
- The shortest booking windows occur for stays in February (average 23 days), indicating more last-minute travel plans during this time.
- Seasonally, Summer (66 days avg.) sees the longest lead times, while Winter (36 days avg.) has the shortest, reflecting typical travel planning cycles.
Recommendations for Hosts
- Use the overall average lead time (56 days) as a baseline for your pricing and availability strategy in Garfield.
- For July stays, consider implementing length-of-stay discounts or slightly higher rates for bookings made less than 75 days out to capitalize on advance planning.
- Target marketing efforts for the Summer season well in advance (at least 66 days) to capture early planners.
- Monitor your own booking lead times against these Garfield averages to identify opportunities for dynamic pricing adjustments.
Popular & Essential Airbnb Amenities in Garfield (2026)
Amenity Prevalence
Amenity Insights for Garfield
- Essential amenities in Garfield that guests expect include: Air conditioning, TV, Free parking on premises, Coffee maker, Bed linens, Refrigerator, Smoke alarm, Hot water, Dishes and silverware, Microwave. Lacking these (any) could significantly impact bookings.
Recommendations for Hosts
- Ensure your listing includes all essential amenities for Garfield: Air conditioning, TV, Free parking on premises, Coffee maker, Bed linens, Refrigerator, Smoke alarm, Hot water, Dishes and silverware, Microwave.
- Prioritize adding missing essentials: TV, Free parking on premises, Coffee maker, Bed linens, Refrigerator, Smoke alarm, Hot water, Dishes and silverware, Microwave.
- Highlight unique or less common amenities you offer (e.g., hot tub, dedicated workspace, EV charger) in your listing description and photos.
- Regularly check competitor amenities in Garfield to stay competitive.
Garfield Airbnb Guest Demographics & Profile Analysis (2026)
Guest Profile Summary for Garfield
- The typical guest profile for Airbnb in Garfield consists of primarily domestic travelers (99%), often arriving from nearby Kansas City, typically belonging to the Post-2000s (Gen Z/Alpha) group (50%), primarily speaking English or Spanish.
- Domestic travelers account for 99.0% of guests.
- Key international markets include United States (99%) and United Kingdom (0.2%).
- Top languages spoken are English (77.9%) followed by Spanish (16%).
- A significant demographic segment is the Post-2000s (Gen Z/Alpha) group, representing 50% of guests.
Recommendations for Hosts
- Target domestic marketing efforts towards travelers from Kansas City and Houston.
- Tailor amenities and listing descriptions to appeal to the dominant Post-2000s (Gen Z/Alpha) demographic (e.g., highlight fast WiFi, smart home features, local guides).
- Highlight unique local experiences or amenities relevant to the primary guest profile.
- Consider seasonal promotions aligned with peak travel times for key origin markets.
Nearby Short-Term Rental Market Comparison
How does the Garfield Airbnb market stack up against its neighbors? Compare key performance metrics like average monthly revenue, ADR, and occupancy rates in surrounding areas to understand the broader regional STR landscape.
| Market | Active Properties | Monthly Revenue | Daily Rate | Avg. Occupancy |
|---|---|---|---|---|
| Blue Eye | 32 | $5,674 | $427.78 | 50% |
| Hollister | 317 | $4,744 | $431.85 | 42% |
| Omaha | 38 | $3,581 | $270.03 | 48% |
| Ridgedale | 121 | $3,353 | $429.21 | 38% |
| Flippin | 35 | $3,256 | $268.96 | 39% |
| Branson West | 267 | $3,068 | $246.89 | 43% |
| Little Flock | 17 | $2,955 | $370.27 | 40% |
| Lowell | 30 | $2,905 | $254.69 | 43% |
| Ponca | 40 | $2,893 | $371.63 | 31% |
| Kimberling City | 351 | $2,826 | $332.93 | 33% |