Fort Smith Airbnb Market Analysis 2026: Short Term Rental Data & Vacation Rental Statistics in Arkansas, United States
Is Airbnb profitable in Fort Smith in 2026? Explore comprehensive Airbnb analytics for Fort Smith, Arkansas, United States to uncover income potential. This 2026 STR market report for Fort Smith, based on AirROI data from February 2025 to January 2026, reveals key trends in the market of 208 active listings.
Whether you're considering an Airbnb investment in Fort Smith, optimizing your existing vacation rental, or exploring rental arbitrage opportunities, understanding the Fort Smith Airbnb data is crucial. Leveraging the low regulation environment is key to maximizing your short term rental income potential. Let's dive into the specifics.
Key Fort Smith Airbnb Performance Metrics Overview
Monthly Airbnb Revenue Variations & Income Potential in Fort Smith (2026)
Understanding the monthly revenue variations for Airbnb listings in Fort Smith is key to maximizing your short term rental income potential. Seasonality significantly impacts earnings. Our analysis, based on data from the past 12 months, shows that the peak revenue month for STRs in Fort Smith is typically July, while February often presents the lowest earnings, highlighting opportunities for strategic pricing adjustments during shoulder and low seasons. Explore the typical Airbnb income in Fort Smith across different performance tiers:
- Best-in-class properties (Top 10%) achieve $3,730+ monthly, often utilizing dynamic pricing and superior guest experiences.
- Strong performing properties (Top 25%) earn $2,384 or more, indicating effective management and desirable locations/amenities.
- Typical properties (Median) generate around $1,398 per month, representing the average market performance.
- Entry-level properties (Bottom 25%) see earnings around $715, often with potential for optimization.
Average Monthly Airbnb Earnings Trend in Fort Smith
Fort Smith Airbnb Occupancy Rate Trends (2026)
Maximize your bookings by understanding the Fort Smith STR occupancy trends. Seasonal demand shifts significantly influence how often properties are booked. Typically, Julysees the highest demand (peak season occupancy), while January experiences the lowest (low season). Effective strategies, like adjusting minimum stays or offering promotions, can boost occupancy during slower periods. Here's how different property tiers perform in Fort Smith:
- Best-in-class properties (Top 10%) achieve 75%+ occupancy, indicating high desirability and potentially optimized availability.
- Strong performing properties (Top 25%) maintain 56% or higher occupancy, suggesting good market fit and guest satisfaction.
- Typical properties (Median) have an occupancy rate around 38%.
- Entry-level properties (Bottom 25%) average 20% occupancy, potentially facing higher vacancy.
Average Monthly Occupancy Rate Trend in Fort Smith
Average Daily Rate (ADR) Airbnb Trends in Fort Smith (2026)
Effective short term rental pricing strategy in Fort Smith involves understanding monthly ADR fluctuations. The Average Daily Rate (ADR) for Airbnb in Fort Smith typically peaks in October and dips lowest during February. Leveraging Airbnb dynamic pricing tools or strategies based on this seasonality can significantly boost revenue. Here's a look at the typical nightly rates achieved:
- Best-in-class properties (Top 10%) command rates of $230+ per night, often due to premium features or locations.
- Strong performing properties (Top 25%) achieve nightly rates of $160 or more.
- Typical properties (Median) charge around $118 per night.
- Entry-level properties (Bottom 25%) earn around $90 per night.
Average Daily Rate (ADR) Trend by Month in Fort Smith
Get Live Fort Smith Market Intelligence 👇

Explore Real-time Analytics
Airbnb Seasonality Analysis & Trends in Fort Smith (2026)
Peak Season (July, June, May)
- Revenue averages $2,100 per month
- Occupancy rates average 44.4%
- Daily rates average $134
Shoulder Season
- Revenue averages $1,807 per month
- Occupancy maintains around 39.3%
- Daily rates hold near $140
Low Season (January, February, April)
- Revenue drops to average $1,460 per month
- Occupancy decreases to average 37.3%
- Daily rates adjust to average $127
Seasonality Insights for Fort Smith
- The Airbnb seasonality in Fort Smith shows moderate seasonality with distinct peak and low periods. While the sections above show seasonal averages, it's also insightful to look at the extremes:
- During the high season, the absolute peak month showcases Fort Smith's highest earning potential, with monthly revenues capable of climbing to $2,238, occupancy reaching a high of 46.5%, and ADRs peaking at $151.
- Conversely, the slowest single month of the year, typically falling within the low season, marks the market's lowest point. In this month, revenue might dip to $1,454, occupancy could drop to 34.0%, and ADRs may adjust down to $119.
- Understanding both the seasonal averages and these monthly peaks and troughs in revenue, occupancy, and ADR is crucial for maximizing your Airbnb profit potential in Fort Smith.
Seasonal Strategies for Maximizing Profit
- Peak Season: Maximize revenue through premium pricing and potentially longer minimum stays. Ensure high availability.
- Low Season: Offer competitive pricing, special promotions (e.g., extended stay discounts), and flexible cancellation policies. Target off-season travelers like remote workers or budget-conscious guests.
- Shoulder Seasons: Implement dynamic pricing that balances peak and low rates. Target weekend travelers or specific events. Offer slightly more flexible terms than peak season.
- Regularly analyze your own performance against these Fort Smith seasonality benchmarks and adjust your pricing and availability strategy accordingly.
Best Areas for Airbnb Investment in Fort Smith (2026)
Exploring the top neighborhoods for short-term rentals in Fort Smith? This section highlights key areas, outlining why they are attractive for hosts and guests, along with notable local attractions. Consider these locations based on your target guest profile and investment strategy.
| Neighborhood / Area | Why Host Here? (Target Guests & Appeal) | Key Attractions & Landmarks |
|---|---|---|
| Downtown Fort Smith | The central business district with a mix of historical and modern attractions. Offers easy access to restaurants, bars, and local events. | Fort Smith Museum of History, Riverfront Park, The Majestic Hotel, The Blue Lion, Fort Smith National Historic Site |
| Belle Grove Historic District | A charming neighborhood known for its well-preserved historic homes and unique character. Attracts guests interested in history and architecture. | Belle Grove Historic District, Garrison Avenue, The Fort Smith Convention Center, Local artisan shops |
| Chaffee Crossing | A rapidly developing area with a mix of residential and commercial opportunities. Attractive for those seeking modern amenities and outdoor activities. | Chaffee Crossing Historic District, Fort Chaffee Military Museum, Parks and trails, Local breweries and restaurants |
| The Riverfront | An area along the Arkansas River with parks and scenic views, perfect for outdoor enthusiasts. Hosts events and festivals that draw visitors. | Riverfront Park, Parkview Park, Fort Smith Farmers Market, Arkansas River Parks Trail |
| West Side | A suburban neighborhood with family-friendly amenities and a variety of dining options. Ideal for longer stays and family travelers. | The Mall at Fort Smith, Various parks, Local markets and shops |
| Fianna Hills | An upscale residential area with golf courses and stunning landscapes. Appeals to guests looking for a quiet retreat. | Fianna Hills Country Club, Coker-Harris Trail, Local nature parks |
| Rogers Avenue | A bustling area with shopping, dining, and easy access to major highways. Great for guests who want convenience and variety. | Shopping centers, Restaurants, Local entertainment venues |
| Historic Downtown | Renowned for its vintage shops, art galleries, and cultural events. Attracts those interested in the local arts scene. | Art galleries, The Fort Smith Regional Art Museum, Local music venues, Cultural festivals |
Understanding Airbnb License Requirements & STR Laws in Fort Smith (2026)
While Fort Smith, Arkansas, United States currently shows low STR regulations, specific Airbnb license requirements might still exist or change. Always verify the latest short term rental regulations and Airbnb license requirements directly with local government authorities for Fort Smith to ensure full compliance before hosting.
(Source: AirROI data, 2026, based on 0% licensed listings)
Top Performing Airbnb Properties in Fort Smith (2026)
Benchmark your potential! Explore examples of top-performing Airbnb properties in Fort Smithbased on Trailing Twelve Month (TTM) revenue. Analyze their characteristics, revenue, occupancy rate, and ADR to understand what drives success in this market.
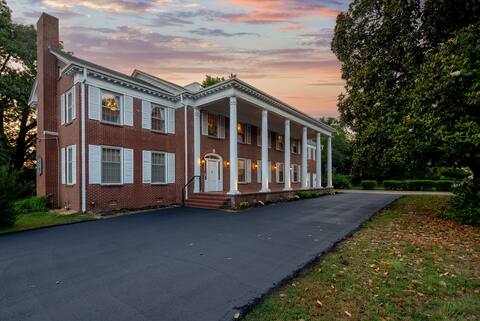
Beland Mansion Getaway–Colonial w/ Game Room
Entire Place • 6 bedrooms

Fort Smith | Nurses, Ebbing, TDY | Furnished 4 BR
Entire Place • 4 bedrooms
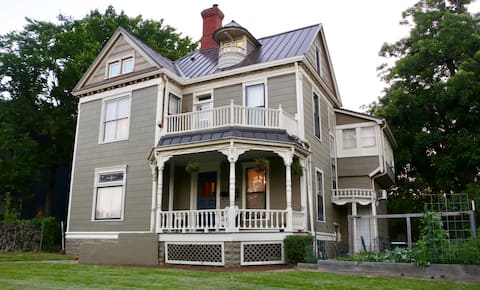
Anderson House-1885 Victorian/Grand Piano/Downtown
Entire Place • 5 bedrooms

River View Retreat
Entire Place • 3 bedrooms

Hot Tub in Fully-Loaded 2bd+2bth Home
Entire Place • 2 bedrooms

Ney House - 1890 Colonial/Downtown/Sleeps 18
Entire Place • 6 bedrooms
Note: Performance varies based on location, size, amenities, seasonality, and management quality. Data reflects the past 12 months.
Top Performing Airbnb Hosts in Fort Smith (2026)
Learn from the best! This table showcases top-performing Airbnb hosts in Fort Smith based on the number of properties managed and estimated total revenue over the past year. Analyze their scale and performance metrics.
| Host Name | Properties | Grossing Revenue | Stay Reviews | Avg Rating |
|---|---|---|---|---|
| Rebekah | 24 | $552,494 | 3189 | 4.89/5.0 |
| Ryan | 7 | $154,687 | 211 | 4.96/5.0 |
| Luis | 7 | $126,329 | 461 | 4.94/5.0 |
| Heidi | 4 | $95,236 | 267 | 4.89/5.0 |
| Tim | 10 | $81,289 | 987 | 4.86/5.0 |
| Laura | 3 | $81,062 | 53 | 4.98/5.0 |
| Rob And Melissa | 7 | $80,126 | 1861 | 4.80/5.0 |
| Sydney | 5 | $79,557 | 292 | 4.90/5.0 |
| David | 4 | $76,999 | 459 | 4.92/5.0 |
| Todd | 1 | $70,794 | 51 | 4.94/5.0 |
Analyzing the strategies of top hosts, such as their property selection, pricing, and guest communication, can offer valuable lessons for optimizing your own Airbnb operations in Fort Smith.
Dive Deeper: Advanced Fort Smith STR Market Data (2026)
Ready to unlock more insights? AirROI provides access to advanced metrics and comprehensive Airbnb data for Fort Smith. Explore detailed analytics beyond this report to refine your investment strategy, optimize pricing, and maximize your vacation rental profits.
Explore Advanced MetricsFort Smith Short-Term Rental Market Composition (2026): Property & Room Types
Room Type Distribution
Property Type Distribution
Market Composition Insights for Fort Smith
- The Fort Smith Airbnb market composition is heavily skewed towards Entire Home/Apt listings, which make up 92.3% of the 208 active rentals. This indicates strong guest preference for privacy and space.
- Looking at the property type distribution in Fort Smith, House properties are the most common (73.6%), reflecting the local real estate landscape.
- Houses represent a significant 73.6% portion, catering likely to families or larger groups.
- Smaller segments like hotel/boutique, unique stays, others (combined 3.4%) offer potential for unique stay experiences.
Fort Smith Airbnb Room Capacity Analysis (2026): Bedroom Distribution
Distribution of Listings by Number of Bedrooms
Room Capacity Insights for Fort Smith
- The dominant room capacity in Fort Smith is 2 bedrooms listings, making up 30.8% of the market. This suggests a strong demand for properties suitable for couples or solo travelers.
- Together, 2 bedrooms and 3 bedrooms properties represent 58.7% of the active Airbnb listings in Fort Smith, indicating a high concentration in these sizes.
- A significant 42.3% of listings offer 3+ bedrooms, catering to larger groups and families seeking more space in Fort Smith.
Fort Smith Vacation Rental Guest Capacity Trends (2026)
Distribution of Listings by Guest Capacity
Guest Capacity Insights for Fort Smith
- The most common guest capacity trend in Fort Smith vacation rentals is listings accommodating 6 guests (23.6%). This suggests the primary traveler segment is likely larger groups.
- Properties designed for 6 guests and 8+ guests dominate the Fort Smith STR market, accounting for 46.7% of listings.
- 50.5% of properties accommodate 6+ guests, serving the market segment for larger families or group travel in Fort Smith.
- On average, properties in Fort Smith are equipped to host 5.1 guests.
Fort Smith Airbnb Booking Patterns (2026): Available vs. Booked Days
Available Days Distribution
Booked Days Distribution
Booking Pattern Insights for Fort Smith
- The most common availability pattern in Fort Smith falls within the 271-366 days range, representing 43.8% of listings. This suggests many properties have significant open periods on their calendars.
- Approximately 82.7% of listings show high availability (181+ days open annually), indicating potential for increased bookings or specific owner usage patterns.
- For booked days, the 91-180 days range is most frequent in Fort Smith (38.9%), reflecting common guest stay durations or potential owner blocking patterns.
- A notable 18.7% of properties secure long booking periods (181+ days booked per year), highlighting successful long-term rental strategies or significant owner usage.
Fort Smith Airbnb Minimum Stay Requirements Analysis
Distribution of Listings by Minimum Night Requirement
1 Night
124 listings
59.6% of total
2 Nights
38 listings
18.3% of total
3 Nights
5 listings
2.4% of total
4-6 Nights
8 listings
3.8% of total
7-29 Nights
3 listings
1.4% of total
30+ Nights
30 listings
14.4% of total
Key Insights
- The most prevalent minimum stay requirement in Fort Smith is 1 Night, adopted by 59.6% of listings. This highlights the market's preference for shorter, flexible bookings.
- A strong majority (77.9%) of the Fort Smith Airbnb data shows acceptance of very short stays (1-2 nights), indicating a dynamic, high-turnover market.
- A significant segment (14.4%) caters to monthly stays (30+ nights) in Fort Smith, pointing to opportunities in the extended-stay market.
Recommendations
- Align with the market by considering a 1 Night minimum stay, as 59.6% of Fort Smith hosts use this setting.
- Explore offering discounts for stays of 30+ nights to attract the 14.4% of the market seeking extended stays.
- Adjust minimum nights based on seasonality – potentially shorter during low season and longer during peak demand periods in Fort Smith.
Fort Smith Airbnb Cancellation Policy Trends Analysis (2026)
Limited
1 listings
0.5% of total
Flexible
92 listings
44.2% of total
Moderate
50 listings
24% of total
Firm
53 listings
25.5% of total
Strict
12 listings
5.8% of total
Cancellation Policy Insights for Fort Smith
- The prevailing Airbnb cancellation policy trend in Fort Smith is Flexible, used by 44.2% of listings.
- There's a relatively balanced mix between guest-friendly (68.2%) and stricter (31.3%) policies, offering choices for different guest needs.
- Strict cancellation policies are quite rare (5.8%), potentially making listings with this policy less competitive unless justified by high demand or property type.
Recommendations for Hosts
- Consider adopting a Flexible policy to align with the 44.2% market standard in Fort Smith.
- Using a Strict policy might deter some guests, as only 5.8% of listings use it. Evaluate if potential revenue protection outweighs possible lower booking rates.
- Regularly review your cancellation policy against competitors and market demand shifts in Fort Smith.
Fort Smith STR Booking Lead Time Analysis (2026)
Average Booking Lead Time by Month
Booking Lead Time Insights for Fort Smith
- The overall average booking lead time for vacation rentals in Fort Smith is 24 days.
- Guests book furthest in advance for stays during May (average 38 days), likely coinciding with peak travel demand or local events.
- The shortest booking windows occur for stays in February (average 11 days), indicating more last-minute travel plans during this time.
- Seasonally, Fall (30 days avg.) sees the longest lead times, while Winter (17 days avg.) has the shortest, reflecting typical travel planning cycles.
Recommendations for Hosts
- Use the overall average lead time (24 days) as a baseline for your pricing and availability strategy in Fort Smith.
- For May stays, consider implementing length-of-stay discounts or slightly higher rates for bookings made less than 38 days out to capitalize on advance planning.
- During February, focus on last-minute booking availability and promotions, as guests book with very short notice (11 days avg.).
- Target marketing efforts for the Fall season well in advance (at least 30 days) to capture early planners.
- Monitor your own booking lead times against these Fort Smith averages to identify opportunities for dynamic pricing adjustments.
Popular & Essential Airbnb Amenities in Fort Smith (2026)
Amenity Prevalence
Amenity Insights for Fort Smith
- Essential amenities in Fort Smith that guests expect include: Wifi, Air conditioning, TV, Free parking on premises, Smoke alarm. Lacking these (any) could significantly impact bookings.
- Popular amenities like Kitchen, Heating, Hot water are common but not universal. Offering these can provide a competitive edge.
Recommendations for Hosts
- Ensure your listing includes all essential amenities for Fort Smith: Wifi, Air conditioning, TV, Free parking on premises, Smoke alarm.
- Prioritize adding missing essentials: Wifi, Air conditioning, TV, Free parking on premises, Smoke alarm.
- Consider adding popular differentiators like Kitchen or Heating to increase appeal.
- Highlight unique or less common amenities you offer (e.g., hot tub, dedicated workspace, EV charger) in your listing description and photos.
- Regularly check competitor amenities in Fort Smith to stay competitive.
Fort Smith Airbnb Guest Demographics & Profile Analysis (2026)
Guest Profile Summary for Fort Smith
- The typical guest profile for Airbnb in Fort Smith consists of primarily domestic travelers (98%), often arriving from nearby Fort Smith, typically belonging to the Post-2000s (Gen Z/Alpha) group (50%), primarily speaking English or Spanish.
- Domestic travelers account for 97.6% of guests.
- Key international markets include United States (97.6%) and United Kingdom (0.6%).
- Top languages spoken are English (76.1%) followed by Spanish (11.8%).
- A significant demographic segment is the Post-2000s (Gen Z/Alpha) group, representing 50% of guests.
Recommendations for Hosts
- Target domestic marketing efforts towards travelers from Fort Smith and Tulsa.
- Tailor amenities and listing descriptions to appeal to the dominant Post-2000s (Gen Z/Alpha) demographic (e.g., highlight fast WiFi, smart home features, local guides).
- Highlight unique local experiences or amenities relevant to the primary guest profile.
- Consider seasonal promotions aligned with peak travel times for key origin markets.
Nearby Short-Term Rental Market Comparison
How does the Fort Smith Airbnb market stack up against its neighbors? Compare key performance metrics like average monthly revenue, ADR, and occupancy rates in surrounding areas to understand the broader regional STR landscape.
| Market | Active Properties | Monthly Revenue | Daily Rate | Avg. Occupancy |
|---|---|---|---|---|
| Rockwell | 13 | $7,988 | $554.32 | 46% |
| Blue Eye | 32 | $5,674 | $427.78 | 50% |
| McCurtain County | 85 | $5,126 | $519.27 | 35% |
| Hollister | 317 | $4,744 | $431.85 | 42% |
| Broken Bow | 2,882 | $4,449 | $430.98 | 37% |
| Hochatown | 17 | $3,781 | $398.64 | 33% |
| Wilburton | 16 | $3,710 | $294.70 | 39% |
| Omaha | 38 | $3,581 | $270.03 | 48% |
| Piney | 24 | $3,392 | $419.30 | 28% |
| Ridgedale | 121 | $3,353 | $429.21 | 38% |