Bismarck Airbnb Market Analysis 2026: Short Term Rental Data & Vacation Rental Statistics in Arkansas, United States
Is Airbnb profitable in Bismarck in 2026? Explore comprehensive Airbnb analytics for Bismarck, Arkansas, United States to uncover income potential. This 2026 STR market report for Bismarck, based on AirROI data from February 2025 to January 2026, reveals key trends in the niche market of 37 active listings.
Whether you're considering an Airbnb investment in Bismarck, optimizing your existing vacation rental, or exploring rental arbitrage opportunities, understanding the Bismarck Airbnb data is crucial. Leveraging the low regulation environment is key to maximizing your short term rental income potential. Let's dive into the specifics.
Key Bismarck Airbnb Performance Metrics Overview
Monthly Airbnb Revenue Variations & Income Potential in Bismarck (2026)
Understanding the monthly revenue variations for Airbnb listings in Bismarck is key to maximizing your short term rental income potential. Seasonality significantly impacts earnings. Our analysis, based on data from the past 12 months, shows that the peak revenue month for STRs in Bismarck is typically July, while January often presents the lowest earnings, highlighting opportunities for strategic pricing adjustments during shoulder and low seasons. Explore the typical Airbnb income in Bismarck across different performance tiers:
- Best-in-class properties (Top 10%) achieve $5,201+ monthly, often utilizing dynamic pricing and superior guest experiences.
- Strong performing properties (Top 25%) earn $3,151 or more, indicating effective management and desirable locations/amenities.
- Typical properties (Median) generate around $1,946 per month, representing the average market performance.
- Entry-level properties (Bottom 25%) see earnings around $1,158, often with potential for optimization.
Average Monthly Airbnb Earnings Trend in Bismarck
Bismarck Airbnb Occupancy Rate Trends (2026)
Maximize your bookings by understanding the Bismarck STR occupancy trends. Seasonal demand shifts significantly influence how often properties are booked. Typically, Octobersees the highest demand (peak season occupancy), while January experiences the lowest (low season). Effective strategies, like adjusting minimum stays or offering promotions, can boost occupancy during slower periods. Here's how different property tiers perform in Bismarck:
- Best-in-class properties (Top 10%) achieve 68%+ occupancy, indicating high desirability and potentially optimized availability.
- Strong performing properties (Top 25%) maintain 51% or higher occupancy, suggesting good market fit and guest satisfaction.
- Typical properties (Median) have an occupancy rate around 35%.
- Entry-level properties (Bottom 25%) average 20% occupancy, potentially facing higher vacancy.
Average Monthly Occupancy Rate Trend in Bismarck
Average Daily Rate (ADR) Airbnb Trends in Bismarck (2026)
Effective short term rental pricing strategy in Bismarck involves understanding monthly ADR fluctuations. The Average Daily Rate (ADR) for Airbnb in Bismarck typically peaks in September and dips lowest during February. Leveraging Airbnb dynamic pricing tools or strategies based on this seasonality can significantly boost revenue. Here's a look at the typical nightly rates achieved:
- Best-in-class properties (Top 10%) command rates of $426+ per night, often due to premium features or locations.
- Strong performing properties (Top 25%) achieve nightly rates of $248 or more.
- Typical properties (Median) charge around $187 per night.
- Entry-level properties (Bottom 25%) earn around $155 per night.
Average Daily Rate (ADR) Trend by Month in Bismarck
Get Live Bismarck Market Intelligence 👇

Explore Real-time Analytics
Airbnb Seasonality Analysis & Trends in Bismarck (2026)
Peak Season (July, October, August)
- Revenue averages $3,337 per month
- Occupancy rates average 42.7%
- Daily rates average $262
Shoulder Season
- Revenue averages $2,481 per month
- Occupancy maintains around 38.1%
- Daily rates hold near $253
Low Season (January, April, September)
- Revenue drops to average $1,833 per month
- Occupancy decreases to average 31.9%
- Daily rates adjust to average $253
Seasonality Insights for Bismarck
- The Airbnb seasonality in Bismarck shows highly seasonal trends requiring careful strategy. While the sections above show seasonal averages, it's also insightful to look at the extremes:
- During the high season, the absolute peak month showcases Bismarck's highest earning potential, with monthly revenues capable of climbing to $3,799, occupancy reaching a high of 49.9%, and ADRs peaking at $267.
- Conversely, the slowest single month of the year, typically falling within the low season, marks the market's lowest point. In this month, revenue might dip to $1,649, occupancy could drop to 27.4%, and ADRs may adjust down to $237.
- Understanding both the seasonal averages and these monthly peaks and troughs in revenue, occupancy, and ADR is crucial for maximizing your Airbnb profit potential in Bismarck.
Seasonal Strategies for Maximizing Profit
- Peak Season: Maximize revenue through premium pricing and potentially longer minimum stays. Ensure high availability.
- Low Season: Offer competitive pricing, special promotions (e.g., extended stay discounts), and flexible cancellation policies. Target off-season travelers like remote workers or budget-conscious guests.
- Shoulder Seasons: Implement dynamic pricing that balances peak and low rates. Target weekend travelers or specific events. Offer slightly more flexible terms than peak season.
- Regularly analyze your own performance against these Bismarck seasonality benchmarks and adjust your pricing and availability strategy accordingly.
Best Areas for Airbnb Investment in Bismarck (2026)
Exploring the top neighborhoods for short-term rentals in Bismarck? This section highlights key areas, outlining why they are attractive for hosts and guests, along with notable local attractions. Consider these locations based on your target guest profile and investment strategy.
| Neighborhood / Area | Why Host Here? (Target Guests & Appeal) | Key Attractions & Landmarks |
|---|---|---|
| Downtown Bismarck | The heart of Bismarck, featuring local businesses and restaurants. A prime area for visitors wanting to explore the city’s culture and history. | North Dakota State Capitol, Bismarck Arts & Galleries Association, Supreme Court of North Dakota, Lewis and Clark Riverboat, Bismarck Event Center |
| Lake Sakakawea | A popular recreational area offering outdoor activities such as fishing, boating, and hiking. Perfect for those looking for a scenic retreat. | Lake Sakakawea State Park, Fort Stevenson State Park, Fishing and boating opportunities, Hiking trails, Picnic areas and scenic views |
| River Road | Located along the Missouri River, this area offers beautiful views and outdoor amenities. Ideal for nature lovers and those wanting a peaceful retreat. | Missouri River, Parks and walking trails, Scenic views, Fishing, Close to recreational activities |
| Historic Fort Lincoln | A historic site that attracts visitors interested in the area's rich history and pioneer heritage. Offers unique lodging opportunities. | Fort Lincoln State Park, General Custer House, Historic ceremonies and events, Reenactments |
| Dickinson | A growing city in the Bakken region, attracting visitors for business and energy sector opportunities. A mix of urban and rural environments. | Dakota Dinosaur Museum, Dickinson Museum Center, The Prairie Hills mall, Outdoor activities |
| Kirkwood Mall | This area hosts one of the largest shopping malls in the region, attracting tourists and locals alike. Good for short stays during shopping trips. | Kirkwood Mall shops, Restaurants, Entertainment options |
| The Hills of Bismarck | A residential area known for its peaceful neighborhoods and family-friendly environment. Great for long-term rentals and families visiting. | Scenic views, Parks, Family amenities |
| Bismarck-Mandan | Combined areas that include both cities, offering a mix of culture and community. Attractive for families and tourists alike with ample activities. | Mandan's Historic Downtown, Riverwalk, Local festivals and events |
Understanding Airbnb License Requirements & STR Laws in Bismarck (2026)
While Bismarck, Arkansas, United States currently shows low STR regulations, specific Airbnb license requirements might still exist or change. Always verify the latest short term rental regulations and Airbnb license requirements directly with local government authorities for Bismarck to ensure full compliance before hosting.
(Source: AirROI data, 2026, finding no licensed listings among those analyzed)
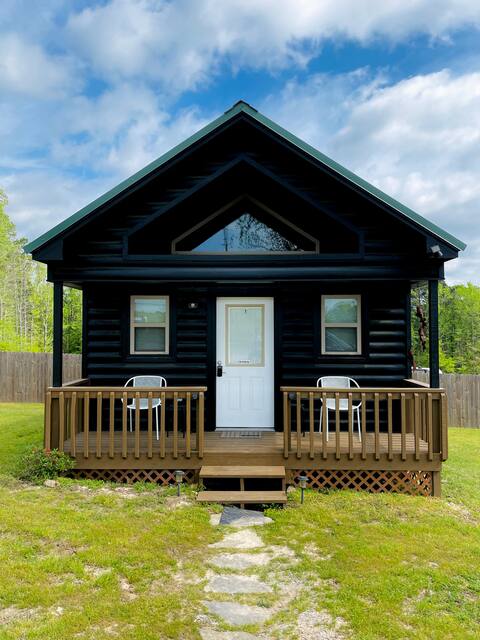
Top Performing Airbnb Properties in Bismarck (2026)
Benchmark your potential! Explore examples of top-performing Airbnb properties in Bismarckbased on Trailing Twelve Month (TTM) revenue. Analyze their characteristics, revenue, occupancy rate, and ADR to understand what drives success in this market.
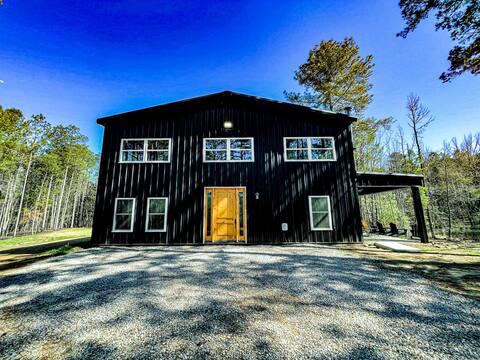
Black Pearl Lodge @ DeGray
Entire Place • 3 bedrooms

Tree Loft at Jack Mountain
Entire Place • 1 bedroom

Antlers at DeGray (Villa de Hot Springs)
Entire Place • 5 bedrooms

The Bored Doe • 1 mi to DeGray Lake
Entire Place • 2 bedrooms
Cabin #1•1 mile to DeGray Lake
Entire Place • 1 bedroom

All 3 Cabins • 1 Mile to DeGray
Entire Place • 6 bedrooms
Note: Performance varies based on location, size, amenities, seasonality, and management quality. Data reflects the past 12 months.
Top Performing Airbnb Hosts in Bismarck (2026)
Learn from the best! This table showcases top-performing Airbnb hosts in Bismarck based on the number of properties managed and estimated total revenue over the past year. Analyze their scale and performance metrics.
| Host Name | Properties | Grossing Revenue | Stay Reviews | Avg Rating |
|---|---|---|---|---|
| Mandi | 6 | $282,791 | 193 | 4.94/5.0 |
| Brooklyn | 6 | $131,390 | 40 | 4.92/5.0 |
| Aaron | 2 | $100,821 | 438 | 4.93/5.0 |
| Gabe And Dawn | 3 | $78,156 | 517 | 4.99/5.0 |
| Ash Heda | 1 | $59,728 | 20 | 5.00/5.0 |
| Evolve | 2 | $46,439 | 71 | 4.83/5.0 |
| Andrea | 2 | $32,036 | 115 | 4.82/5.0 |
| Katie | 2 | $31,858 | 100 | 4.93/5.0 |
| Callie | 1 | $27,013 | 77 | 4.99/5.0 |
| Tiffany | 3 | $25,135 | 13 | 4.94/5.0 |
Analyzing the strategies of top hosts, such as their property selection, pricing, and guest communication, can offer valuable lessons for optimizing your own Airbnb operations in Bismarck.
Dive Deeper: Advanced Bismarck STR Market Data (2026)
Ready to unlock more insights? AirROI provides access to advanced metrics and comprehensive Airbnb data for Bismarck. Explore detailed analytics beyond this report to refine your investment strategy, optimize pricing, and maximize your vacation rental profits.
Explore Advanced MetricsBismarck Short-Term Rental Market Composition (2026): Property & Room Types
Room Type Distribution
Property Type Distribution
Market Composition Insights for Bismarck
- The Bismarck Airbnb market composition is heavily skewed towards Entire Home/Apt listings, which make up 91.9% of the 37 active rentals. This indicates strong guest preference for privacy and space.
- Looking at the property type distribution in Bismarck, Outdoor/Unique properties are the most common (51.4%), reflecting the local real estate landscape.
- Houses represent a significant 32.4% portion, catering likely to families or larger groups.
- The presence of 10.8% Hotel/Boutique listings indicates integration with traditional hospitality.
Bismarck Airbnb Room Capacity Analysis (2026): Bedroom Distribution
Distribution of Listings by Number of Bedrooms
Room Capacity Insights for Bismarck
- The dominant room capacity in Bismarck is 1 bedroom listings, making up 43.2% of the market. This suggests a strong demand for properties suitable for couples or solo travelers.
- Together, 1 bedroom and 2 bedrooms properties represent 64.8% of the active Airbnb listings in Bismarck, indicating a high concentration in these sizes.
- A significant 27.0% of listings offer 3+ bedrooms, catering to larger groups and families seeking more space in Bismarck.
Bismarck Vacation Rental Guest Capacity Trends (2026)
Distribution of Listings by Guest Capacity
Guest Capacity Insights for Bismarck
- The most common guest capacity trend in Bismarck vacation rentals is listings accommodating 8+ guests (29.7%). This suggests the primary traveler segment is likely larger groups.
- Properties designed for 8+ guests and 6 guests dominate the Bismarck STR market, accounting for 51.3% of listings.
- 54.0% of properties accommodate 6+ guests, serving the market segment for larger families or group travel in Bismarck.
- On average, properties in Bismarck are equipped to host 4.9 guests.
Bismarck Airbnb Booking Patterns (2026): Available vs. Booked Days
Available Days Distribution
Booked Days Distribution
Booking Pattern Insights for Bismarck
- The most common availability pattern in Bismarck falls within the 271-366 days range, representing 48.6% of listings. This suggests many properties have significant open periods on their calendars.
- Approximately 83.7% of listings show high availability (181+ days open annually), indicating potential for increased bookings or specific owner usage patterns.
- For booked days, the 31-90 days range is most frequent in Bismarck (37.8%), reflecting common guest stay durations or potential owner blocking patterns.
- A notable 16.2% of properties secure long booking periods (181+ days booked per year), highlighting successful long-term rental strategies or significant owner usage.
Bismarck Airbnb Minimum Stay Requirements Analysis
Distribution of Listings by Minimum Night Requirement
1 Night
4 listings
10.8% of total
2 Nights
29 listings
78.4% of total
30+ Nights
4 listings
10.8% of total
Key Insights
- The most prevalent minimum stay requirement in Bismarck is 2 Nights, adopted by 78.4% of listings. This highlights the market's preference for shorter, flexible bookings.
- A strong majority (89.2%) of the Bismarck Airbnb data shows acceptance of very short stays (1-2 nights), indicating a dynamic, high-turnover market.
- A significant segment (10.8%) caters to monthly stays (30+ nights) in Bismarck, pointing to opportunities in the extended-stay market.
Recommendations
- Align with the market by considering a 2 Nights minimum stay, as 78.4% of Bismarck hosts use this setting.
- If feasible, allowing 1-night stays, especially midweek or during low season, could capture last-minute bookings, as only 10.8% currently do.
- A 2-night minimum appears standard (78.4%). Consider this for weekends or peak periods.
- Explore offering discounts for stays of 30+ nights to attract the 10.8% of the market seeking extended stays.
- Adjust minimum nights based on seasonality – potentially shorter during low season and longer during peak demand periods in Bismarck.
Bismarck Airbnb Cancellation Policy Trends Analysis (2026)
Flexible
4 listings
10.8% of total
Moderate
9 listings
24.3% of total
Firm
18 listings
48.6% of total
Strict
6 listings
16.2% of total
Cancellation Policy Insights for Bismarck
- The prevailing Airbnb cancellation policy trend in Bismarck is Firm, used by 48.6% of listings.
- A majority (64.8%) of hosts in Bismarck utilize Firm or Strict policies, indicating a market where hosts prioritize booking security.
Recommendations for Hosts
- Consider adopting a Firm policy to align with the 48.6% market standard in Bismarck.
- Regularly review your cancellation policy against competitors and market demand shifts in Bismarck.
Bismarck STR Booking Lead Time Analysis (2026)
Average Booking Lead Time by Month
Booking Lead Time Insights for Bismarck
- The overall average booking lead time for vacation rentals in Bismarck is 47 days.
- Guests book furthest in advance for stays during November (average 61 days), likely coinciding with peak travel demand or local events.
- The shortest booking windows occur for stays in January (average 18 days), indicating more last-minute travel plans during this time.
- Seasonally, Summer (45 days avg.) sees the longest lead times, while Winter (36 days avg.) has the shortest, reflecting typical travel planning cycles.
Recommendations for Hosts
- Use the overall average lead time (47 days) as a baseline for your pricing and availability strategy in Bismarck.
- For November stays, consider implementing length-of-stay discounts or slightly higher rates for bookings made less than 61 days out to capitalize on advance planning.
- Target marketing efforts for the Summer season well in advance (at least 45 days) to capture early planners.
- Monitor your own booking lead times against these Bismarck averages to identify opportunities for dynamic pricing adjustments.
Popular & Essential Airbnb Amenities in Bismarck (2026)
Amenity Prevalence
Amenity Insights for Bismarck
- Essential amenities in Bismarck that guests expect include: Air conditioning, Heating, Wifi. Lacking these (any) could significantly impact bookings.
- Popular amenities like Smoke alarm, Fire extinguisher, TV are common but not universal. Offering these can provide a competitive edge.
Recommendations for Hosts
- Ensure your listing includes all essential amenities for Bismarck: Air conditioning, Heating, Wifi.
- Prioritize adding missing essentials: Wifi.
- Consider adding popular differentiators like Smoke alarm or Fire extinguisher to increase appeal.
- Highlight unique or less common amenities you offer (e.g., hot tub, dedicated workspace, EV charger) in your listing description and photos.
- Regularly check competitor amenities in Bismarck to stay competitive.
Bismarck Airbnb Guest Demographics & Profile Analysis (2026)
Guest Profile Summary for Bismarck
- The typical guest profile for Airbnb in Bismarck consists of primarily domestic travelers (99%), often arriving from nearby Houston, typically belonging to the Post-2000s (Gen Z/Alpha) group (50%), primarily speaking English or Spanish.
- Domestic travelers account for 99.4% of guests.
- Key international markets include United States (99.4%) and Australia (0.6%).
- Top languages spoken are English (92.2%) followed by Spanish (5.2%).
- A significant demographic segment is the Post-2000s (Gen Z/Alpha) group, representing 50% of guests.
Recommendations for Hosts
- Target domestic marketing efforts towards travelers from Houston and Dallas.
- Tailor amenities and listing descriptions to appeal to the dominant Post-2000s (Gen Z/Alpha) demographic (e.g., highlight fast WiFi, smart home features, local guides).
- Highlight unique local experiences or amenities relevant to the primary guest profile.
- Consider seasonal promotions aligned with peak travel times for key origin markets.
Nearby Short-Term Rental Market Comparison
How does the Bismarck Airbnb market stack up against its neighbors? Compare key performance metrics like average monthly revenue, ADR, and occupancy rates in surrounding areas to understand the broader regional STR landscape.
| Market | Active Properties | Monthly Revenue | Daily Rate | Avg. Occupancy |
|---|---|---|---|---|
| Rockwell | 13 | $7,988 | $554.32 | 46% |
| McCurtain County | 85 | $5,126 | $519.27 | 35% |
| Broken Bow | 2,882 | $4,449 | $430.98 | 37% |
| Hochatown | 17 | $3,781 | $398.64 | 33% |
| Piney | 24 | $3,392 | $419.30 | 28% |
| Lake Hamilton | 77 | $3,228 | $328.72 | 34% |
| Garland County | 112 | $2,994 | $306.01 | 37% |
| Glenwood | 46 | $2,825 | $334.42 | 33% |
| Royal | 99 | $2,723 | $299.88 | 34% |
| Fountain Lake | 10 | $2,710 | $258.81 | 39% |