Big Rock Township Airbnb Market Analysis 2026: Short Term Rental Data & Vacation Rental Statistics in Arkansas, United States
Is Airbnb profitable in Big Rock Township in 2026? Explore comprehensive Airbnb analytics for Big Rock Township, Arkansas, United States to uncover income potential. This 2026 STR market report for Big Rock Township, based on AirROI data from February 2025 to January 2026, reveals key trends in the niche market of 19 active listings.
Whether you're considering an Airbnb investment in Big Rock Township, optimizing your existing vacation rental, or exploring rental arbitrage opportunities, understanding the Big Rock Township Airbnb data is crucial. Leveraging the low regulation environment is key to maximizing your short term rental income potential. Let's dive into the specifics.
Key Big Rock Township Airbnb Performance Metrics Overview
Monthly Airbnb Revenue Variations & Income Potential in Big Rock Township (2026)
Understanding the monthly revenue variations for Airbnb listings in Big Rock Township is key to maximizing your short term rental income potential. Seasonality significantly impacts earnings. Our analysis, based on data from the past 12 months, shows that the peak revenue month for STRs in Big Rock Township is typically October, while January often presents the lowest earnings, highlighting opportunities for strategic pricing adjustments during shoulder and low seasons. Explore the typical Airbnb income in Big Rock Township across different performance tiers:
- Best-in-class properties (Top 10%) achieve $5,444+ monthly, often utilizing dynamic pricing and superior guest experiences.
- Strong performing properties (Top 25%) earn $3,749 or more, indicating effective management and desirable locations/amenities.
- Typical properties (Median) generate around $2,158 per month, representing the average market performance.
- Entry-level properties (Bottom 25%) see earnings around $1,179, often with potential for optimization.
Average Monthly Airbnb Earnings Trend in Big Rock Township
Big Rock Township Airbnb Occupancy Rate Trends (2026)
Maximize your bookings by understanding the Big Rock Township STR occupancy trends. Seasonal demand shifts significantly influence how often properties are booked. Typically, Octobersees the highest demand (peak season occupancy), while January experiences the lowest (low season). Effective strategies, like adjusting minimum stays or offering promotions, can boost occupancy during slower periods. Here's how different property tiers perform in Big Rock Township:
- Best-in-class properties (Top 10%) achieve 78%+ occupancy, indicating high desirability and potentially optimized availability.
- Strong performing properties (Top 25%) maintain 65% or higher occupancy, suggesting good market fit and guest satisfaction.
- Typical properties (Median) have an occupancy rate around 45%.
- Entry-level properties (Bottom 25%) average 30% occupancy, potentially facing higher vacancy.
Average Monthly Occupancy Rate Trend in Big Rock Township
Average Daily Rate (ADR) Airbnb Trends in Big Rock Township (2026)
Effective short term rental pricing strategy in Big Rock Township involves understanding monthly ADR fluctuations. The Average Daily Rate (ADR) for Airbnb in Big Rock Township typically peaks in December and dips lowest during February. Leveraging Airbnb dynamic pricing tools or strategies based on this seasonality can significantly boost revenue. Here's a look at the typical nightly rates achieved:
- Best-in-class properties (Top 10%) command rates of $268+ per night, often due to premium features or locations.
- Strong performing properties (Top 25%) achieve nightly rates of $198 or more.
- Typical properties (Median) charge around $158 per night.
- Entry-level properties (Bottom 25%) earn around $94 per night.
Average Daily Rate (ADR) Trend by Month in Big Rock Township
Get Live Big Rock Township Market Intelligence 👇

Explore Real-time Analytics
Airbnb Seasonality Analysis & Trends in Big Rock Township (2026)
Peak Season (October, November, December)
- Revenue averages $3,930 per month
- Occupancy rates average 57.1%
- Daily rates average $193
Shoulder Season
- Revenue averages $2,574 per month
- Occupancy maintains around 48.3%
- Daily rates hold near $164
Low Season (January, February, April)
- Revenue drops to average $1,760 per month
- Occupancy decreases to average 37.2%
- Daily rates adjust to average $166
Seasonality Insights for Big Rock Township
- The Airbnb seasonality in Big Rock Township shows highly seasonal trends requiring careful strategy. While the sections above show seasonal averages, it's also insightful to look at the extremes:
- During the high season, the absolute peak month showcases Big Rock Township's highest earning potential, with monthly revenues capable of climbing to $4,456, occupancy reaching a high of 61.0%, and ADRs peaking at $196.
- Conversely, the slowest single month of the year, typically falling within the low season, marks the market's lowest point. In this month, revenue might dip to $1,581, occupancy could drop to 27.6%, and ADRs may adjust down to $151.
- Understanding both the seasonal averages and these monthly peaks and troughs in revenue, occupancy, and ADR is crucial for maximizing your Airbnb profit potential in Big Rock Township.
Seasonal Strategies for Maximizing Profit
- Peak Season: Maximize revenue through premium pricing and potentially longer minimum stays. Ensure high availability.
- Low Season: Offer competitive pricing, special promotions (e.g., extended stay discounts), and flexible cancellation policies. Target off-season travelers like remote workers or budget-conscious guests.
- Shoulder Seasons: Implement dynamic pricing that balances peak and low rates. Target weekend travelers or specific events. Offer slightly more flexible terms than peak season.
- Regularly analyze your own performance against these Big Rock Township seasonality benchmarks and adjust your pricing and availability strategy accordingly.
Best Areas for Airbnb Investment in Big Rock Township (2026)
Exploring the top neighborhoods for short-term rentals in Big Rock Township? This section highlights key areas, outlining why they are attractive for hosts and guests, along with notable local attractions. Consider these locations based on your target guest profile and investment strategy.
| Neighborhood / Area | Why Host Here? (Target Guests & Appeal) | Key Attractions & Landmarks |
|---|---|---|
| Lake Catherine | A serene area known for its beautiful views and outdoor activities. It attracts visitors looking for a peaceful retreat with access to recreational fun. | Lake Catherine State Park, Ouachita National Forest, hot springs, fishing, boating |
| Hot Springs | Famous for its natural hot springs and bathhouses, it's a popular tourist destination attracting visitors seeking relaxation and wellness. | Hot Springs National Park, Bathhouse Row, Garvan Woodland Gardens, Magic Springs Theme Park, Oaklawn Racing Casino Resort |
| Malvern | A charming small town with a rich history, ideal for travelers seeking a quaint and local experience. | Malvern Historical Museum, River Park, Old Town Mall, local dining options |
| Mount Ida | Known for its crystal mines and outdoor activities, attracting rockhounds and nature lovers. | Crystal mining, Ouachita Mountains, Lake Ouachita, Wilderness Drive |
| Greers Ferry | A resort town with a stunning lake that captivates visitors for water activities and relaxation. | Greers Ferry Lake, Heber Springs, Patsy Cline Memorial, Sugar Loaf Mountain |
| Arkadelphia | Home to several colleges and a rich educational history, this area attracts young people and families. | Arkadelphia Historic District, DeGray Lake Resort State Park, Ouachita River, local colleges |
| Caddo Valley | Peaceful area close to major highways and suitable for travelers passing through, with easy access to outdoor adventures. | Caddo River, DeGray Lake, Ouachita National Forest, camping and hiking spots |
| Piney | Offers a rustic charm and is known for its scenic routes, great for travelers looking for adventure and tranquility. | scenic countryside, river access, local wildlife, hiking trails |
Understanding Airbnb License Requirements & STR Laws in Big Rock Township (2026)
While Big Rock Township, Arkansas, United States currently shows low STR regulations, specific Airbnb license requirements might still exist or change. Always verify the latest short term rental regulations and Airbnb license requirements directly with local government authorities for Big Rock Township to ensure full compliance before hosting.
(Source: AirROI data, 2026, finding no licensed listings among those analyzed)
Top Performing Airbnb Properties in Big Rock Township (2026)
Benchmark your potential! Explore examples of top-performing Airbnb properties in Big Rock Townshipbased on Trailing Twelve Month (TTM) revenue. Analyze their characteristics, revenue, occupancy rate, and ADR to understand what drives success in this market.
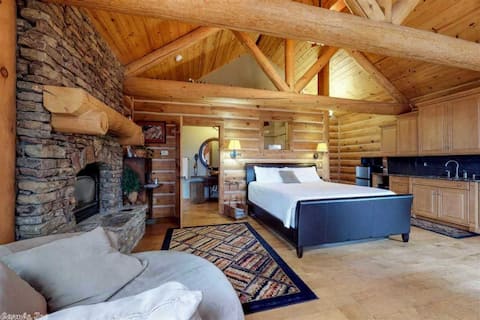
Luxury Private Log Cabin Getaway w/ Hot Tub
Entire Place • 1 bedroom

Historic Beauty in WLR
Entire Place • 5 bedrooms
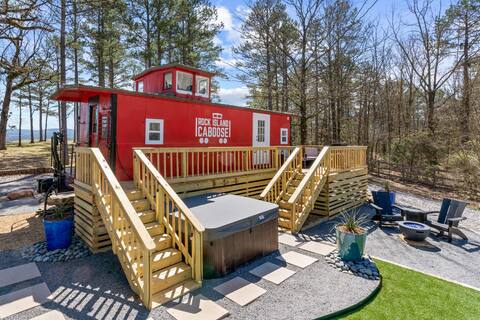
Arkansas' Most Unique Rental Experience
Entire Place • 1 bedroom

Luki’s TreeHouse on 2.5 Private/Wooded Acres
Entire Place • 1 bedroom
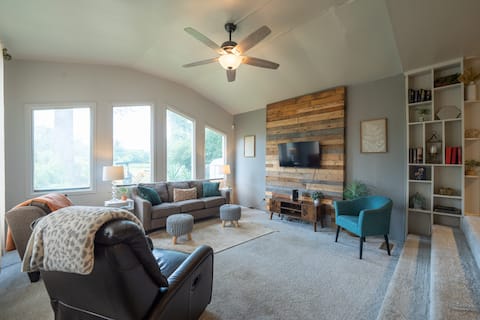
Pinnacle Point~ Deck, Pond View, Spacious
Entire Place • 3 bedrooms

Newly Remodeled Spacious A frame lodge 2600+SF
Entire Place • 4 bedrooms
Note: Performance varies based on location, size, amenities, seasonality, and management quality. Data reflects the past 12 months.
Top Performing Airbnb Hosts in Big Rock Township (2026)
Learn from the best! This table showcases top-performing Airbnb hosts in Big Rock Township based on the number of properties managed and estimated total revenue over the past year. Analyze their scale and performance metrics.
| Host Name | Properties | Grossing Revenue | Stay Reviews | Avg Rating |
|---|---|---|---|---|
| Roger | 2 | $71,791 | 375 | 4.90/5.0 |
| Becca | 1 | $56,143 | 30 | 4.97/5.0 |
| Greg | 1 | $54,206 | 45 | 4.98/5.0 |
| Dustin Wayne | 1 | $48,906 | 176 | 4.98/5.0 |
| Aaron | 1 | $39,917 | 75 | 4.87/5.0 |
| Dena | 1 | $34,513 | 69 | 4.91/5.0 |
| Sarah | 1 | $28,692 | 112 | 4.88/5.0 |
| Joel | 1 | $21,042 | 53 | 4.96/5.0 |
| Doug | 1 | $17,604 | 52 | 4.94/5.0 |
| Michael | 1 | $14,685 | 47 | 4.94/5.0 |
Analyzing the strategies of top hosts, such as their property selection, pricing, and guest communication, can offer valuable lessons for optimizing your own Airbnb operations in Big Rock Township.
Dive Deeper: Advanced Big Rock Township STR Market Data (2026)
Ready to unlock more insights? AirROI provides access to advanced metrics and comprehensive Airbnb data for Big Rock Township. Explore detailed analytics beyond this report to refine your investment strategy, optimize pricing, and maximize your vacation rental profits.
Explore Advanced MetricsBig Rock Township Short-Term Rental Market Composition (2026): Property & Room Types
Room Type Distribution
Property Type Distribution
Market Composition Insights for Big Rock Township
- The Big Rock Township Airbnb market composition is heavily skewed towards Entire Home/Apt listings, which make up 94.7% of the 19 active rentals. This indicates strong guest preference for privacy and space.
- Looking at the property type distribution in Big Rock Township, House properties are the most common (57.9%), reflecting the local real estate landscape.
- Houses represent a significant 57.9% portion, catering likely to families or larger groups.
- The presence of 5.3% Hotel/Boutique listings indicates integration with traditional hospitality.
Big Rock Township Airbnb Room Capacity Analysis (2026): Bedroom Distribution
Distribution of Listings by Number of Bedrooms
Room Capacity Insights for Big Rock Township
- The dominant room capacity in Big Rock Township is 1 bedroom listings, making up 52.6% of the market. This suggests a strong demand for properties suitable for couples or solo travelers.
- Together, 1 bedroom and 4 bedrooms properties represent 73.7% of the active Airbnb listings in Big Rock Township, indicating a high concentration in these sizes.
- With over half the market (52.6%) consisting of studios or 1-bedroom units, Big Rock Township is particularly well-suited for individuals or couples.
- A significant 36.9% of listings offer 3+ bedrooms, catering to larger groups and families seeking more space in Big Rock Township.
Big Rock Township Vacation Rental Guest Capacity Trends (2026)
Distribution of Listings by Guest Capacity
Guest Capacity Insights for Big Rock Township
- The most common guest capacity trend in Big Rock Township vacation rentals is listings accommodating 8+ guests (26.3%). This suggests the primary traveler segment is likely larger groups.
- Properties designed for 8+ guests and 2 guests dominate the Big Rock Township STR market, accounting for 52.6% of listings.
- 42.1% of properties accommodate 6+ guests, serving the market segment for larger families or group travel in Big Rock Township.
- On average, properties in Big Rock Township are equipped to host 4.6 guests.
Big Rock Township Airbnb Booking Patterns (2026): Available vs. Booked Days
Available Days Distribution
Booked Days Distribution
Booking Pattern Insights for Big Rock Township
- The most common availability pattern in Big Rock Township falls within the 271-366 days range, representing 42.1% of listings. This suggests many properties have significant open periods on their calendars.
- Approximately 73.7% of listings show high availability (181+ days open annually), indicating potential for increased bookings or specific owner usage patterns.
- For booked days, the 31-90 days range is most frequent in Big Rock Township (31.6%), reflecting common guest stay durations or potential owner blocking patterns.
- A notable 26.3% of properties secure long booking periods (181+ days booked per year), highlighting successful long-term rental strategies or significant owner usage.
Big Rock Township Airbnb Minimum Stay Requirements Analysis
Distribution of Listings by Minimum Night Requirement
1 Night
8 listings
42.1% of total
2 Nights
10 listings
52.6% of total
30+ Nights
1 listings
5.3% of total
Key Insights
- The most prevalent minimum stay requirement in Big Rock Township is 2 Nights, adopted by 52.6% of listings. This highlights the market's preference for shorter, flexible bookings.
- A strong majority (94.7%) of the Big Rock Township Airbnb data shows acceptance of very short stays (1-2 nights), indicating a dynamic, high-turnover market.
Recommendations
- Align with the market by considering a 2 Nights minimum stay, as 52.6% of Big Rock Township hosts use this setting.
- Explore offering discounts for stays of 30+ nights to attract the 5.3% of the market seeking extended stays.
- Adjust minimum nights based on seasonality – potentially shorter during low season and longer during peak demand periods in Big Rock Township.
Big Rock Township Airbnb Cancellation Policy Trends Analysis (2026)
Limited
1 listings
5.3% of total
Flexible
8 listings
42.1% of total
Moderate
4 listings
21.1% of total
Firm
3 listings
15.8% of total
Strict
3 listings
15.8% of total
Cancellation Policy Insights for Big Rock Township
- The prevailing Airbnb cancellation policy trend in Big Rock Township is Flexible, used by 42.1% of listings.
- There's a relatively balanced mix between guest-friendly (63.2%) and stricter (31.6%) policies, offering choices for different guest needs.
Recommendations for Hosts
- Consider adopting a Flexible policy to align with the 42.1% market standard in Big Rock Township.
- Regularly review your cancellation policy against competitors and market demand shifts in Big Rock Township.
Big Rock Township STR Booking Lead Time Analysis (2026)
Average Booking Lead Time by Month
Booking Lead Time Insights for Big Rock Township
- The overall average booking lead time for vacation rentals in Big Rock Township is 42 days.
- Guests book furthest in advance for stays during January (average 77 days), likely coinciding with peak travel demand or local events.
- The shortest booking windows occur for stays in February (average 24 days), indicating more last-minute travel plans during this time.
- Seasonally, Fall (64 days avg.) sees the longest lead times, while Summer (43 days avg.) has the shortest, reflecting typical travel planning cycles.
Recommendations for Hosts
- Use the overall average lead time (42 days) as a baseline for your pricing and availability strategy in Big Rock Township.
- For January stays, consider implementing length-of-stay discounts or slightly higher rates for bookings made less than 77 days out to capitalize on advance planning.
- Target marketing efforts for the Fall season well in advance (at least 64 days) to capture early planners.
- Monitor your own booking lead times against these Big Rock Township averages to identify opportunities for dynamic pricing adjustments.
Popular & Essential Airbnb Amenities in Big Rock Township (2026)
Amenity Prevalence
Amenity Insights for Big Rock Township
- Essential amenities in Big Rock Township that guests expect include: Air conditioning, Coffee maker, Dishes and silverware, Hot water, TV, Heating. Lacking these (any) could significantly impact bookings.
- Popular amenities like Kitchen, Smoke alarm, Backyard are common but not universal. Offering these can provide a competitive edge.
Recommendations for Hosts
- Ensure your listing includes all essential amenities for Big Rock Township: Air conditioning, Coffee maker, Dishes and silverware, Hot water, TV, Heating.
- Consider adding popular differentiators like Kitchen or Smoke alarm to increase appeal.
- Highlight unique or less common amenities you offer (e.g., hot tub, dedicated workspace, EV charger) in your listing description and photos.
- Regularly check competitor amenities in Big Rock Township to stay competitive.
Big Rock Township Airbnb Guest Demographics & Profile Analysis (2026)
Guest Profile Summary for Big Rock Township
- The typical guest profile for Airbnb in Big Rock Township consists of primarily domestic travelers (98%), often arriving from nearby Little Rock, typically belonging to the Post-2000s (Gen Z/Alpha) group (50%), primarily speaking English or Spanish.
- Domestic travelers account for 98.0% of guests.
- Key international markets include United States (98%) and United Kingdom (1.6%).
- Top languages spoken are English (74.8%) followed by Spanish (15%).
- A significant demographic segment is the Post-2000s (Gen Z/Alpha) group, representing 50% of guests.
Recommendations for Hosts
- Target domestic marketing efforts towards travelers from Little Rock and Kansas City.
- Tailor amenities and listing descriptions to appeal to the dominant Post-2000s (Gen Z/Alpha) demographic (e.g., highlight fast WiFi, smart home features, local guides).
- Highlight unique local experiences or amenities relevant to the primary guest profile.
- Consider seasonal promotions aligned with peak travel times for key origin markets.
Nearby Short-Term Rental Market Comparison
How does the Big Rock Township Airbnb market stack up against its neighbors? Compare key performance metrics like average monthly revenue, ADR, and occupancy rates in surrounding areas to understand the broader regional STR landscape.
| Market | Active Properties | Monthly Revenue | Daily Rate | Avg. Occupancy |
|---|---|---|---|---|
| Rockwell | 13 | $7,988 | $554.32 | 46% |
| Piney | 24 | $3,392 | $419.30 | 28% |
| Lake Hamilton | 77 | $3,228 | $328.72 | 34% |
| Garland County | 112 | $2,994 | $306.01 | 37% |
| Glenwood | 46 | $2,825 | $334.42 | 33% |
| Royal | 99 | $2,723 | $299.88 | 34% |
| Fountain Lake | 10 | $2,710 | $258.81 | 39% |
| Combs | 17 | $2,582 | $170.19 | 52% |
| Pearcy | 13 | $2,555 | $195.71 | 43% |
| Pangburn | 22 | $2,543 | $228.24 | 42% |