Amity Airbnb Market Analysis 2026: Short Term Rental Data & Vacation Rental Statistics in Arkansas, United States
Is Airbnb profitable in Amity in 2026? Explore comprehensive Airbnb analytics for Amity, Arkansas, United States to uncover income potential. This 2026 STR market report for Amity, based on AirROI data from February 2025 to January 2026, reveals key trends in the niche market of 22 active listings.
Whether you're considering an Airbnb investment in Amity, optimizing your existing vacation rental, or exploring rental arbitrage opportunities, understanding the Amity Airbnb data is crucial. Leveraging the low regulation environment is key to maximizing your short term rental income potential. Let's dive into the specifics.
Key Amity Airbnb Performance Metrics Overview
Monthly Airbnb Revenue Variations & Income Potential in Amity (2026)
Understanding the monthly revenue variations for Airbnb listings in Amity is key to maximizing your short term rental income potential. Seasonality significantly impacts earnings. Our analysis, based on data from the past 12 months, shows that the peak revenue month for STRs in Amity is typically March, while April often presents the lowest earnings, highlighting opportunities for strategic pricing adjustments during shoulder and low seasons. Explore the typical Airbnb income in Amity across different performance tiers:
- Best-in-class properties (Top 10%) achieve $5,135+ monthly, often utilizing dynamic pricing and superior guest experiences.
- Strong performing properties (Top 25%) earn $3,222 or more, indicating effective management and desirable locations/amenities.
- Typical properties (Median) generate around $1,869 per month, representing the average market performance.
- Entry-level properties (Bottom 25%) see earnings around $1,061, often with potential for optimization.
Average Monthly Airbnb Earnings Trend in Amity
Amity Airbnb Occupancy Rate Trends (2026)
Maximize your bookings by understanding the Amity STR occupancy trends. Seasonal demand shifts significantly influence how often properties are booked. Typically, Novembersees the highest demand (peak season occupancy), while April experiences the lowest (low season). Effective strategies, like adjusting minimum stays or offering promotions, can boost occupancy during slower periods. Here's how different property tiers perform in Amity:
- Best-in-class properties (Top 10%) achieve 71%+ occupancy, indicating high desirability and potentially optimized availability.
- Strong performing properties (Top 25%) maintain 48% or higher occupancy, suggesting good market fit and guest satisfaction.
- Typical properties (Median) have an occupancy rate around 30%.
- Entry-level properties (Bottom 25%) average 16% occupancy, potentially facing higher vacancy.
Average Monthly Occupancy Rate Trend in Amity
Average Daily Rate (ADR) Airbnb Trends in Amity (2026)
Effective short term rental pricing strategy in Amity involves understanding monthly ADR fluctuations. The Average Daily Rate (ADR) for Airbnb in Amity typically peaks in August and dips lowest during September. Leveraging Airbnb dynamic pricing tools or strategies based on this seasonality can significantly boost revenue. Here's a look at the typical nightly rates achieved:
- Best-in-class properties (Top 10%) command rates of $503+ per night, often due to premium features or locations.
- Strong performing properties (Top 25%) achieve nightly rates of $308 or more.
- Typical properties (Median) charge around $231 per night.
- Entry-level properties (Bottom 25%) earn around $166 per night.
Average Daily Rate (ADR) Trend by Month in Amity
Get Live Amity Market Intelligence 👇

Explore Real-time Analytics
Airbnb Seasonality Analysis & Trends in Amity (2026)
Peak Season (March, June, July)
- Revenue averages $3,945 per month
- Occupancy rates average 40.2%
- Daily rates average $404
Shoulder Season
- Revenue averages $2,468 per month
- Occupancy maintains around 38.5%
- Daily rates hold near $337
Low Season (January, February, April)
- Revenue drops to average $1,804 per month
- Occupancy decreases to average 25.1%
- Daily rates adjust to average $338
Seasonality Insights for Amity
- The Airbnb seasonality in Amity shows highly seasonal trends requiring careful strategy. While the sections above show seasonal averages, it's also insightful to look at the extremes:
- During the high season, the absolute peak month showcases Amity's highest earning potential, with monthly revenues capable of climbing to $4,869, occupancy reaching a high of 47.3%, and ADRs peaking at $417.
- Conversely, the slowest single month of the year, typically falling within the low season, marks the market's lowest point. In this month, revenue might dip to $1,630, occupancy could drop to 18.4%, and ADRs may adjust down to $254.
- Understanding both the seasonal averages and these monthly peaks and troughs in revenue, occupancy, and ADR is crucial for maximizing your Airbnb profit potential in Amity.
Seasonal Strategies for Maximizing Profit
- Peak Season: Maximize revenue through premium pricing and potentially longer minimum stays. Ensure high availability.
- Low Season: Offer competitive pricing, special promotions (e.g., extended stay discounts), and flexible cancellation policies. Target off-season travelers like remote workers or budget-conscious guests.
- Shoulder Seasons: Implement dynamic pricing that balances peak and low rates. Target weekend travelers or specific events. Offer slightly more flexible terms than peak season.
- Regularly analyze your own performance against these Amity seasonality benchmarks and adjust your pricing and availability strategy accordingly.
Best Areas for Airbnb Investment in Amity (2026)
Exploring the top neighborhoods for short-term rentals in Amity? This section highlights key areas, outlining why they are attractive for hosts and guests, along with notable local attractions. Consider these locations based on your target guest profile and investment strategy.
| Neighborhood / Area | Why Host Here? (Target Guests & Appeal) | Key Attractions & Landmarks |
|---|---|---|
| Lake Ouachita | A stunning natural lake known for water sports, fishing, and outdoor activities. This area attracts nature lovers and vacationers seeking a serene getaway surrounded by beautiful scenery. | Lake Ouachita State Park, Ouachita National Forest, Surfing, boating, and fishing opportunities, Hot Springs National Park nearby, Scenic hiking trails |
| Hot Springs | Famous for its historic bathhouses and natural hot springs, this city is a popular destination for wellness tourism. Tourists are drawn to its unique spas and outdoor attractions. | Hot Springs National Park, Bathhouse Row, Oaklawn Racing Casino Resort, Garvan Woodland Gardens, Magic Springs Theme and Water Park |
| Arkansas Highway 7 | Known as the 'Natural State's Scenic Byway', this route is perfect for road trippers and adventure seekers exploring the Ozark mountains and beautiful landscapes. | Petite Jean State Park, Morrilton, Petit Jean Mountain, Waterfalls and scenic overlooks, Hiking trails and camping areas |
| Caddo River | This area is renowned for canoeing and kayaking, drawing outdoor enthusiasts and families for summer adventures. It offers a refreshing escape and exhilarating water activities. | Caddo River canoeing, Jellyfish Lake, Camping facilities, Water activities, Natural beauty |
| Arkadelphia | Home to several colleges and universities, Arkadelphia attracts students and families alike. Its cultural events and local dining make it an appealing location for visitors. | Ouachita Baptist University, Henderson State University, Local parks, Cultural festivals, Main Street shopping |
| Malvern | A small town with rich history and local charm. It serves as a convenient base for exploring the surrounding nature and attractions of southern Arkansas. | Malvern's historic downtown, Local art galleries, Southern Arkansas Arts Center, Parks and recreational areas, Proximity to Hot Springs |
| DeGray Lake | A beautiful lake resort area ideal for fishing, boating, and relaxing. With pristine waters and surrounding trails, it’s a great aquatic playground for tourists. | DeGray Lake Resort State Park, Water sports and fishing, Hiking trails, Camping and picnicking areas, Scenic views |
| Ouachita Mountains | A picturesque mountain range offering a perfect backdrop for outdoor adventures including hiking, biking, and wildlife observation. It's a favorite for nature enthusiasts. | Ouachita National Forest, Scenic drives, Wildlife watching, Hiking trails, Gorgeous mountain vistas |
Understanding Airbnb License Requirements & STR Laws in Amity (2026)
While Amity, Arkansas, United States currently shows low STR regulations, specific Airbnb license requirements might still exist or change. Always verify the latest short term rental regulations and Airbnb license requirements directly with local government authorities for Amity to ensure full compliance before hosting.
(Source: AirROI data, 2026, finding no licensed listings among those analyzed)
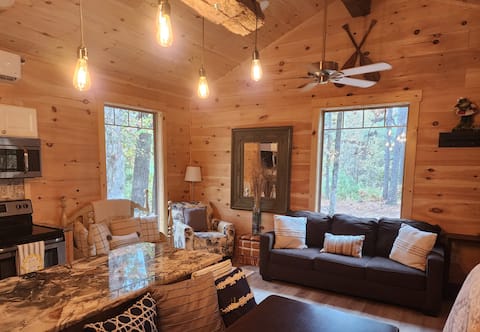
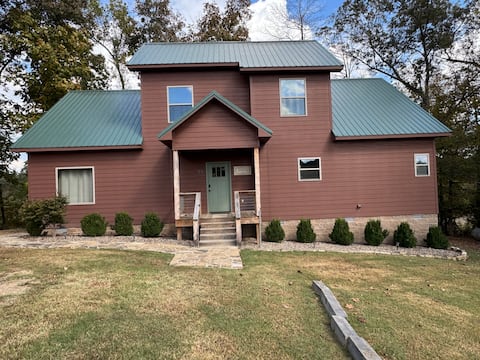
Top Performing Airbnb Properties in Amity (2026)
Benchmark your potential! Explore examples of top-performing Airbnb properties in Amitybased on Trailing Twelve Month (TTM) revenue. Analyze their characteristics, revenue, occupancy rate, and ADR to understand what drives success in this market.

Beautiful Winter Views await at Rivers Bend
Entire Place • 1 bedroom
Rustic Comfort Cabin Diamond in The Ripple-hot tub
Entire Place • 2 bedrooms

Spacious Retreat on Caddo River, Amity
Entire Place • 3 bedrooms

The Grand Bunk *Sleeps 34 *Fire Pit *Rec Center
Entire Place • 6 bedrooms
River of Dreams Enjoy Nature Relax Unwind
Entire Place • 4 bedrooms

Rustic Comfort Cabins:Angler Basin Cabin w/Hot Tub
Entire Place • 2 bedrooms
Note: Performance varies based on location, size, amenities, seasonality, and management quality. Data reflects the past 12 months.
Top Performing Airbnb Hosts in Amity (2026)
Learn from the best! This table showcases top-performing Airbnb hosts in Amity based on the number of properties managed and estimated total revenue over the past year. Analyze their scale and performance metrics.
| Host Name | Properties | Grossing Revenue | Stay Reviews | Avg Rating |
|---|---|---|---|---|
| Spa City | 8 | $85,363 | 36 | 4.68/5.0 |
| Michelle | 2 | $68,815 | 136 | 4.98/5.0 |
| Thomas | 1 | $48,585 | 74 | 4.97/5.0 |
| Christopher | 1 | $40,737 | 12 | 4.92/5.0 |
| Julia | 1 | $30,852 | 46 | 5.00/5.0 |
| Farrah | 2 | $27,705 | 39 | 4.92/5.0 |
| Thelma | 1 | $24,460 | 53 | 4.89/5.0 |
| Caddo River Realty | 1 | $17,890 | 40 | 4.80/5.0 |
| Morgan | 1 | $13,928 | 33 | 5.00/5.0 |
| Debbie | 1 | $12,765 | 34 | 4.97/5.0 |
Analyzing the strategies of top hosts, such as their property selection, pricing, and guest communication, can offer valuable lessons for optimizing your own Airbnb operations in Amity.
Dive Deeper: Advanced Amity STR Market Data (2026)
Ready to unlock more insights? AirROI provides access to advanced metrics and comprehensive Airbnb data for Amity. Explore detailed analytics beyond this report to refine your investment strategy, optimize pricing, and maximize your vacation rental profits.
Explore Advanced MetricsAmity Short-Term Rental Market Composition (2026): Property & Room Types
Room Type Distribution
Property Type Distribution
Market Composition Insights for Amity
- The Amity Airbnb market composition is heavily skewed towards Entire Home/Apt listings, which make up 90.9% of the 22 active rentals. This indicates strong guest preference for privacy and space.
- Looking at the property type distribution in Amity, Outdoor/Unique properties are the most common (63.6%), reflecting the local real estate landscape.
- Houses represent a significant 27.3% portion, catering likely to families or larger groups.
- Smaller segments like hotel/boutique, unique stays (combined 9.0%) offer potential for unique stay experiences.
Amity Airbnb Room Capacity Analysis (2026): Bedroom Distribution
Distribution of Listings by Number of Bedrooms
Room Capacity Insights for Amity
- The dominant room capacity in Amity is 2 bedrooms listings, making up 40.9% of the market. This suggests a strong demand for properties suitable for couples or solo travelers.
- Together, 2 bedrooms and 4 bedrooms properties represent 59.1% of the active Airbnb listings in Amity, indicating a high concentration in these sizes.
- A significant 40.9% of listings offer 3+ bedrooms, catering to larger groups and families seeking more space in Amity.
Amity Vacation Rental Guest Capacity Trends (2026)
Distribution of Listings by Guest Capacity
Guest Capacity Insights for Amity
- The most common guest capacity trend in Amity vacation rentals is listings accommodating 8+ guests (40.9%). This suggests the primary traveler segment is likely larger groups.
- Properties designed for 8+ guests and 6 guests dominate the Amity STR market, accounting for 72.7% of listings.
- 81.8% of properties accommodate 6+ guests, serving the market segment for larger families or group travel in Amity.
- On average, properties in Amity are equipped to host 6.2 guests.
Amity Airbnb Booking Patterns (2026): Available vs. Booked Days
Available Days Distribution
Booked Days Distribution
Booking Pattern Insights for Amity
- The most common availability pattern in Amity falls within the 271-366 days range, representing 63.6% of listings. This suggests many properties have significant open periods on their calendars.
- Approximately 86.3% of listings show high availability (181+ days open annually), indicating potential for increased bookings or specific owner usage patterns.
- For booked days, the 1-30 days range is most frequent in Amity (40.9%), reflecting common guest stay durations or potential owner blocking patterns.
- A notable 13.6% of properties secure long booking periods (181+ days booked per year), highlighting successful long-term rental strategies or significant owner usage.
Amity Airbnb Minimum Stay Requirements Analysis
Distribution of Listings by Minimum Night Requirement
1 Night
5 listings
22.7% of total
2 Nights
7 listings
31.8% of total
30+ Nights
10 listings
45.5% of total
Key Insights
- The most prevalent minimum stay requirement in Amity is 30+ Nights, adopted by 45.5% of listings. This highlights the market's preference for longer commitments.
- A significant segment (45.5%) caters to monthly stays (30+ nights) in Amity, pointing to opportunities in the extended-stay market.
Recommendations
- Align with the market by considering a 30+ Nights minimum stay, as 45.5% of Amity hosts use this setting.
- If feasible, allowing 1-night stays, especially midweek or during low season, could capture last-minute bookings, as only 22.7% currently do.
- Explore offering discounts for stays of 30+ nights to attract the 45.5% of the market seeking extended stays.
- Adjust minimum nights based on seasonality – potentially shorter during low season and longer during peak demand periods in Amity.
Amity Airbnb Cancellation Policy Trends Analysis (2026)
Limited
1 listings
4.5% of total
Flexible
4 listings
18.2% of total
Moderate
4 listings
18.2% of total
Firm
12 listings
54.5% of total
Strict
1 listings
4.5% of total
Cancellation Policy Insights for Amity
- The prevailing Airbnb cancellation policy trend in Amity is Firm, used by 54.5% of listings.
- A majority (59.0%) of hosts in Amity utilize Firm or Strict policies, indicating a market where hosts prioritize booking security.
- Strict cancellation policies are quite rare (4.5%), potentially making listings with this policy less competitive unless justified by high demand or property type.
Recommendations for Hosts
- Consider adopting a Firm policy to align with the 54.5% market standard in Amity.
- Using a Strict policy might deter some guests, as only 4.5% of listings use it. Evaluate if potential revenue protection outweighs possible lower booking rates.
- Regularly review your cancellation policy against competitors and market demand shifts in Amity.
Amity STR Booking Lead Time Analysis (2026)
Average Booking Lead Time by Month
Booking Lead Time Insights for Amity
- The overall average booking lead time for vacation rentals in Amity is 45 days.
- Guests book furthest in advance for stays during June (average 80 days), likely coinciding with peak travel demand or local events.
- The shortest booking windows occur for stays in December (average 26 days), indicating more last-minute travel plans during this time.
- Seasonally, Summer (53 days avg.) sees the longest lead times, while Fall (31 days avg.) has the shortest, reflecting typical travel planning cycles.
Recommendations for Hosts
- Use the overall average lead time (45 days) as a baseline for your pricing and availability strategy in Amity.
- For June stays, consider implementing length-of-stay discounts or slightly higher rates for bookings made less than 80 days out to capitalize on advance planning.
- Target marketing efforts for the Summer season well in advance (at least 53 days) to capture early planners.
- Monitor your own booking lead times against these Amity averages to identify opportunities for dynamic pricing adjustments.
Popular & Essential Airbnb Amenities in Amity (2026)
Amenity Prevalence
Amenity Insights for Amity
- Essential amenities in Amity that guests expect include: Hot water, Free parking on premises, Heating, TV, Kitchen, Dishes and silverware, Coffee maker, Refrigerator, Air conditioning, Cooking basics. Lacking these (any) could significantly impact bookings.
Recommendations for Hosts
- Ensure your listing includes all essential amenities for Amity: Hot water, Free parking on premises, Heating, TV, Kitchen, Dishes and silverware, Coffee maker, Refrigerator, Air conditioning, Cooking basics.
- Prioritize adding missing essentials: Cooking basics.
- Highlight unique or less common amenities you offer (e.g., hot tub, dedicated workspace, EV charger) in your listing description and photos.
- Regularly check competitor amenities in Amity to stay competitive.
Amity Airbnb Guest Demographics & Profile Analysis (2026)
Guest Profile Summary for Amity
- The typical guest profile for Airbnb in Amity consists of primarily domestic travelers (98%), often arriving from nearby Lake Charles, typically belonging to the Post-2000s (Gen Z/Alpha) group (50%), primarily speaking English or Spanish.
- Domestic travelers account for 98.3% of guests.
- Key international markets include United States (98.3%) and South Korea (0.8%).
- Top languages spoken are English (74.5%) followed by Spanish (8.5%).
- A significant demographic segment is the Post-2000s (Gen Z/Alpha) group, representing 50% of guests.
Recommendations for Hosts
- Target domestic marketing efforts towards travelers from Lake Charles and Arlington.
- Tailor amenities and listing descriptions to appeal to the dominant Post-2000s (Gen Z/Alpha) demographic (e.g., highlight fast WiFi, smart home features, local guides).
- Highlight unique local experiences or amenities relevant to the primary guest profile.
- Consider seasonal promotions aligned with peak travel times for key origin markets.
Nearby Short-Term Rental Market Comparison
How does the Amity Airbnb market stack up against its neighbors? Compare key performance metrics like average monthly revenue, ADR, and occupancy rates in surrounding areas to understand the broader regional STR landscape.
| Market | Active Properties | Monthly Revenue | Daily Rate | Avg. Occupancy |
|---|---|---|---|---|
| Rockwell | 13 | $7,988 | $554.32 | 46% |
| McCurtain County | 85 | $5,126 | $519.27 | 35% |
| Broken Bow | 2,882 | $4,449 | $430.98 | 37% |
| Hochatown | 17 | $3,781 | $398.64 | 33% |
| Piney | 24 | $3,392 | $419.30 | 28% |
| Lake Hamilton | 77 | $3,228 | $328.72 | 34% |
| Garland County | 112 | $2,994 | $306.01 | 37% |
| Glenwood | 46 | $2,825 | $334.42 | 33% |
| Royal | 99 | $2,723 | $299.88 | 34% |
| Fountain Lake | 10 | $2,710 | $258.81 | 39% |