Worth Matravers Airbnb Market Analysis 2026: Short Term Rental Data & Vacation Rental Statistics in England, United Kingdom
Is Airbnb profitable in Worth Matravers in 2026? Explore comprehensive Airbnb analytics for Worth Matravers, England, United Kingdom to uncover income potential. This 2026 STR market report for Worth Matravers, based on AirROI data from February 2025 to January 2026, reveals key trends in the niche market of 48 active listings.
Whether you're considering an Airbnb investment in Worth Matravers, optimizing your existing vacation rental, or exploring rental arbitrage opportunities, understanding the Worth Matravers Airbnb data is crucial. Leveraging the low regulation environment is key to maximizing your short term rental income potential. Let's dive into the specifics.
Key Worth Matravers Airbnb Performance Metrics Overview
Monthly Airbnb Revenue Variations & Income Potential in Worth Matravers (2026)
Understanding the monthly revenue variations for Airbnb listings in Worth Matravers is key to maximizing your short term rental income potential. Seasonality significantly impacts earnings. Our analysis, based on data from the past 12 months, shows that the peak revenue month for STRs in Worth Matravers is typically August, while February often presents the lowest earnings, highlighting opportunities for strategic pricing adjustments during shoulder and low seasons. Explore the typical Airbnb income in Worth Matravers across different performance tiers:
- Best-in-class properties (Top 10%) achieve $9,941+ monthly, often utilizing dynamic pricing and superior guest experiences.
- Strong performing properties (Top 25%) earn $4,286 or more, indicating effective management and desirable locations/amenities.
- Typical properties (Median) generate around $2,499 per month, representing the average market performance.
- Entry-level properties (Bottom 25%) see earnings around $1,270, often with potential for optimization.
Average Monthly Airbnb Earnings Trend in Worth Matravers
Worth Matravers Airbnb Occupancy Rate Trends (2026)
Maximize your bookings by understanding the Worth Matravers STR occupancy trends. Seasonal demand shifts significantly influence how often properties are booked. Typically, Julysees the highest demand (peak season occupancy), while January experiences the lowest (low season). Effective strategies, like adjusting minimum stays or offering promotions, can boost occupancy during slower periods. Here's how different property tiers perform in Worth Matravers:
- Best-in-class properties (Top 10%) achieve 77%+ occupancy, indicating high desirability and potentially optimized availability.
- Strong performing properties (Top 25%) maintain 60% or higher occupancy, suggesting good market fit and guest satisfaction.
- Typical properties (Median) have an occupancy rate around 39%.
- Entry-level properties (Bottom 25%) average 24% occupancy, potentially facing higher vacancy.
Average Monthly Occupancy Rate Trend in Worth Matravers
Average Daily Rate (ADR) Airbnb Trends in Worth Matravers (2026)
Effective short term rental pricing strategy in Worth Matravers involves understanding monthly ADR fluctuations. The Average Daily Rate (ADR) for Airbnb in Worth Matravers typically peaks in August and dips lowest during November. Leveraging Airbnb dynamic pricing tools or strategies based on this seasonality can significantly boost revenue. Here's a look at the typical nightly rates achieved:
- Best-in-class properties (Top 10%) command rates of $742+ per night, often due to premium features or locations.
- Strong performing properties (Top 25%) achieve nightly rates of $461 or more.
- Typical properties (Median) charge around $202 per night.
- Entry-level properties (Bottom 25%) earn around $148 per night.
Average Daily Rate (ADR) Trend by Month in Worth Matravers
Get Live Worth Matravers Market Intelligence 👇

Explore Real-time Analytics
Airbnb Seasonality Analysis & Trends in Worth Matravers (2026)
Peak Season (August, July, April)
- Revenue averages $6,615 per month
- Occupancy rates average 59.0%
- Daily rates average $385
Shoulder Season
- Revenue averages $4,255 per month
- Occupancy maintains around 42.8%
- Daily rates hold near $338
Low Season (January, February, November)
- Revenue drops to average $2,023 per month
- Occupancy decreases to average 24.7%
- Daily rates adjust to average $300
Seasonality Insights for Worth Matravers
- The Airbnb seasonality in Worth Matravers shows highly seasonal trends requiring careful strategy. While the sections above show seasonal averages, it's also insightful to look at the extremes:
- During the high season, the absolute peak month showcases Worth Matravers's highest earning potential, with monthly revenues capable of climbing to $7,788, occupancy reaching a high of 63.2%, and ADRs peaking at $422.
- Conversely, the slowest single month of the year, typically falling within the low season, marks the market's lowest point. In this month, revenue might dip to $1,799, occupancy could drop to 19.7%, and ADRs may adjust down to $298.
- Understanding both the seasonal averages and these monthly peaks and troughs in revenue, occupancy, and ADR is crucial for maximizing your Airbnb profit potential in Worth Matravers.
Seasonal Strategies for Maximizing Profit
- Peak Season: Maximize revenue through premium pricing and potentially longer minimum stays. Ensure high availability.
- Low Season: Offer competitive pricing, special promotions (e.g., extended stay discounts), and flexible cancellation policies. Target off-season travelers like remote workers or budget-conscious guests.
- Shoulder Seasons: Implement dynamic pricing that balances peak and low rates. Target weekend travelers or specific events. Offer slightly more flexible terms than peak season.
- Regularly analyze your own performance against these Worth Matravers seasonality benchmarks and adjust your pricing and availability strategy accordingly.
Best Areas for Airbnb Investment in Worth Matravers (2026)
Exploring the top neighborhoods for short-term rentals in Worth Matravers? This section highlights key areas, outlining why they are attractive for hosts and guests, along with notable local attractions. Consider these locations based on your target guest profile and investment strategy.
| Neighborhood / Area | Why Host Here? (Target Guests & Appeal) | Key Attractions & Landmarks |
|---|---|---|
| Dorset Coast | The stunning coastline of Dorset, including the famous Jurassic Coast, attracts tourists for its natural beauty and geological significance. Ideal for nature lovers and beachgoers. | Durdle Door, Lulworth Cove, Corfe Castle, Old Harry Rocks, Studland Bay |
| Swanage | A charming seaside town known for its beautiful beaches and family-friendly atmosphere. Attractive for vacationers seeking a traditional coastal getaway. | Swanage Beach, Swanage Railway, Durlston Country Park, Old Harry Rocks, Museum of Swanage |
| Corfe Castle | A historic village dominated by the imposing ruins of Corfe Castle, which offers rich history and stunning countryside walks. Popular with history enthusiasts and explorers. | Corfe Castle, The Castle and Village, Purbeck Hills, The Square and Compass, Corfe Common |
| Purbeck Hills | Beautiful rolling hills that provide stunning views and hiking opportunities, attracting outdoor enthusiasts and those looking to escape the urban environment. | Clouds Hill, Kingston Lacy, Hardy’s Birthplace, Wareham Forest, Kimmeridge Bay |
| Lulworth Cove | Famed for its unique geology and scenic cove, Lulworth Cove attracts visitors interested in natural wonders and outdoor activities. | Lulworth Cove, Durdle Door, Lulworth Castle, South West Coast Path, Lulworth Crumple |
| Studland | A coastal village with beautiful beaches and nature reserves, perfect for tourists looking for a relaxed seaside retreat. | Studland Beach, Swanage Bay, Studland Nature Reserve, Knoll Beach, Old Harry Rocks |
| Wareham | A picturesque town that offers a mix of history, shopping, and access to the beautiful surrounding countryside. Great for visitors who enjoy both culture and nature. | Wareham Town Museum, River Frome, The Saxon Walls, Monkey World, Wareham Common |
| Purbeck Railway | A heritage railway that offers scenic train rides through the Dorset countryside. Perfect for families and railway enthusiasts. | Swanage Railway, Corfe Castle Station, Forest Walks, Heritage Railway Events, Scenic Views along the route |
Understanding Airbnb License Requirements & STR Laws in Worth Matravers (2026)
While Worth Matravers, England, United Kingdom currently shows low STR regulations, specific Airbnb license requirements might still exist or change. Always verify the latest short term rental regulations and Airbnb license requirements directly with local government authorities for Worth Matravers to ensure full compliance before hosting.
(Source: AirROI data, 2026, finding no licensed listings among those analyzed)
Top Performing Airbnb Properties in Worth Matravers (2026)
Benchmark your potential! Explore examples of top-performing Airbnb properties in Worth Matraversbased on Trailing Twelve Month (TTM) revenue. Analyze their characteristics, revenue, occupancy rate, and ADR to understand what drives success in this market.
4 Bed in Swanage (oc-dc082)
Entire Place • 4 bedrooms

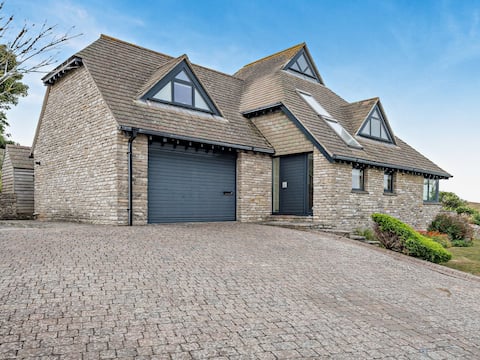
4 Bed in Worth Matravers (IC036)
Entire Place • 4 bedrooms

5 Bed in Swanage (oc-dc201)
Entire Place • 5 bedrooms
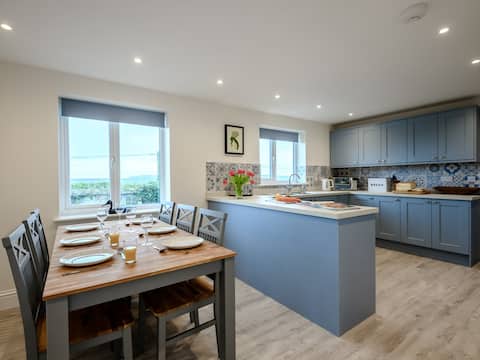
3 Bed in Worth Matravers (DC063)
Entire Place • 3 bedrooms
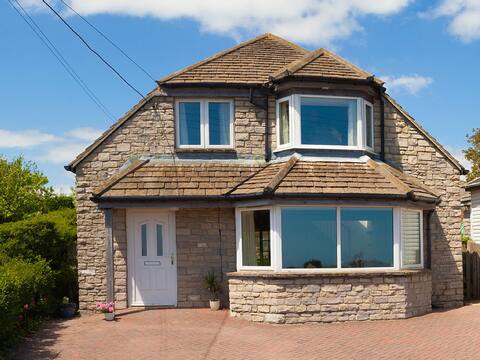
3 Bed in Worth Matravers (80578)
Entire Place • 3 bedrooms
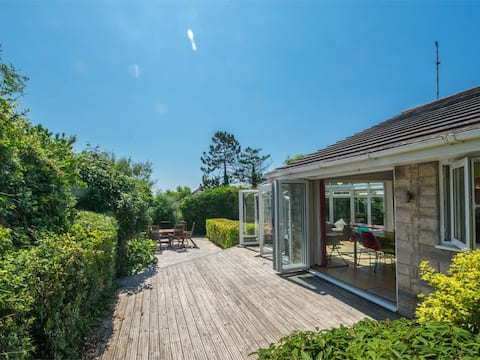
Spacious Coastal Home with Stunning Sea Views
Entire Place • 5 bedrooms
Note: Performance varies based on location, size, amenities, seasonality, and management quality. Data reflects the past 12 months.
Top Performing Airbnb Hosts in Worth Matravers (2026)
Learn from the best! This table showcases top-performing Airbnb hosts in Worth Matravers based on the number of properties managed and estimated total revenue over the past year. Analyze their scale and performance metrics.
| Host Name | Properties | Grossing Revenue | Stay Reviews | Avg Rating |
|---|---|---|---|---|
| Holidaycottages.Co.Uk | 4 | $513,073 | 18 | 4.75/5.0 |
| Holidaycottages.Co.Uk | 3 | $255,434 | 14 | 4.83/5.0 |
| Wendy | 2 | $116,608 | 79 | 4.91/5.0 |
| Holidaycottages.Co.Uk | 1 | $78,041 | 1 | Not Rated |
| Sam | 3 | $75,040 | 192 | 4.89/5.0 |
| Holly | 1 | $70,733 | 49 | 4.86/5.0 |
| Philippa Ann | 1 | $69,516 | 165 | 4.91/5.0 |
| Wyke Dorset Cottages | 4 | $69,213 | 23 | 4.45/5.0 |
| Sophie | 1 | $64,052 | 78 | 4.97/5.0 |
| Graeme | 1 | $54,895 | 161 | 4.96/5.0 |
Analyzing the strategies of top hosts, such as their property selection, pricing, and guest communication, can offer valuable lessons for optimizing your own Airbnb operations in Worth Matravers.
Dive Deeper: Advanced Worth Matravers STR Market Data (2026)
Ready to unlock more insights? AirROI provides access to advanced metrics and comprehensive Airbnb data for Worth Matravers. Explore detailed analytics beyond this report to refine your investment strategy, optimize pricing, and maximize your vacation rental profits.
Explore Advanced MetricsWorth Matravers Short-Term Rental Market Composition (2026): Property & Room Types
Room Type Distribution
Property Type Distribution
Market Composition Insights for Worth Matravers
- The Worth Matravers Airbnb market composition is heavily skewed towards Entire Home/Apt listings, which make up 87.5% of the 48 active rentals. This indicates strong guest preference for privacy and space.
- Looking at the property type distribution in Worth Matravers, House properties are the most common (66.7%), reflecting the local real estate landscape.
- Houses represent a significant 66.7% portion, catering likely to families or larger groups.
- Smaller segments like hotel/boutique, others (combined 8.4%) offer potential for unique stay experiences.
Worth Matravers Airbnb Room Capacity Analysis (2026): Bedroom Distribution
Distribution of Listings by Number of Bedrooms
Room Capacity Insights for Worth Matravers
- The dominant room capacity in Worth Matravers is 1 bedroom listings, making up 31.3% of the market. This suggests a strong demand for properties suitable for couples or solo travelers.
- Together, 1 bedroom and 4 bedrooms properties represent 52.1% of the active Airbnb listings in Worth Matravers, indicating a high concentration in these sizes.
- A significant 47.9% of listings offer 3+ bedrooms, catering to larger groups and families seeking more space in Worth Matravers.
Worth Matravers Vacation Rental Guest Capacity Trends (2026)
Distribution of Listings by Guest Capacity
Guest Capacity Insights for Worth Matravers
- The most common guest capacity trend in Worth Matravers vacation rentals is listings accommodating 2 guests (29.2%). This suggests the primary traveler segment is likely couples or solo travelers.
- Properties designed for 2 guests and 8+ guests dominate the Worth Matravers STR market, accounting for 50.0% of listings.
- 45.8% of properties accommodate 6+ guests, serving the market segment for larger families or group travel in Worth Matravers.
- On average, properties in Worth Matravers are equipped to host 4.5 guests.
Worth Matravers Airbnb Booking Patterns (2026): Available vs. Booked Days
Available Days Distribution
Booked Days Distribution
Booking Pattern Insights for Worth Matravers
- The most common availability pattern in Worth Matravers falls within the 271-366 days range, representing 43.8% of listings. This suggests many properties have significant open periods on their calendars.
- Approximately 75.1% of listings show high availability (181+ days open annually), indicating potential for increased bookings or specific owner usage patterns.
- For booked days, the 91-180 days range is most frequent in Worth Matravers (33.3%), reflecting common guest stay durations or potential owner blocking patterns.
- A notable 25.0% of properties secure long booking periods (181+ days booked per year), highlighting successful long-term rental strategies or significant owner usage.
Worth Matravers Airbnb Minimum Stay Requirements Analysis
Distribution of Listings by Minimum Night Requirement
1 Night
7 listings
14.6% of total
2 Nights
17 listings
35.4% of total
3 Nights
4 listings
8.3% of total
4-6 Nights
1 listings
2.1% of total
7-29 Nights
2 listings
4.2% of total
30+ Nights
17 listings
35.4% of total
Key Insights
- The most prevalent minimum stay requirement in Worth Matravers is 2 Nights, adopted by 35.4% of listings. This highlights the market's preference for shorter, flexible bookings.
- A significant segment (35.4%) caters to monthly stays (30+ nights) in Worth Matravers, pointing to opportunities in the extended-stay market.
Recommendations
- Align with the market by considering a 2 Nights minimum stay, as 35.4% of Worth Matravers hosts use this setting.
- If feasible, allowing 1-night stays, especially midweek or during low season, could capture last-minute bookings, as only 14.6% currently do.
- A 2-night minimum appears standard (35.4%). Consider this for weekends or peak periods.
- Explore offering discounts for stays of 30+ nights to attract the 35.4% of the market seeking extended stays.
- Adjust minimum nights based on seasonality – potentially shorter during low season and longer during peak demand periods in Worth Matravers.
Worth Matravers Airbnb Cancellation Policy Trends Analysis (2026)
Super Strict 60 Days
14 listings
29.2% of total
Flexible
4 listings
8.3% of total
Moderate
12 listings
25% of total
Firm
13 listings
27.1% of total
Strict
5 listings
10.4% of total
Cancellation Policy Insights for Worth Matravers
- The prevailing Airbnb cancellation policy trend in Worth Matravers is Super Strict 60 Days, used by 29.2% of listings.
- There's a relatively balanced mix between guest-friendly (33.3%) and stricter (37.5%) policies, offering choices for different guest needs.
Recommendations for Hosts
- Consider adopting a Super Strict 60 Days policy to align with the 29.2% market standard in Worth Matravers.
- Using a Strict policy might deter some guests, as only 10.4% of listings use it. Evaluate if potential revenue protection outweighs possible lower booking rates.
- Regularly review your cancellation policy against competitors and market demand shifts in Worth Matravers.
Worth Matravers STR Booking Lead Time Analysis (2026)
Average Booking Lead Time by Month
Booking Lead Time Insights for Worth Matravers
- The overall average booking lead time for vacation rentals in Worth Matravers is 76 days.
- Guests book furthest in advance for stays during August (average 91 days), likely coinciding with peak travel demand or local events.
- The shortest booking windows occur for stays in January (average 30 days), indicating more last-minute travel plans during this time.
- Seasonally, Summer (84 days avg.) sees the longest lead times, while Winter (56 days avg.) has the shortest, reflecting typical travel planning cycles.
Recommendations for Hosts
- Use the overall average lead time (76 days) as a baseline for your pricing and availability strategy in Worth Matravers.
- For August stays, consider implementing length-of-stay discounts or slightly higher rates for bookings made less than 91 days out to capitalize on advance planning.
- Target marketing efforts for the Summer season well in advance (at least 84 days) to capture early planners.
- Monitor your own booking lead times against these Worth Matravers averages to identify opportunities for dynamic pricing adjustments.
Popular & Essential Airbnb Amenities in Worth Matravers (2026)
Amenity Prevalence
Amenity Insights for Worth Matravers
- Popular amenities like Essentials, Heating, Hot water are common but not universal. Offering these can provide a competitive edge.
- Warning: Wifi is not universally provided but is considered essential globally. Ensure reliable Wifi is offered.
Recommendations for Hosts
- Consider adding popular differentiators like Essentials or Heating to increase appeal.
- Highlight unique or less common amenities you offer (e.g., hot tub, dedicated workspace, EV charger) in your listing description and photos.
- Regularly check competitor amenities in Worth Matravers to stay competitive.
Worth Matravers Airbnb Guest Demographics & Profile Analysis (2026)
Guest Profile Summary for Worth Matravers
- The typical guest profile for Airbnb in Worth Matravers consists of primarily domestic travelers (91%), often arriving from nearby England, typically belonging to the Post-2000s (Gen Z/Alpha) group (50%), primarily speaking English or French.
- Domestic travelers account for 91.2% of guests.
- Key international markets include United Kingdom (91.2%) and United States (1.4%).
- Top languages spoken are English (56.8%) followed by French (12.3%).
- A significant demographic segment is the Post-2000s (Gen Z/Alpha) group, representing 50% of guests.
Recommendations for Hosts
- Target domestic marketing efforts towards travelers from England and London.
- Tailor amenities and listing descriptions to appeal to the dominant Post-2000s (Gen Z/Alpha) demographic (e.g., highlight fast WiFi, smart home features, local guides).
- Highlight unique local experiences or amenities relevant to the primary guest profile.
- Consider seasonal promotions aligned with peak travel times for key origin markets.
Nearby Short-Term Rental Market Comparison
How does the Worth Matravers Airbnb market stack up against its neighbors? Compare key performance metrics like average monthly revenue, ADR, and occupancy rates in surrounding areas to understand the broader regional STR landscape.
| Market | Active Properties | Monthly Revenue | Daily Rate | Avg. Occupancy |
|---|---|---|---|---|
| Chew Magna | 13 | $7,041 | $430.65 | 44% |
| Englishcombe | 15 | $6,734 | $511.35 | 53% |
| Lambourn | 11 | $6,499 | $723.41 | 31% |
| East Knoyle | 10 | $6,300 | $407.06 | 44% |
| Long Sutton | 18 | $6,029 | $383.58 | 46% |
| Ashley | 13 | $5,497 | $364.68 | 54% |
| Freshford | 12 | $5,333 | $317.81 | 58% |
| Grosmont | 11 | $5,211 | $459.67 | 55% |
| Milverton | 10 | $5,067 | $377.17 | 48% |
| Southerndown | 16 | $5,064 | $409.45 | 46% |