Whitby Airbnb Market Analysis 2026: Short Term Rental Data & Vacation Rental Statistics in England, United Kingdom
Is Airbnb profitable in Whitby in 2026? Explore comprehensive Airbnb analytics for Whitby, England, United Kingdom to uncover income potential. This 2026 STR market report for Whitby, based on AirROI data from February 2025 to January 2026, reveals key trends in the market of 793 active listings.
Whether you're considering an Airbnb investment in Whitby, optimizing your existing vacation rental, or exploring rental arbitrage opportunities, understanding the Whitby Airbnb data is crucial. Leveraging the low regulation environment is key to maximizing your short term rental income potential. Let's dive into the specifics.
Key Whitby Airbnb Performance Metrics Overview
Monthly Airbnb Revenue Variations & Income Potential in Whitby (2026)
Understanding the monthly revenue variations for Airbnb listings in Whitby is key to maximizing your short term rental income potential. Seasonality significantly impacts earnings. Our analysis, based on data from the past 12 months, shows that the peak revenue month for STRs in Whitby is typically August, while January often presents the lowest earnings, highlighting opportunities for strategic pricing adjustments during shoulder and low seasons. Explore the typical Airbnb income in Whitby across different performance tiers:
- Best-in-class properties (Top 10%) achieve $5,846+ monthly, often utilizing dynamic pricing and superior guest experiences.
- Strong performing properties (Top 25%) earn $3,963 or more, indicating effective management and desirable locations/amenities.
- Typical properties (Median) generate around $2,566 per month, representing the average market performance.
- Entry-level properties (Bottom 25%) see earnings around $1,374, often with potential for optimization.
Average Monthly Airbnb Earnings Trend in Whitby
Whitby Airbnb Occupancy Rate Trends (2026)
Maximize your bookings by understanding the Whitby STR occupancy trends. Seasonal demand shifts significantly influence how often properties are booked. Typically, Augustsees the highest demand (peak season occupancy), while January experiences the lowest (low season). Effective strategies, like adjusting minimum stays or offering promotions, can boost occupancy during slower periods. Here's how different property tiers perform in Whitby:
- Best-in-class properties (Top 10%) achieve 76%+ occupancy, indicating high desirability and potentially optimized availability.
- Strong performing properties (Top 25%) maintain 61% or higher occupancy, suggesting good market fit and guest satisfaction.
- Typical properties (Median) have an occupancy rate around 41%.
- Entry-level properties (Bottom 25%) average 21% occupancy, potentially facing higher vacancy.
Average Monthly Occupancy Rate Trend in Whitby
Average Daily Rate (ADR) Airbnb Trends in Whitby (2026)
Effective short term rental pricing strategy in Whitby involves understanding monthly ADR fluctuations. The Average Daily Rate (ADR) for Airbnb in Whitby typically peaks in August and dips lowest during March. Leveraging Airbnb dynamic pricing tools or strategies based on this seasonality can significantly boost revenue. Here's a look at the typical nightly rates achieved:
- Best-in-class properties (Top 10%) command rates of $476+ per night, often due to premium features or locations.
- Strong performing properties (Top 25%) achieve nightly rates of $291 or more.
- Typical properties (Median) charge around $200 per night.
- Entry-level properties (Bottom 25%) earn around $152 per night.
Average Daily Rate (ADR) Trend by Month in Whitby
Get Live Whitby Market Intelligence 👇

Explore Real-time Analytics
Airbnb Seasonality Analysis & Trends in Whitby (2026)
Peak Season (August, July, May)
- Revenue averages $4,481 per month
- Occupancy rates average 55.4%
- Daily rates average $277
Shoulder Season
- Revenue averages $2,982 per month
- Occupancy maintains around 42.2%
- Daily rates hold near $253
Low Season (January, February, November)
- Revenue drops to average $1,856 per month
- Occupancy decreases to average 29.5%
- Daily rates adjust to average $236
Seasonality Insights for Whitby
- The Airbnb seasonality in Whitby shows highly seasonal trends requiring careful strategy. While the sections above show seasonal averages, it's also insightful to look at the extremes:
- During the high season, the absolute peak month showcases Whitby's highest earning potential, with monthly revenues capable of climbing to $5,456, occupancy reaching a high of 64.1%, and ADRs peaking at $286.
- Conversely, the slowest single month of the year, typically falling within the low season, marks the market's lowest point. In this month, revenue might dip to $1,383, occupancy could drop to 21.0%, and ADRs may adjust down to $227.
- Understanding both the seasonal averages and these monthly peaks and troughs in revenue, occupancy, and ADR is crucial for maximizing your Airbnb profit potential in Whitby.
Seasonal Strategies for Maximizing Profit
- Peak Season: Maximize revenue through premium pricing and potentially longer minimum stays. Ensure high availability.
- Low Season: Offer competitive pricing, special promotions (e.g., extended stay discounts), and flexible cancellation policies. Target off-season travelers like remote workers or budget-conscious guests.
- Shoulder Seasons: Implement dynamic pricing that balances peak and low rates. Target weekend travelers or specific events. Offer slightly more flexible terms than peak season.
- Regularly analyze your own performance against these Whitby seasonality benchmarks and adjust your pricing and availability strategy accordingly.
Best Areas for Airbnb Investment in Whitby (2026)
Exploring the top neighborhoods for short-term rentals in Whitby? This section highlights key areas, outlining why they are attractive for hosts and guests, along with notable local attractions. Consider these locations based on your target guest profile and investment strategy.
| Neighborhood / Area | Why Host Here? (Target Guests & Appeal) | Key Attractions & Landmarks |
|---|---|---|
| Whitby Harbour | Whitby Harbour is a historic part of the town, known for its picturesque views and vibrant atmosphere. It attracts tourists seeking a charming coastal experience, with access to local restaurants and shops. | Whitby Abbey, Captain Cook Memorial Museum, Whitby Beach, Whitby Lifeboat Museum, Pannett Park |
| Old Town | The Old Town area is rich in history and character, showcasing cobbled streets and unique architecture. It is a popular spot for visitors wanting to explore the roots of Whitby and enjoy its local culture. | Whitby Old Town, Museum of Whitby Jet, Dracula Experience, St. Mary's Church, 10 Church Street, The Swing Bridge |
| West Cliff | West Cliff is known for its stunning beach views and proximity to the Whitby Pavilion and other entertainment venues. It's ideal for beachgoers and families looking for a relaxing getaway. | Whitby Beach, Whitby Pavilion, West Cliff Lift, Scarborough Road, Golden Sands |
| East Cliff | East Cliff offers amazing views of the town and the North Sea, and is home to the iconic 199 steps leading to the abbey. It's a favorite spot for those looking to capture stunning photographs. | 199 Steps, Whitby Abbey, St. Mary's Church, East Cliff, North Sea views |
| Sandsend | Sandsend is a beautiful village just a short distance from Whitby, known for its sandy beaches and tranquil ambiance. It's perfect for those who want a peaceful retreat near the sea. | Sandsend Beach, Café and shops, Whitby to Sandsend coastal walk, Sandsend River |
| Ruswarp | Ruswarp is a quaint village just outside Whitby, offering a more rural escape. Visitors enjoy the scenic countryside and the nearby River Esk. | Ruswarp Esk Valley, Ruswarp Pleasure Boats, local walks and countryside views, St. John's Church |
| Goathland | Goathland, often referred to as 'Aidensfield' from the TV show Heartbeat, is a picturesque village with traditional charm. It's a hit with fans of the show and those seeking scenic hikes in the North York Moors. | Goathland Station, North York Moors Railway, Mallyan Spout Waterfall, local pubs and tea rooms |
| North York Moors National Park | The national park surrounding Whitby is renowned for its stunning landscapes and hiking trails, attracting adventure seekers and nature lovers alike. | Hiking trails, Daisy Nook, beautiful viewpoints, wildlife watching, historical sites within the park |
Understanding Airbnb License Requirements & STR Laws in Whitby (2026)
While Whitby, England, United Kingdom currently shows low STR regulations, specific Airbnb license requirements might still exist or change. Always verify the latest short term rental regulations and Airbnb license requirements directly with local government authorities for Whitby to ensure full compliance before hosting.
(Source: AirROI data, 2026, based on 0% licensed listings)
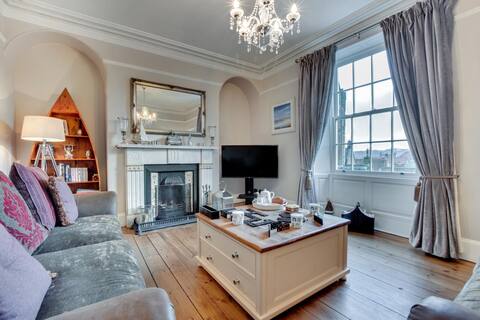
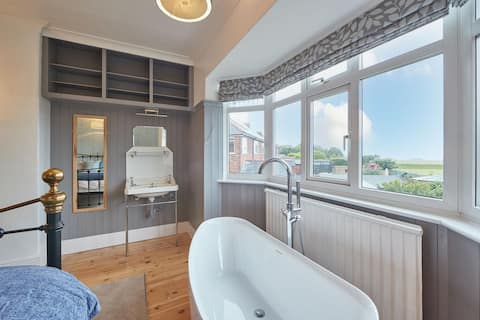
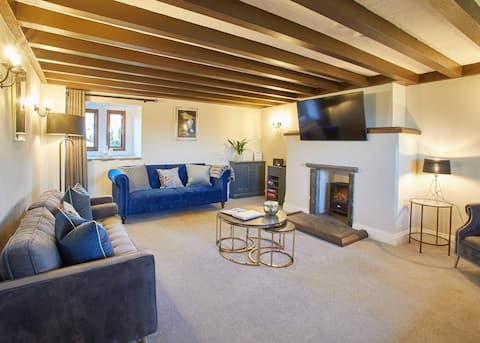
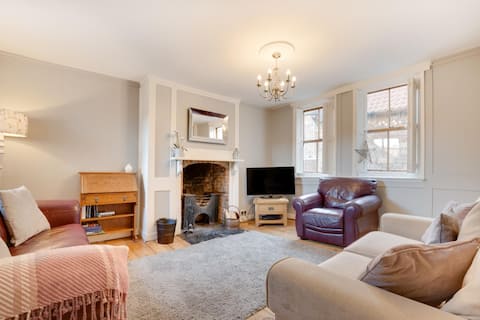
Top Performing Airbnb Properties in Whitby (2026)
Benchmark your potential! Explore examples of top-performing Airbnb properties in Whitbybased on Trailing Twelve Month (TTM) revenue. Analyze their characteristics, revenue, occupancy rate, and ADR to understand what drives success in this market.
4 Bed in Whitby (oc-w474)
Entire Place • 4 bedrooms
5 Bed in Whitby (oc-b30092)
Entire Place • 5 bedrooms

Family Getaway! Whitby - Hot Tub - Gaming
Entire Place • 5 bedrooms
Cliff Side Property with Spectacular Whitby Views
Entire Place • 5 bedrooms
2 Bed in Whitby (oc-w003)
Entire Place • 2 bedrooms
Rose and Crown Yard
Entire Place • 2 bedrooms
Note: Performance varies based on location, size, amenities, seasonality, and management quality. Data reflects the past 12 months.
Top Performing Airbnb Hosts in Whitby (2026)
Learn from the best! This table showcases top-performing Airbnb hosts in Whitby based on the number of properties managed and estimated total revenue over the past year. Analyze their scale and performance metrics.
| Host Name | Properties | Grossing Revenue | Stay Reviews | Avg Rating |
|---|---|---|---|---|
| Host & Stay | 150 | $4,997,182 | 5868 | 4.59/5.0 |
| Ingrid Flute'S Yorks Hol Cotta | 97 | $3,516,693 | 552 | 4.59/5.0 |
| Cottages | 99 | $2,967,936 | 1266 | 4.69/5.0 |
| Host & Stay | 24 | $660,664 | 875 | 4.52/5.0 |
| Debra | 17 | $411,678 | 1147 | 4.78/5.0 |
| Amy Emily And Amanda | 2 | $215,025 | 205 | 4.96/5.0 |
| Finest Retreats | 4 | $206,163 | 114 | 4.66/5.0 |
| Cara | 6 | $200,770 | 369 | 4.73/5.0 |
| Stephen | 4 | $198,221 | 314 | 4.87/5.0 |
| Pass The Property | 6 | $187,827 | 112 | 4.65/5.0 |
Analyzing the strategies of top hosts, such as their property selection, pricing, and guest communication, can offer valuable lessons for optimizing your own Airbnb operations in Whitby.
Dive Deeper: Advanced Whitby STR Market Data (2026)
Ready to unlock more insights? AirROI provides access to advanced metrics and comprehensive Airbnb data for Whitby. Explore detailed analytics beyond this report to refine your investment strategy, optimize pricing, and maximize your vacation rental profits.
Explore Advanced MetricsWhitby Short-Term Rental Market Composition (2026): Property & Room Types
Room Type Distribution
Property Type Distribution
Market Composition Insights for Whitby
- The Whitby Airbnb market composition is heavily skewed towards Entire Home/Apt listings, which make up 90.5% of the 793 active rentals. This indicates strong guest preference for privacy and space.
- Looking at the property type distribution in Whitby, House properties are the most common (58%), reflecting the local real estate landscape.
- Houses represent a significant 58% portion, catering likely to families or larger groups.
- The presence of 7.1% Hotel/Boutique listings indicates integration with traditional hospitality.
- Smaller segments like others, unique stays, outdoor/unique (combined 2.2%) offer potential for unique stay experiences.
Whitby Airbnb Room Capacity Analysis (2026): Bedroom Distribution
Distribution of Listings by Number of Bedrooms
Room Capacity Insights for Whitby
- The dominant room capacity in Whitby is 2 bedrooms listings, making up 38.6% of the market. This suggests a strong demand for properties suitable for couples or solo travelers.
- Together, 2 bedrooms and 1 bedroom properties represent 63.1% of the active Airbnb listings in Whitby, indicating a high concentration in these sizes.
- A significant 33.7% of listings offer 3+ bedrooms, catering to larger groups and families seeking more space in Whitby.
Whitby Vacation Rental Guest Capacity Trends (2026)
Distribution of Listings by Guest Capacity
Guest Capacity Insights for Whitby
- The most common guest capacity trend in Whitby vacation rentals is listings accommodating 4 guests (36.3%). This suggests the primary traveler segment is likely small families or groups.
- Properties designed for 4 guests and 2 guests dominate the Whitby STR market, accounting for 57.2% of listings.
- 28.6% of properties accommodate 6+ guests, serving the market segment for larger families or group travel in Whitby.
- On average, properties in Whitby are equipped to host 4.3 guests.
Whitby Airbnb Booking Patterns (2026): Available vs. Booked Days
Available Days Distribution
Booked Days Distribution
Booking Pattern Insights for Whitby
- The most common availability pattern in Whitby falls within the 271-366 days range, representing 41.4% of listings. This suggests many properties have significant open periods on their calendars.
- Approximately 74.1% of listings show high availability (181+ days open annually), indicating potential for increased bookings or specific owner usage patterns.
- For booked days, the 91-180 days range is most frequent in Whitby (33%), reflecting common guest stay durations or potential owner blocking patterns.
- A notable 27.1% of properties secure long booking periods (181+ days booked per year), highlighting successful long-term rental strategies or significant owner usage.
Whitby Airbnb Minimum Stay Requirements Analysis
Distribution of Listings by Minimum Night Requirement
1 Night
180 listings
22.7% of total
2 Nights
216 listings
27.2% of total
3 Nights
64 listings
8.1% of total
4-6 Nights
6 listings
0.8% of total
30+ Nights
327 listings
41.2% of total
Key Insights
- The most prevalent minimum stay requirement in Whitby is 30+ Nights, adopted by 41.2% of listings. This highlights the market's preference for longer commitments.
- A significant segment (41.2%) caters to monthly stays (30+ nights) in Whitby, pointing to opportunities in the extended-stay market.
Recommendations
- Align with the market by considering a 30+ Nights minimum stay, as 41.2% of Whitby hosts use this setting.
- If feasible, allowing 1-night stays, especially midweek or during low season, could capture last-minute bookings, as only 22.7% currently do.
- Explore offering discounts for stays of 30+ nights to attract the 41.2% of the market seeking extended stays.
- Adjust minimum nights based on seasonality – potentially shorter during low season and longer during peak demand periods in Whitby.
Whitby Airbnb Cancellation Policy Trends Analysis (2026)
Limited
11 listings
1.4% of total
Non-refundable
2 listings
0.3% of total
Super Strict 60 Days
227 listings
28.7% of total
Refundable
6 listings
0.8% of total
Super Strict 30 Days
15 listings
1.9% of total
Flexible
65 listings
8.2% of total
Moderate
94 listings
11.9% of total
Firm
295 listings
37.3% of total
Strict
76 listings
9.6% of total
Cancellation Policy Insights for Whitby
- The prevailing Airbnb cancellation policy trend in Whitby is Firm, used by 37.3% of listings.
- There's a relatively balanced mix between guest-friendly (20.1%) and stricter (46.9%) policies, offering choices for different guest needs.
- Strict cancellation policies are quite rare (9.6%), potentially making listings with this policy less competitive unless justified by high demand or property type.
Recommendations for Hosts
- Consider adopting a Firm policy to align with the 37.3% market standard in Whitby.
- Using a Strict policy might deter some guests, as only 9.6% of listings use it. Evaluate if potential revenue protection outweighs possible lower booking rates.
- Regularly review your cancellation policy against competitors and market demand shifts in Whitby.
Whitby STR Booking Lead Time Analysis (2026)
Average Booking Lead Time by Month
Booking Lead Time Insights for Whitby
- The overall average booking lead time for vacation rentals in Whitby is 83 days.
- Guests book furthest in advance for stays during October (average 116 days), likely coinciding with peak travel demand or local events.
- The shortest booking windows occur for stays in February (average 46 days), indicating more last-minute travel plans during this time.
- Seasonally, Fall (95 days avg.) sees the longest lead times, while Winter (70 days avg.) has the shortest, reflecting typical travel planning cycles.
Recommendations for Hosts
- Use the overall average lead time (83 days) as a baseline for your pricing and availability strategy in Whitby.
- For October stays, consider implementing length-of-stay discounts or slightly higher rates for bookings made less than 116 days out to capitalize on advance planning.
- Target marketing efforts for the Fall season well in advance (at least 95 days) to capture early planners.
- Monitor your own booking lead times against these Whitby averages to identify opportunities for dynamic pricing adjustments.
Popular & Essential Airbnb Amenities in Whitby (2026)
Amenity Prevalence
Amenity Insights for Whitby
- Essential amenities in Whitby that guests expect include: TV, Wifi, Smoke alarm, Heating. Lacking these (any) could significantly impact bookings.
- Popular amenities like Kitchen, Bed linens, Hot water are common but not universal. Offering these can provide a competitive edge.
Recommendations for Hosts
- Ensure your listing includes all essential amenities for Whitby: TV, Wifi, Smoke alarm, Heating.
- Prioritize adding missing essentials: TV, Wifi, Smoke alarm, Heating.
- Consider adding popular differentiators like Kitchen or Bed linens to increase appeal.
- Highlight unique or less common amenities you offer (e.g., hot tub, dedicated workspace, EV charger) in your listing description and photos.
- Regularly check competitor amenities in Whitby to stay competitive.
Whitby Airbnb Guest Demographics & Profile Analysis (2026)
Guest Profile Summary for Whitby
- The typical guest profile for Airbnb in Whitby consists of primarily domestic travelers (92%), often arriving from nearby England, typically belonging to the Post-2000s (Gen Z/Alpha) group (50%), primarily speaking English or French.
- Domestic travelers account for 91.7% of guests.
- Key international markets include United Kingdom (91.7%) and United States (2.4%).
- Top languages spoken are English (75%) followed by French (7%).
- A significant demographic segment is the Post-2000s (Gen Z/Alpha) group, representing 50% of guests.
Recommendations for Hosts
- Target domestic marketing efforts towards travelers from England and London.
- Tailor amenities and listing descriptions to appeal to the dominant Post-2000s (Gen Z/Alpha) demographic (e.g., highlight fast WiFi, smart home features, local guides).
- Highlight unique local experiences or amenities relevant to the primary guest profile.
- Consider seasonal promotions aligned with peak travel times for key origin markets.
Nearby Short-Term Rental Market Comparison
How does the Whitby Airbnb market stack up against its neighbors? Compare key performance metrics like average monthly revenue, ADR, and occupancy rates in surrounding areas to understand the broader regional STR landscape.
| Market | Active Properties | Monthly Revenue | Daily Rate | Avg. Occupancy |
|---|---|---|---|---|
| Stamford Bridge | 11 | $4,828 | $418.84 | 39% |
| Grinton | 12 | $4,363 | $338.85 | 48% |
| Ellingham | 12 | $4,350 | $318.71 | 51% |
| High Newton by the Sea | 19 | $4,216 | $506.29 | 39% |
| Tollerton | 12 | $4,121 | $303.75 | 52% |
| Holy Island | 14 | $4,102 | $326.39 | 58% |
| Newholm-cum-Dunsley | 19 | $3,988 | $370.23 | 43% |
| Huntington | 19 | $3,823 | $233.48 | 53% |
| Huggate | 10 | $3,763 | $279.44 | 47% |
| Bishop Monkton | 14 | $3,719 | $310.92 | 46% |