West Suffolk Airbnb Market Analysis 2026: Short Term Rental Data & Vacation Rental Statistics in England, United Kingdom
Is Airbnb profitable in West Suffolk in 2026? Explore comprehensive Airbnb analytics for West Suffolk, England, United Kingdom to uncover income potential. This 2026 STR market report for West Suffolk, based on AirROI data from February 2025 to January 2026, reveals key trends in the market of 426 active listings.
Whether you're considering an Airbnb investment in West Suffolk, optimizing your existing vacation rental, or exploring rental arbitrage opportunities, understanding the West Suffolk Airbnb data is crucial. Leveraging the low regulation environment is key to maximizing your short term rental income potential. Let's dive into the specifics.
Key West Suffolk Airbnb Performance Metrics Overview
Monthly Airbnb Revenue Variations & Income Potential in West Suffolk (2026)
Understanding the monthly revenue variations for Airbnb listings in West Suffolk is key to maximizing your short term rental income potential. Seasonality significantly impacts earnings. Our analysis, based on data from the past 12 months, shows that the peak revenue month for STRs in West Suffolk is typically August, while January often presents the lowest earnings, highlighting opportunities for strategic pricing adjustments during shoulder and low seasons. Explore the typical Airbnb income in West Suffolk across different performance tiers:
- Best-in-class properties (Top 10%) achieve $4,715+ monthly, often utilizing dynamic pricing and superior guest experiences.
- Strong performing properties (Top 25%) earn $3,209 or more, indicating effective management and desirable locations/amenities.
- Typical properties (Median) generate around $1,921 per month, representing the average market performance.
- Entry-level properties (Bottom 25%) see earnings around $943, often with potential for optimization.
Average Monthly Airbnb Earnings Trend in West Suffolk
West Suffolk Airbnb Occupancy Rate Trends (2026)
Maximize your bookings by understanding the West Suffolk STR occupancy trends. Seasonal demand shifts significantly influence how often properties are booked. Typically, Augustsees the highest demand (peak season occupancy), while January experiences the lowest (low season). Effective strategies, like adjusting minimum stays or offering promotions, can boost occupancy during slower periods. Here's how different property tiers perform in West Suffolk:
- Best-in-class properties (Top 10%) achieve 81%+ occupancy, indicating high desirability and potentially optimized availability.
- Strong performing properties (Top 25%) maintain 66% or higher occupancy, suggesting good market fit and guest satisfaction.
- Typical properties (Median) have an occupancy rate around 43%.
- Entry-level properties (Bottom 25%) average 23% occupancy, potentially facing higher vacancy.
Average Monthly Occupancy Rate Trend in West Suffolk
Average Daily Rate (ADR) Airbnb Trends in West Suffolk (2026)
Effective short term rental pricing strategy in West Suffolk involves understanding monthly ADR fluctuations. The Average Daily Rate (ADR) for Airbnb in West Suffolk typically peaks in July and dips lowest during March. Leveraging Airbnb dynamic pricing tools or strategies based on this seasonality can significantly boost revenue. Here's a look at the typical nightly rates achieved:
- Best-in-class properties (Top 10%) command rates of $313+ per night, often due to premium features or locations.
- Strong performing properties (Top 25%) achieve nightly rates of $207 or more.
- Typical properties (Median) charge around $143 per night.
- Entry-level properties (Bottom 25%) earn around $103 per night.
Average Daily Rate (ADR) Trend by Month in West Suffolk
Get Live West Suffolk Market Intelligence 👇

Explore Real-time Analytics
Airbnb Seasonality Analysis & Trends in West Suffolk (2026)
Peak Season (August, July, October)
- Revenue averages $3,046 per month
- Occupancy rates average 50.9%
- Daily rates average $200
Shoulder Season
- Revenue averages $2,519 per month
- Occupancy maintains around 45.1%
- Daily rates hold near $191
Low Season (January, February, November)
- Revenue drops to average $1,888 per month
- Occupancy decreases to average 37.4%
- Daily rates adjust to average $186
Seasonality Insights for West Suffolk
- The Airbnb seasonality in West Suffolk shows moderate seasonality with distinct peak and low periods. While the sections above show seasonal averages, it's also insightful to look at the extremes:
- During the high season, the absolute peak month showcases West Suffolk's highest earning potential, with monthly revenues capable of climbing to $3,234, occupancy reaching a high of 53.0%, and ADRs peaking at $202.
- Conversely, the slowest single month of the year, typically falling within the low season, marks the market's lowest point. In this month, revenue might dip to $1,593, occupancy could drop to 30.3%, and ADRs may adjust down to $178.
- Understanding both the seasonal averages and these monthly peaks and troughs in revenue, occupancy, and ADR is crucial for maximizing your Airbnb profit potential in West Suffolk.
Seasonal Strategies for Maximizing Profit
- Peak Season: Maximize revenue through premium pricing and potentially longer minimum stays. Ensure high availability.
- Low Season: Offer competitive pricing, special promotions (e.g., extended stay discounts), and flexible cancellation policies. Target off-season travelers like remote workers or budget-conscious guests.
- Shoulder Seasons: Implement dynamic pricing that balances peak and low rates. Target weekend travelers or specific events. Offer slightly more flexible terms than peak season.
- Regularly analyze your own performance against these West Suffolk seasonality benchmarks and adjust your pricing and availability strategy accordingly.
Best Areas for Airbnb Investment in West Suffolk (2026)
Exploring the top neighborhoods for short-term rentals in West Suffolk? This section highlights key areas, outlining why they are attractive for hosts and guests, along with notable local attractions. Consider these locations based on your target guest profile and investment strategy.
| Neighborhood / Area | Why Host Here? (Target Guests & Appeal) | Key Attractions & Landmarks |
|---|---|---|
| Bury St Edmunds | Historic market town with beautiful architecture, rich history, and a vibrant cultural scene. A popular destination for tourists and those visiting the nearby Abbey Gardens and St Edmundsbury Cathedral. | Abbey Gardens, St Edmundsbury Cathedral, Bury St Edmunds Theatre, Greene King Brewery, Bury St Edmunds Market, The Angel Hotel |
| Newmarket | Famous for horse racing and training, Newmarket attracts visitors to its racecourses and historical sites, making it a unique location for horse racing enthusiasts and tourists alike. | Newmarket Racecourses, National Horse Racing Museum, Palace House, The Gallops, The Jockey Club, The Great House |
| Sudbury | A quaint market town with a strong arts and crafts heritage, Sudbury is appealing to visitors interested in exploring the Stour Valley and its scenic countryside. | The Gainsborough Museum, Cambs & Suffolk Railway, The Dedham Vale, Sudbury Hall, Market Hill, The Croft |
| Haverhill | A growing town with a blend of modern amenities and a rich history. It appeals to families visiting the nearby attractions and those looking for a more affordable accommodation option. | Haverhill Arts Centre, East Town Park, The Haverhill Gallery, Haverhill Golf Club, The Old Police Station, Centrica Haverhill |
| Mildenhall | Known for its history and proximity to RAF Mildenhall, this town attracts visitors related to the base as well as those exploring the Lakenheath Fen National Nature Reserve. | Mildenhall Stadium, The Mildenhall Museum, Lakenheath Fen, The Old Bell Inn, Hidden History of Mildenhall, Mildenhall Tourist Information |
| Lakenheath | A picturesque village with scenic views and proximity to nature reserves, ideal for eco-tourism and those looking to escape city life. | Lakenheath Fen, St Mary's Church, Lakenheath Village Store, The Lakenheath Fen Nature Reserve, The Dragonfly |
| Long Melford | Famous for its beautiful wool churches and long village green, Long Melford is ideal for visitors interested in history and local crafts, making it a charming place to stay. | Holy Trinity Church, Long Melford Country Park, Melford Hall, The Long Melford Heritage Centre, Long Melford Antiques Centre, The Village Green |
| Bramford | A charming village with close ties to the nearby historic city of Ipswich, Bramford serves as a peaceful base for exploring the surrounding areas and offers local amenities. | St Mary the Virgin Church, Bramford Park, Local walking trails, The Bramford Mill, Nearby Ipswich attractions |
Understanding Airbnb License Requirements & STR Laws in West Suffolk (2026)
While West Suffolk, England, United Kingdom currently shows low STR regulations, specific Airbnb license requirements might still exist or change. Always verify the latest short term rental regulations and Airbnb license requirements directly with local government authorities for West Suffolk to ensure full compliance before hosting.
(Source: AirROI data, 2026, finding no licensed listings among those analyzed)
Top Performing Airbnb Properties in West Suffolk (2026)
Benchmark your potential! Explore examples of top-performing Airbnb properties in West Suffolkbased on Trailing Twelve Month (TTM) revenue. Analyze their characteristics, revenue, occupancy rate, and ADR to understand what drives success in this market.

Country House With Indoor Pool
Entire Place • 5 bedrooms
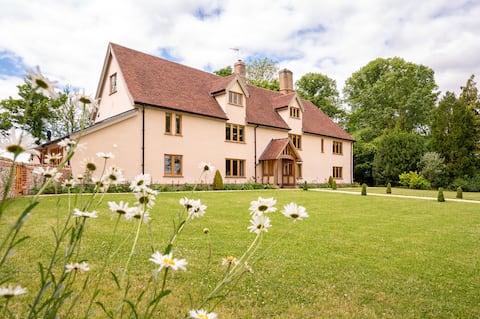
Fabulous 16th C. farmhouse in stunning countryside
Entire Place • 6 bedrooms
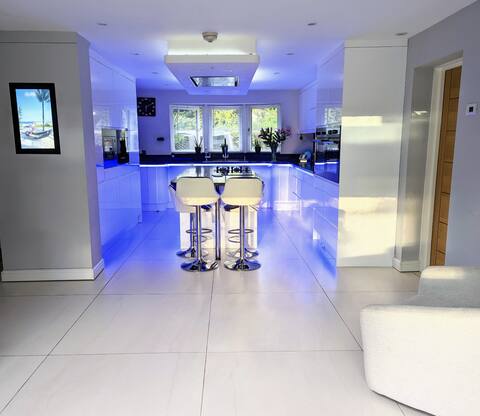
A modern "smart home" unique to all
Entire Place • 5 bedrooms

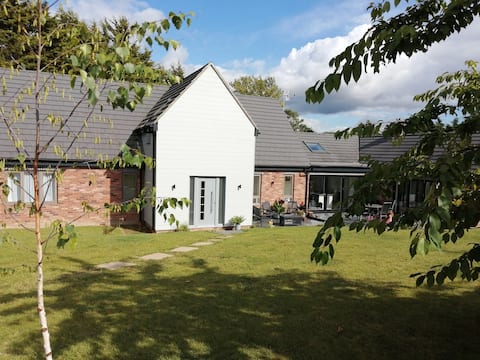
3 Bed in Sedge Fen (oc-b28087)
Entire Place • 3 bedrooms

Walnut Tree Barn
Entire Place • 4 bedrooms
The Highlands: 5 bed 5 bath - Huge Sociable House!
Entire Place • 5 bedrooms
Note: Performance varies based on location, size, amenities, seasonality, and management quality. Data reflects the past 12 months.
Top Performing Airbnb Hosts in West Suffolk (2026)
Learn from the best! This table showcases top-performing Airbnb hosts in West Suffolk based on the number of properties managed and estimated total revenue over the past year. Analyze their scale and performance metrics.
| Host Name | Properties | Grossing Revenue | Stay Reviews | Avg Rating |
|---|---|---|---|---|
| Kathryn | 13 | $457,759 | 355 | 4.90/5.0 |
| Cottages | 8 | $345,472 | 146 | 4.84/5.0 |
| Suffolk Secrets | 6 | $278,176 | 32 | 4.98/5.0 |
| Katelynn | 1 | $215,901 | 30 | 4.53/5.0 |
| Emily | 2 | $201,589 | 65 | 5.00/5.0 |
| Alex | 3 | $188,375 | 206 | 4.94/5.0 |
| Aaron | 6 | $160,650 | 577 | 4.86/5.0 |
| Paul | 1 | $145,334 | 51 | 4.88/5.0 |
| Ian | 3 | $135,965 | 183 | 5.00/5.0 |
| David Burr | 6 | $121,727 | 148 | 4.68/5.0 |
Analyzing the strategies of top hosts, such as their property selection, pricing, and guest communication, can offer valuable lessons for optimizing your own Airbnb operations in West Suffolk.
Dive Deeper: Advanced West Suffolk STR Market Data (2026)
Ready to unlock more insights? AirROI provides access to advanced metrics and comprehensive Airbnb data for West Suffolk. Explore detailed analytics beyond this report to refine your investment strategy, optimize pricing, and maximize your vacation rental profits.
Explore Advanced MetricsWest Suffolk Short-Term Rental Market Composition (2026): Property & Room Types
Room Type Distribution
Property Type Distribution
Market Composition Insights for West Suffolk
- The West Suffolk Airbnb market composition is heavily skewed towards Entire Home/Apt listings, which make up 76.3% of the 426 active rentals. This indicates strong guest preference for privacy and space.
- Looking at the property type distribution in West Suffolk, House properties are the most common (55.6%), reflecting the local real estate landscape.
- Houses represent a significant 55.6% portion, catering likely to families or larger groups.
- The presence of 10.3% Hotel/Boutique listings indicates integration with traditional hospitality.
- Smaller segments like unique stays (combined 2.8%) offer potential for unique stay experiences.
West Suffolk Airbnb Room Capacity Analysis (2026): Bedroom Distribution
Distribution of Listings by Number of Bedrooms
Room Capacity Insights for West Suffolk
- The dominant room capacity in West Suffolk is 1 bedroom listings, making up 35% of the market. This suggests a strong demand for properties suitable for couples or solo travelers.
- Together, 1 bedroom and 2 bedrooms properties represent 61.1% of the active Airbnb listings in West Suffolk, indicating a high concentration in these sizes.
West Suffolk Vacation Rental Guest Capacity Trends (2026)
Distribution of Listings by Guest Capacity
Guest Capacity Insights for West Suffolk
- The most common guest capacity trend in West Suffolk vacation rentals is listings accommodating 2 guests (27%). This suggests the primary traveler segment is likely couples or solo travelers.
- Properties designed for 2 guests and 4 guests dominate the West Suffolk STR market, accounting for 51.2% of listings.
- 20.2% of properties accommodate 6+ guests, serving the market segment for larger families or group travel in West Suffolk.
- On average, properties in West Suffolk are equipped to host 3.2 guests.
West Suffolk Airbnb Booking Patterns (2026): Available vs. Booked Days
Available Days Distribution
Booked Days Distribution
Booking Pattern Insights for West Suffolk
- The most common availability pattern in West Suffolk falls within the 271-366 days range, representing 38.3% of listings. This suggests many properties have significant open periods on their calendars.
- Approximately 69.8% of listings show high availability (181+ days open annually), indicating potential for increased bookings or specific owner usage patterns.
- For booked days, the 91-180 days range is most frequent in West Suffolk (31.9%), reflecting common guest stay durations or potential owner blocking patterns.
- A notable 31.7% of properties secure long booking periods (181+ days booked per year), highlighting successful long-term rental strategies or significant owner usage.
West Suffolk Airbnb Minimum Stay Requirements Analysis
Distribution of Listings by Minimum Night Requirement
1 Night
154 listings
36.2% of total
2 Nights
137 listings
32.2% of total
3 Nights
35 listings
8.2% of total
4-6 Nights
7 listings
1.6% of total
7-29 Nights
13 listings
3.1% of total
30+ Nights
80 listings
18.8% of total
Key Insights
- The most prevalent minimum stay requirement in West Suffolk is 1 Night, adopted by 36.2% of listings. This highlights the market's preference for shorter, flexible bookings.
- A strong majority (68.4%) of the West Suffolk Airbnb data shows acceptance of very short stays (1-2 nights), indicating a dynamic, high-turnover market.
- A significant segment (18.8%) caters to monthly stays (30+ nights) in West Suffolk, pointing to opportunities in the extended-stay market.
Recommendations
- Align with the market by considering a 1 Night minimum stay, as 36.2% of West Suffolk hosts use this setting.
- Explore offering discounts for stays of 30+ nights to attract the 18.8% of the market seeking extended stays.
- Adjust minimum nights based on seasonality – potentially shorter during low season and longer during peak demand periods in West Suffolk.
West Suffolk Airbnb Cancellation Policy Trends Analysis (2026)
Super Strict 30 Days
5 listings
1.2% of total
Refundable
5 listings
1.2% of total
Super Strict 60 Days
19 listings
4.5% of total
Flexible
117 listings
27.5% of total
Moderate
125 listings
29.4% of total
Firm
116 listings
27.3% of total
Strict
38 listings
8.9% of total
Cancellation Policy Insights for West Suffolk
- The prevailing Airbnb cancellation policy trend in West Suffolk is Moderate, used by 29.4% of listings.
- There's a relatively balanced mix between guest-friendly (56.9%) and stricter (36.2%) policies, offering choices for different guest needs.
- Strict cancellation policies are quite rare (8.9%), potentially making listings with this policy less competitive unless justified by high demand or property type.
Recommendations for Hosts
- Consider adopting a Moderate policy to align with the 29.4% market standard in West Suffolk.
- Using a Strict policy might deter some guests, as only 8.9% of listings use it. Evaluate if potential revenue protection outweighs possible lower booking rates.
- Regularly review your cancellation policy against competitors and market demand shifts in West Suffolk.
West Suffolk STR Booking Lead Time Analysis (2026)
Average Booking Lead Time by Month
Booking Lead Time Insights for West Suffolk
- The overall average booking lead time for vacation rentals in West Suffolk is 55 days.
- Guests book furthest in advance for stays during December (average 73 days), likely coinciding with peak travel demand or local events.
- The shortest booking windows occur for stays in February (average 32 days), indicating more last-minute travel plans during this time.
- Seasonally, Summer (66 days avg.) sees the longest lead times, while Winter (46 days avg.) has the shortest, reflecting typical travel planning cycles.
Recommendations for Hosts
- Use the overall average lead time (55 days) as a baseline for your pricing and availability strategy in West Suffolk.
- For December stays, consider implementing length-of-stay discounts or slightly higher rates for bookings made less than 73 days out to capitalize on advance planning.
- Target marketing efforts for the Summer season well in advance (at least 66 days) to capture early planners.
- Monitor your own booking lead times against these West Suffolk averages to identify opportunities for dynamic pricing adjustments.
Popular & Essential Airbnb Amenities in West Suffolk (2026)
Amenity Prevalence
Amenity Insights for West Suffolk
- Popular amenities like Smoke alarm, Heating, Wifi are common but not universal. Offering these can provide a competitive edge.
- Warning: Wifi is not universally provided but is considered essential globally. Ensure reliable Wifi is offered.
Recommendations for Hosts
- Consider adding popular differentiators like Smoke alarm or Heating to increase appeal.
- Highlight unique or less common amenities you offer (e.g., hot tub, dedicated workspace, EV charger) in your listing description and photos.
- Regularly check competitor amenities in West Suffolk to stay competitive.
West Suffolk Airbnb Guest Demographics & Profile Analysis (2026)
Guest Profile Summary for West Suffolk
- The typical guest profile for Airbnb in West Suffolk consists of primarily domestic travelers (85%), often arriving from nearby England, typically belonging to the Post-2000s (Gen Z/Alpha) group (50%), primarily speaking English or French.
- Domestic travelers account for 85.0% of guests.
- Key international markets include United Kingdom (85%) and United States (6.5%).
- Top languages spoken are English (67.3%) followed by French (9.5%).
- A significant demographic segment is the Post-2000s (Gen Z/Alpha) group, representing 50% of guests.
Recommendations for Hosts
- Target domestic marketing efforts towards travelers from England and London.
- Tailor amenities and listing descriptions to appeal to the dominant Post-2000s (Gen Z/Alpha) demographic (e.g., highlight fast WiFi, smart home features, local guides).
- Highlight unique local experiences or amenities relevant to the primary guest profile.
- Consider seasonal promotions aligned with peak travel times for key origin markets.
Nearby Short-Term Rental Market Comparison
How does the West Suffolk Airbnb market stack up against its neighbors? Compare key performance metrics like average monthly revenue, ADR, and occupancy rates in surrounding areas to understand the broader regional STR landscape.
| Market | Active Properties | Monthly Revenue | Daily Rate | Avg. Occupancy |
|---|---|---|---|---|
| Dorney | 11 | $7,510 | $743.63 | 39% |
| Wraysbury | 16 | $6,199 | $530.56 | 49% |
| City of Westminster | 1,424 | $6,053 | $515.72 | 50% |
| Stamford Bridge | 11 | $4,828 | $418.84 | 39% |
| Old Windsor | 20 | $4,177 | $286.69 | 49% |
| Cookham | 20 | $4,138 | $347.79 | 47% |
| Bourne End | 10 | $4,086 | $496.86 | 46% |
| Huggate | 10 | $3,763 | $279.44 | 47% |
| City of London | 242 | $3,522 | $340.82 | 47% |
| South Cave | 10 | $3,165 | $196.68 | 54% |