Wealden Airbnb Market Analysis 2026: Short Term Rental Data & Vacation Rental Statistics in England, United Kingdom
Is Airbnb profitable in Wealden in 2026? Explore comprehensive Airbnb analytics for Wealden, England, United Kingdom to uncover income potential. This 2026 STR market report for Wealden, based on AirROI data from February 2025 to January 2026, reveals key trends in the market of 660 active listings.
Whether you're considering an Airbnb investment in Wealden, optimizing your existing vacation rental, or exploring rental arbitrage opportunities, understanding the Wealden Airbnb data is crucial. Leveraging the low regulation environment is key to maximizing your short term rental income potential. Let's dive into the specifics.
Key Wealden Airbnb Performance Metrics Overview
Monthly Airbnb Revenue Variations & Income Potential in Wealden (2026)
Understanding the monthly revenue variations for Airbnb listings in Wealden is key to maximizing your short term rental income potential. Seasonality significantly impacts earnings. Our analysis, based on data from the past 12 months, shows that the peak revenue month for STRs in Wealden is typically August, while January often presents the lowest earnings, highlighting opportunities for strategic pricing adjustments during shoulder and low seasons. Explore the typical Airbnb income in Wealden across different performance tiers:
- Best-in-class properties (Top 10%) achieve $7,269+ monthly, often utilizing dynamic pricing and superior guest experiences.
- Strong performing properties (Top 25%) earn $4,212 or more, indicating effective management and desirable locations/amenities.
- Typical properties (Median) generate around $2,451 per month, representing the average market performance.
- Entry-level properties (Bottom 25%) see earnings around $1,234, often with potential for optimization.
Average Monthly Airbnb Earnings Trend in Wealden
Wealden Airbnb Occupancy Rate Trends (2026)
Maximize your bookings by understanding the Wealden STR occupancy trends. Seasonal demand shifts significantly influence how often properties are booked. Typically, Augustsees the highest demand (peak season occupancy), while January experiences the lowest (low season). Effective strategies, like adjusting minimum stays or offering promotions, can boost occupancy during slower periods. Here's how different property tiers perform in Wealden:
- Best-in-class properties (Top 10%) achieve 81%+ occupancy, indicating high desirability and potentially optimized availability.
- Strong performing properties (Top 25%) maintain 65% or higher occupancy, suggesting good market fit and guest satisfaction.
- Typical properties (Median) have an occupancy rate around 44%.
- Entry-level properties (Bottom 25%) average 23% occupancy, potentially facing higher vacancy.
Average Monthly Occupancy Rate Trend in Wealden
Average Daily Rate (ADR) Airbnb Trends in Wealden (2026)
Effective short term rental pricing strategy in Wealden involves understanding monthly ADR fluctuations. The Average Daily Rate (ADR) for Airbnb in Wealden typically peaks in August and dips lowest during March. Leveraging Airbnb dynamic pricing tools or strategies based on this seasonality can significantly boost revenue. Here's a look at the typical nightly rates achieved:
- Best-in-class properties (Top 10%) command rates of $515+ per night, often due to premium features or locations.
- Strong performing properties (Top 25%) achieve nightly rates of $264 or more.
- Typical properties (Median) charge around $177 per night.
- Entry-level properties (Bottom 25%) earn around $130 per night.
Average Daily Rate (ADR) Trend by Month in Wealden
Get Live Wealden Market Intelligence 👇

Explore Real-time Analytics
Airbnb Seasonality Analysis & Trends in Wealden (2026)
Peak Season (August, July, May)
- Revenue averages $4,746 per month
- Occupancy rates average 54.8%
- Daily rates average $284
Shoulder Season
- Revenue averages $3,761 per month
- Occupancy maintains around 45.0%
- Daily rates hold near $274
Low Season (January, February, November)
- Revenue drops to average $2,820 per month
- Occupancy decreases to average 35.9%
- Daily rates adjust to average $266
Seasonality Insights for Wealden
- The Airbnb seasonality in Wealden shows highly seasonal trends requiring careful strategy. While the sections above show seasonal averages, it's also insightful to look at the extremes:
- During the high season, the absolute peak month showcases Wealden's highest earning potential, with monthly revenues capable of climbing to $5,261, occupancy reaching a high of 60.8%, and ADRs peaking at $290.
- Conversely, the slowest single month of the year, typically falling within the low season, marks the market's lowest point. In this month, revenue might dip to $2,417, occupancy could drop to 28.9%, and ADRs may adjust down to $252.
- Understanding both the seasonal averages and these monthly peaks and troughs in revenue, occupancy, and ADR is crucial for maximizing your Airbnb profit potential in Wealden.
Seasonal Strategies for Maximizing Profit
- Peak Season: Maximize revenue through premium pricing and potentially longer minimum stays. Ensure high availability.
- Low Season: Offer competitive pricing, special promotions (e.g., extended stay discounts), and flexible cancellation policies. Target off-season travelers like remote workers or budget-conscious guests.
- Shoulder Seasons: Implement dynamic pricing that balances peak and low rates. Target weekend travelers or specific events. Offer slightly more flexible terms than peak season.
- Regularly analyze your own performance against these Wealden seasonality benchmarks and adjust your pricing and availability strategy accordingly.
Best Areas for Airbnb Investment in Wealden (2026)
Exploring the top neighborhoods for short-term rentals in Wealden? This section highlights key areas, outlining why they are attractive for hosts and guests, along with notable local attractions. Consider these locations based on your target guest profile and investment strategy.
| Neighborhood / Area | Why Host Here? (Target Guests & Appeal) | Key Attractions & Landmarks |
|---|---|---|
| Uckfield | A charming market town with a rich history and vibrant community. Popular with visitors looking for a quaint English experience and access to the beautiful Weald countryside. | Uckfield Railway Station, High Street shops, Luxford Field, Newick Park, Telegraph Hill Nature Reserve |
| Heathfield | A picturesque town known for its rural beauty and community spirit. Offers a tranquil retreat for those seeking a break from city life, ideal for nature lovers and families. | Heathfield Community Centre, Heathfield Park, The Heathfield Show, Ridgewood Nature Reserve, Rotherfield Village |
| Crowborough | Nestled at the edge of the Ashdown Forest, Crowborough is great for woodland walks and outdoor activities. Attracts both tourists and nature enthusiasts seeking adventure. | Ashdown Forest, Crowborough Beacon Golf Club, Crowborough Community Centre, Wilderness Wood, All Saints Church |
| Hailsham | A market town with a rich history and modern attractions, popular among families and those seeking a peaceful getaway. Offers a mix of nature and local culture. | Hailsham East Sussex History Museum, Cuckoo Trail, Hailsham Pavilion, Hailsham Town Centre, Hailsham Recreation Ground |
| Forest Row | A vibrant village close to Ashdown Forest, known for its artistic community and holistic lifestyle. Great for guests seeking wellness retreats and nature activities. | Ashdown Forest, Forest Row Village, Royal Ashdown Forest Golf Club, Ditchling Common, The Bluebell Railway |
| East Grinstead | A historic town with a mix of modern amenities and ancient architecture. Ideal for guests who want to explore both history and contemporary life. | East Grinstead Museum, Standen House and Garden, The Old Convent, Forest Way Trail, East Grinstead High Street |
| Pevensey Bay | A coastal village known for its beach and historical castle. Attractive to beachgoers and history buffs looking for a relaxing getaway by the sea. | Pevensey Bay Beach, Pevensey Castle, Eastbourne Beach nearby, The Cuckoo Trail, Local cafes and pubs |
| Rye | Though slightly farther, Rye is a charming medieval town popular for its cobbled streets and historic sites. A fantastic destination for tourists seeking an authentic English experience. | Rye Castle Museum, Mermaid Street, St. Mary’s Church, The Strand, Rye Harbour Nature Reserve |
Understanding Airbnb License Requirements & STR Laws in Wealden (2026)
While Wealden, England, United Kingdom currently shows low STR regulations, specific Airbnb license requirements might still exist or change. Always verify the latest short term rental regulations and Airbnb license requirements directly with local government authorities for Wealden to ensure full compliance before hosting.
(Source: AirROI data, 2026, finding no licensed listings among those analyzed)
Top Performing Airbnb Properties in Wealden (2026)
Benchmark your potential! Explore examples of top-performing Airbnb properties in Wealdenbased on Trailing Twelve Month (TTM) revenue. Analyze their characteristics, revenue, occupancy rate, and ADR to understand what drives success in this market.

Eastwood Observatory: 12 beds,pool,hot tub, tennis
Entire Place • 12 bedrooms

Countryside Barn Stay with Private Pub & Pool
Entire Place • 8 bedrooms

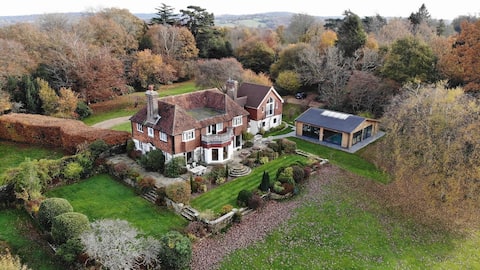
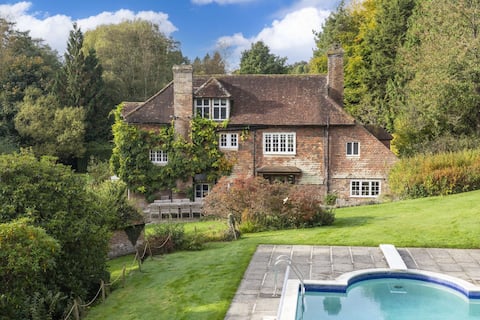
Large English Country House in Ashdown Forest
Entire Place • 6 bedrooms
Beautiful Country House With Indoor Pool & Grounds
Entire Place • 8 bedrooms
Historic home of Winnie The Pooh
Entire Place • 6 bedrooms
Country House Retreat
Entire Place • 7 bedrooms
Note: Performance varies based on location, size, amenities, seasonality, and management quality. Data reflects the past 12 months.
Top Performing Airbnb Hosts in Wealden (2026)
Learn from the best! This table showcases top-performing Airbnb hosts in Wealden based on the number of properties managed and estimated total revenue over the past year. Analyze their scale and performance metrics.
| Host Name | Properties | Grossing Revenue | Stay Reviews | Avg Rating |
|---|---|---|---|---|
| Cottages | 27 | $1,212,000 | 358 | 4.86/5.0 |
| Rosina | 1 | $758,692 | 37 | 5.00/5.0 |
| Sonia | 15 | $732,615 | 484 | 4.81/5.0 |
| Theresa | 2 | $576,085 | 647 | 4.96/5.0 |
| Gary | 4 | $410,614 | 192 | 4.76/5.0 |
| Carl | 7 | $362,728 | 126 | 4.85/5.0 |
| Lucy | 1 | $315,772 | 36 | 5.00/5.0 |
| Ben & Lucy | 1 | $315,018 | 226 | 4.94/5.0 |
| Holidaycottages.Co.Uk | 3 | $300,656 | 13 | 4.93/5.0 |
| Hermione | 1 | $289,661 | 31 | 4.94/5.0 |
Analyzing the strategies of top hosts, such as their property selection, pricing, and guest communication, can offer valuable lessons for optimizing your own Airbnb operations in Wealden.
Dive Deeper: Advanced Wealden STR Market Data (2026)
Ready to unlock more insights? AirROI provides access to advanced metrics and comprehensive Airbnb data for Wealden. Explore detailed analytics beyond this report to refine your investment strategy, optimize pricing, and maximize your vacation rental profits.
Explore Advanced MetricsWealden Short-Term Rental Market Composition (2026): Property & Room Types
Room Type Distribution
Property Type Distribution
Market Composition Insights for Wealden
- The Wealden Airbnb market composition is heavily skewed towards Entire Home/Apt listings, which make up 88.2% of the 660 active rentals. This indicates strong guest preference for privacy and space.
- Looking at the property type distribution in Wealden, House properties are the most common (55.3%), reflecting the local real estate landscape.
- Houses represent a significant 55.3% portion, catering likely to families or larger groups.
- The presence of 7.4% Hotel/Boutique listings indicates integration with traditional hospitality.
- Smaller segments like apartment/condo (combined 4.8%) offer potential for unique stay experiences.
Wealden Airbnb Room Capacity Analysis (2026): Bedroom Distribution
Distribution of Listings by Number of Bedrooms
Room Capacity Insights for Wealden
- The dominant room capacity in Wealden is 1 bedroom listings, making up 38.8% of the market. This suggests a strong demand for properties suitable for couples or solo travelers.
- Together, 1 bedroom and 2 bedrooms properties represent 61.4% of the active Airbnb listings in Wealden, indicating a high concentration in these sizes.
- A significant 24.3% of listings offer 3+ bedrooms, catering to larger groups and families seeking more space in Wealden.
Wealden Vacation Rental Guest Capacity Trends (2026)
Distribution of Listings by Guest Capacity
Guest Capacity Insights for Wealden
- The most common guest capacity trend in Wealden vacation rentals is listings accommodating 2 guests (35.9%). This suggests the primary traveler segment is likely couples or solo travelers.
- Properties designed for 2 guests and 4 guests dominate the Wealden STR market, accounting for 60.6% of listings.
- 24.1% of properties accommodate 6+ guests, serving the market segment for larger families or group travel in Wealden.
- On average, properties in Wealden are equipped to host 3.7 guests.
Wealden Airbnb Booking Patterns (2026): Available vs. Booked Days
Available Days Distribution
Booked Days Distribution
Booking Pattern Insights for Wealden
- The most common availability pattern in Wealden falls within the 181-270 days range, representing 35.9% of listings. This suggests many properties have significant open periods on their calendars.
- Approximately 71.7% of listings show high availability (181+ days open annually), indicating potential for increased bookings or specific owner usage patterns.
- For booked days, the 91-180 days range is most frequent in Wealden (36.2%), reflecting common guest stay durations or potential owner blocking patterns.
- A notable 30.0% of properties secure long booking periods (181+ days booked per year), highlighting successful long-term rental strategies or significant owner usage.
Wealden Airbnb Minimum Stay Requirements Analysis
Distribution of Listings by Minimum Night Requirement
1 Night
190 listings
28.8% of total
2 Nights
203 listings
30.8% of total
3 Nights
43 listings
6.5% of total
4-6 Nights
29 listings
4.4% of total
7-29 Nights
10 listings
1.5% of total
30+ Nights
185 listings
28% of total
Key Insights
- The most prevalent minimum stay requirement in Wealden is 2 Nights, adopted by 30.8% of listings. This highlights the market's preference for shorter, flexible bookings.
- A significant segment (28%) caters to monthly stays (30+ nights) in Wealden, pointing to opportunities in the extended-stay market.
Recommendations
- Align with the market by considering a 2 Nights minimum stay, as 30.8% of Wealden hosts use this setting.
- If feasible, allowing 1-night stays, especially midweek or during low season, could capture last-minute bookings, as only 28.8% currently do.
- Explore offering discounts for stays of 30+ nights to attract the 28% of the market seeking extended stays.
- Adjust minimum nights based on seasonality – potentially shorter during low season and longer during peak demand periods in Wealden.
Wealden Airbnb Cancellation Policy Trends Analysis (2026)
Super Strict 30 Days
2 listings
0.3% of total
Limited
7 listings
1.1% of total
Super Strict 60 Days
76 listings
11.5% of total
Non-refundable
1 listings
0.2% of total
Flexible
133 listings
20.2% of total
Moderate
178 listings
27% of total
Firm
215 listings
32.6% of total
Strict
47 listings
7.1% of total
Cancellation Policy Insights for Wealden
- The prevailing Airbnb cancellation policy trend in Wealden is Firm, used by 32.6% of listings.
- There's a relatively balanced mix between guest-friendly (47.2%) and stricter (39.7%) policies, offering choices for different guest needs.
- Strict cancellation policies are quite rare (7.1%), potentially making listings with this policy less competitive unless justified by high demand or property type.
Recommendations for Hosts
- Consider adopting a Firm policy to align with the 32.6% market standard in Wealden.
- Using a Strict policy might deter some guests, as only 7.1% of listings use it. Evaluate if potential revenue protection outweighs possible lower booking rates.
- Regularly review your cancellation policy against competitors and market demand shifts in Wealden.
Wealden STR Booking Lead Time Analysis (2026)
Average Booking Lead Time by Month
Booking Lead Time Insights for Wealden
- The overall average booking lead time for vacation rentals in Wealden is 59 days.
- Guests book furthest in advance for stays during August (average 77 days), likely coinciding with peak travel demand or local events.
- The shortest booking windows occur for stays in March (average 38 days), indicating more last-minute travel plans during this time.
- Seasonally, Summer (73 days avg.) sees the longest lead times, while Winter (53 days avg.) has the shortest, reflecting typical travel planning cycles.
Recommendations for Hosts
- Use the overall average lead time (59 days) as a baseline for your pricing and availability strategy in Wealden.
- For August stays, consider implementing length-of-stay discounts or slightly higher rates for bookings made less than 77 days out to capitalize on advance planning.
- Target marketing efforts for the Summer season well in advance (at least 73 days) to capture early planners.
- Monitor your own booking lead times against these Wealden averages to identify opportunities for dynamic pricing adjustments.
Popular & Essential Airbnb Amenities in Wealden (2026)
Amenity Prevalence
Amenity Insights for Wealden
- Popular amenities like Free parking on premises, Smoke alarm, Heating are common but not universal. Offering these can provide a competitive edge.
- Warning: Wifi is not universally provided but is considered essential globally. Ensure reliable Wifi is offered.
Recommendations for Hosts
- Consider adding popular differentiators like Free parking on premises or Smoke alarm to increase appeal.
- Highlight unique or less common amenities you offer (e.g., hot tub, dedicated workspace, EV charger) in your listing description and photos.
- Regularly check competitor amenities in Wealden to stay competitive.
Wealden Airbnb Guest Demographics & Profile Analysis (2026)
Guest Profile Summary for Wealden
- The typical guest profile for Airbnb in Wealden consists of primarily domestic travelers (88%), often arriving from nearby England, typically belonging to the Post-2000s (Gen Z/Alpha) group (50%), primarily speaking English or French.
- Domestic travelers account for 88.3% of guests.
- Key international markets include United Kingdom (88.3%) and United States (2.4%).
- Top languages spoken are English (60%) followed by French (10.8%).
- A significant demographic segment is the Post-2000s (Gen Z/Alpha) group, representing 50% of guests.
Recommendations for Hosts
- Target domestic marketing efforts towards travelers from England and London.
- Tailor amenities and listing descriptions to appeal to the dominant Post-2000s (Gen Z/Alpha) demographic (e.g., highlight fast WiFi, smart home features, local guides).
- Highlight unique local experiences or amenities relevant to the primary guest profile.
- Consider seasonal promotions aligned with peak travel times for key origin markets.
Nearby Short-Term Rental Market Comparison
How does the Wealden Airbnb market stack up against its neighbors? Compare key performance metrics like average monthly revenue, ADR, and occupancy rates in surrounding areas to understand the broader regional STR landscape.
| Market | Active Properties | Monthly Revenue | Daily Rate | Avg. Occupancy |
|---|---|---|---|---|
| Dorney | 11 | $7,510 | $743.63 | 39% |
| Wraysbury | 16 | $6,199 | $530.56 | 49% |
| City of Westminster | 1,424 | $6,053 | $515.72 | 50% |
| Old Windsor | 20 | $4,177 | $286.69 | 49% |
| Cookham | 20 | $4,138 | $347.79 | 47% |
| Bourne End | 10 | $4,086 | $496.86 | 46% |
| La Poterie-Cap-d'Antifer | 15 | $3,878 | $273.66 | 48% |
| City of London | 242 | $3,522 | $340.82 | 47% |
| Saint-Étienne-la-Thillaye | 23 | $3,486 | $390.94 | 35% |
| Roedean | 52 | $3,379 | $273.40 | 45% |