Scarborough Airbnb Market Analysis 2026: Short Term Rental Data & Vacation Rental Statistics in England, United Kingdom
Is Airbnb profitable in Scarborough in 2026? Explore comprehensive Airbnb analytics for Scarborough, England, United Kingdom to uncover income potential. This 2026 STR market report for Scarborough, based on AirROI data from February 2025 to January 2026, reveals key trends in the market of 524 active listings.
Whether you're considering an Airbnb investment in Scarborough, optimizing your existing vacation rental, or exploring rental arbitrage opportunities, understanding the Scarborough Airbnb data is crucial. Leveraging the low regulation environment is key to maximizing your short term rental income potential. Let's dive into the specifics.
Key Scarborough Airbnb Performance Metrics Overview
Monthly Airbnb Revenue Variations & Income Potential in Scarborough (2026)
Understanding the monthly revenue variations for Airbnb listings in Scarborough is key to maximizing your short term rental income potential. Seasonality significantly impacts earnings. Our analysis, based on data from the past 12 months, shows that the peak revenue month for STRs in Scarborough is typically August, while January often presents the lowest earnings, highlighting opportunities for strategic pricing adjustments during shoulder and low seasons. Explore the typical Airbnb income in Scarborough across different performance tiers:
- Best-in-class properties (Top 10%) achieve $4,651+ monthly, often utilizing dynamic pricing and superior guest experiences.
- Strong performing properties (Top 25%) earn $3,137 or more, indicating effective management and desirable locations/amenities.
- Typical properties (Median) generate around $2,002 per month, representing the average market performance.
- Entry-level properties (Bottom 25%) see earnings around $1,040, often with potential for optimization.
Average Monthly Airbnb Earnings Trend in Scarborough
Scarborough Airbnb Occupancy Rate Trends (2026)
Maximize your bookings by understanding the Scarborough STR occupancy trends. Seasonal demand shifts significantly influence how often properties are booked. Typically, Augustsees the highest demand (peak season occupancy), while January experiences the lowest (low season). Effective strategies, like adjusting minimum stays or offering promotions, can boost occupancy during slower periods. Here's how different property tiers perform in Scarborough:
- Best-in-class properties (Top 10%) achieve 74%+ occupancy, indicating high desirability and potentially optimized availability.
- Strong performing properties (Top 25%) maintain 56% or higher occupancy, suggesting good market fit and guest satisfaction.
- Typical properties (Median) have an occupancy rate around 37%.
- Entry-level properties (Bottom 25%) average 19% occupancy, potentially facing higher vacancy.
Average Monthly Occupancy Rate Trend in Scarborough
Average Daily Rate (ADR) Airbnb Trends in Scarborough (2026)
Effective short term rental pricing strategy in Scarborough involves understanding monthly ADR fluctuations. The Average Daily Rate (ADR) for Airbnb in Scarborough typically peaks in August and dips lowest during March. Leveraging Airbnb dynamic pricing tools or strategies based on this seasonality can significantly boost revenue. Here's a look at the typical nightly rates achieved:
- Best-in-class properties (Top 10%) command rates of $393+ per night, often due to premium features or locations.
- Strong performing properties (Top 25%) achieve nightly rates of $239 or more.
- Typical properties (Median) charge around $165 per night.
- Entry-level properties (Bottom 25%) earn around $123 per night.
Average Daily Rate (ADR) Trend by Month in Scarborough
Get Live Scarborough Market Intelligence 👇

Explore Real-time Analytics
Airbnb Seasonality Analysis & Trends in Scarborough (2026)
Peak Season (August, July, May)
- Revenue averages $3,707 per month
- Occupancy rates average 52.7%
- Daily rates average $234
Shoulder Season
- Revenue averages $2,287 per month
- Occupancy maintains around 37.5%
- Daily rates hold near $218
Low Season (January, February, November)
- Revenue drops to average $1,542 per month
- Occupancy decreases to average 28.0%
- Daily rates adjust to average $209
Seasonality Insights for Scarborough
- The Airbnb seasonality in Scarborough shows highly seasonal trends requiring careful strategy. While the sections above show seasonal averages, it's also insightful to look at the extremes:
- During the high season, the absolute peak month showcases Scarborough's highest earning potential, with monthly revenues capable of climbing to $4,646, occupancy reaching a high of 61.8%, and ADRs peaking at $244.
- Conversely, the slowest single month of the year, typically falling within the low season, marks the market's lowest point. In this month, revenue might dip to $1,276, occupancy could drop to 20.2%, and ADRs may adjust down to $196.
- Understanding both the seasonal averages and these monthly peaks and troughs in revenue, occupancy, and ADR is crucial for maximizing your Airbnb profit potential in Scarborough.
Seasonal Strategies for Maximizing Profit
- Peak Season: Maximize revenue through premium pricing and potentially longer minimum stays. Ensure high availability.
- Low Season: Offer competitive pricing, special promotions (e.g., extended stay discounts), and flexible cancellation policies. Target off-season travelers like remote workers or budget-conscious guests.
- Shoulder Seasons: Implement dynamic pricing that balances peak and low rates. Target weekend travelers or specific events. Offer slightly more flexible terms than peak season.
- Regularly analyze your own performance against these Scarborough seasonality benchmarks and adjust your pricing and availability strategy accordingly.
Best Areas for Airbnb Investment in Scarborough (2026)
Exploring the top neighborhoods for short-term rentals in Scarborough? This section highlights key areas, outlining why they are attractive for hosts and guests, along with notable local attractions. Consider these locations based on your target guest profile and investment strategy.
| Neighborhood / Area | Why Host Here? (Target Guests & Appeal) | Key Attractions & Landmarks |
|---|---|---|
| Scarborough Town Centre | The heart of Scarborough's shopping and dining scene, making it an ideal location for visitors looking to explore local culture and convenience. | Scarborough Castle, Stephen Joseph Theatre, Shopping on Westborough, Scarborough Art Gallery, Scarborough Fair Collection |
| South Bay | A classic seaside area known for its sandy beaches and family-friendly attractions, popular with tourists in the summer months. | South Bay Beach, Scarborough Pier, Sea Life Scarborough, Scarborough Marina, South Cliff Clock Tower |
| North Bay | Known for its beautiful beach and outdoor recreational options, attracting families and outdoor enthusiasts year-round. | North Bay Beach, Peasholm Park, Scarborough Open Air Theatre, Cannonball Run, Sea Life Scarborough |
| Filey Road | A quieter area offering local charm with easy access to both the beaches and the countryside, appealing to tourists seeking relaxation. | Filey Road Beach, Local pubs and restaurants, Scenic coastal walks, Nearby golf courses, Filey Bird Garden and Animal Park |
| Crown Spa Hotel Area | Located near upscale hotels and spas, this area attracts visitors looking for luxury and wellness experiences as well as proximity to the beach. | Crown Spa Hotel, Spa facilities, Scarborough's coastline, The Spa Bridlington, Elegant dining options |
| Firestone Bay | A picturesque bay area that draws travelers who enjoy water sports and relaxing beach atmospheres, great for energetic visitors. | Water sports activities, Scenic views of the coastline, Relaxation spots, Nearby cafes and dining, Beachfront promenades |
| Burniston | A quaint village nearby Scarborough that offers a peaceful retreat and proximity to the North York Moors, popular among nature lovers. | North York Moors National Park, Local village charm, Countryside walks, Nearby historic sites, Charming tea rooms |
| Eastfield | An up-and-coming area close to traditional attractions and away from the hustle and bustle, ideal for those seeking quieter accommodations. | Nearby parks, Local dining options, Transport links to Scarborough, Community events and markets, Historic landmarks |
Understanding Airbnb License Requirements & STR Laws in Scarborough (2026)
While Scarborough, England, United Kingdom currently shows low STR regulations, specific Airbnb license requirements might still exist or change. Always verify the latest short term rental regulations and Airbnb license requirements directly with local government authorities for Scarborough to ensure full compliance before hosting.
(Source: AirROI data, 2026, based on 0% licensed listings)
Top Performing Airbnb Properties in Scarborough (2026)
Benchmark your potential! Explore examples of top-performing Airbnb properties in Scarboroughbased on Trailing Twelve Month (TTM) revenue. Analyze their characteristics, revenue, occupancy rate, and ADR to understand what drives success in this market.

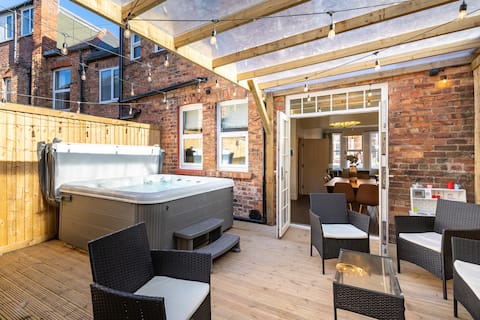
Hawkwood Court - Gym - Hot Tub - Games Room
Entire Place • 4 bedrooms
Emerald Park - Hot Tub & Games Room
Entire Place • 5 bedrooms

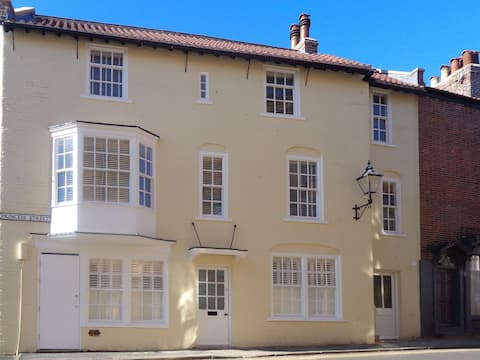
The Haven
Entire Place • 2 bedrooms

The Spa Chalet~ Seafront Balcony~ Pool/Spa + Gym
Entire Place • 5 bedrooms
Princess Lodge
Entire Place • 5 bedrooms
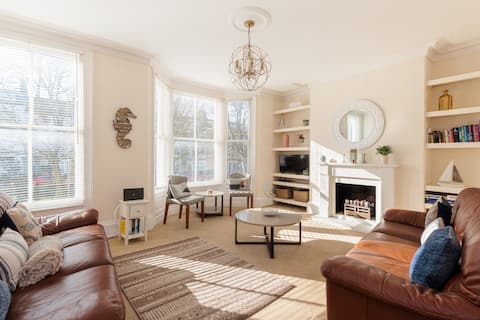
Restful family seaside retreat minutes from beach
Entire Place • 5 bedrooms
Note: Performance varies based on location, size, amenities, seasonality, and management quality. Data reflects the past 12 months.
Top Performing Airbnb Hosts in Scarborough (2026)
Learn from the best! This table showcases top-performing Airbnb hosts in Scarborough based on the number of properties managed and estimated total revenue over the past year. Analyze their scale and performance metrics.
| Host Name | Properties | Grossing Revenue | Stay Reviews | Avg Rating |
|---|---|---|---|---|
| Cottages | 41 | $1,156,048 | 320 | 4.64/5.0 |
| Host & Stay | 39 | $772,373 | 991 | 4.50/5.0 |
| Lottie | 14 | $563,262 | 752 | 4.78/5.0 |
| Jon | 27 | $546,747 | 589 | 4.68/5.0 |
| Vista Retreats Ltd | 7 | $481,629 | 82 | 4.87/5.0 |
| Debbie | 8 | $356,601 | 306 | 4.98/5.0 |
| Ingrid Flute'S Yorks Hol Cotta | 12 | $309,132 | 47 | 4.64/5.0 |
| Steff | 14 | $246,863 | 2482 | 4.78/5.0 |
| Matt | 6 | $245,554 | 207 | 4.67/5.0 |
| Andrea | 5 | $195,660 | 212 | 4.93/5.0 |
Analyzing the strategies of top hosts, such as their property selection, pricing, and guest communication, can offer valuable lessons for optimizing your own Airbnb operations in Scarborough.
Dive Deeper: Advanced Scarborough STR Market Data (2026)
Ready to unlock more insights? AirROI provides access to advanced metrics and comprehensive Airbnb data for Scarborough. Explore detailed analytics beyond this report to refine your investment strategy, optimize pricing, and maximize your vacation rental profits.
Explore Advanced MetricsScarborough Short-Term Rental Market Composition (2026): Property & Room Types
Room Type Distribution
Property Type Distribution
Market Composition Insights for Scarborough
- The Scarborough Airbnb market composition is heavily skewed towards Entire Home/Apt listings, which make up 89.9% of the 524 active rentals. This indicates strong guest preference for privacy and space.
- Looking at the property type distribution in Scarborough, Apartment/Condo properties are the most common (46.6%), reflecting the local real estate landscape.
- Houses represent a significant 45.6% portion, catering likely to families or larger groups.
- The presence of 6.1% Hotel/Boutique listings indicates integration with traditional hospitality.
- Smaller segments like others, outdoor/unique, unique stays (combined 1.7%) offer potential for unique stay experiences.
Scarborough Airbnb Room Capacity Analysis (2026): Bedroom Distribution
Distribution of Listings by Number of Bedrooms
Room Capacity Insights for Scarborough
- The dominant room capacity in Scarborough is 2 bedrooms listings, making up 34% of the market. This suggests a strong demand for properties suitable for couples or solo travelers.
- Together, 2 bedrooms and 1 bedroom properties represent 63.6% of the active Airbnb listings in Scarborough, indicating a high concentration in these sizes.
- A significant 31.3% of listings offer 3+ bedrooms, catering to larger groups and families seeking more space in Scarborough.
Scarborough Vacation Rental Guest Capacity Trends (2026)
Distribution of Listings by Guest Capacity
Guest Capacity Insights for Scarborough
- The most common guest capacity trend in Scarborough vacation rentals is listings accommodating 4 guests (34.2%). This suggests the primary traveler segment is likely small families or groups.
- Properties designed for 4 guests and 2 guests dominate the Scarborough STR market, accounting for 53.3% of listings.
- 32.2% of properties accommodate 6+ guests, serving the market segment for larger families or group travel in Scarborough.
- On average, properties in Scarborough are equipped to host 4.4 guests.
Scarborough Airbnb Booking Patterns (2026): Available vs. Booked Days
Available Days Distribution
Booked Days Distribution
Booking Pattern Insights for Scarborough
- The most common availability pattern in Scarborough falls within the 271-366 days range, representing 45.8% of listings. This suggests many properties have significant open periods on their calendars.
- Approximately 80.9% of listings show high availability (181+ days open annually), indicating potential for increased bookings or specific owner usage patterns.
- For booked days, the 91-180 days range is most frequent in Scarborough (36.8%), reflecting common guest stay durations or potential owner blocking patterns.
- A notable 20.1% of properties secure long booking periods (181+ days booked per year), highlighting successful long-term rental strategies or significant owner usage.
Scarborough Airbnb Minimum Stay Requirements Analysis
Distribution of Listings by Minimum Night Requirement
1 Night
78 listings
14.9% of total
2 Nights
146 listings
27.9% of total
3 Nights
36 listings
6.9% of total
4-6 Nights
10 listings
1.9% of total
30+ Nights
253 listings
48.4% of total
Key Insights
- The most prevalent minimum stay requirement in Scarborough is 30+ Nights, adopted by 48.4% of listings. This highlights the market's preference for longer commitments.
- A significant segment (48.4%) caters to monthly stays (30+ nights) in Scarborough, pointing to opportunities in the extended-stay market.
Recommendations
- Align with the market by considering a 30+ Nights minimum stay, as 48.4% of Scarborough hosts use this setting.
- If feasible, allowing 1-night stays, especially midweek or during low season, could capture last-minute bookings, as only 14.9% currently do.
- Explore offering discounts for stays of 30+ nights to attract the 48.4% of the market seeking extended stays.
- Adjust minimum nights based on seasonality – potentially shorter during low season and longer during peak demand periods in Scarborough.
Scarborough Airbnb Cancellation Policy Trends Analysis (2026)
Non-refundable
4 listings
0.8% of total
Super Strict 60 Days
80 listings
15.3% of total
Super Strict 30 Days
29 listings
5.5% of total
Refundable
6 listings
1.1% of total
Limited
2 listings
0.4% of total
Flexible
71 listings
13.6% of total
Moderate
121 listings
23.1% of total
Firm
178 listings
34% of total
Strict
32 listings
6.1% of total
Cancellation Policy Insights for Scarborough
- The prevailing Airbnb cancellation policy trend in Scarborough is Firm, used by 34% of listings.
- There's a relatively balanced mix between guest-friendly (36.7%) and stricter (40.1%) policies, offering choices for different guest needs.
- Strict cancellation policies are quite rare (6.1%), potentially making listings with this policy less competitive unless justified by high demand or property type.
Recommendations for Hosts
- Consider adopting a Firm policy to align with the 34% market standard in Scarborough.
- Using a Strict policy might deter some guests, as only 6.1% of listings use it. Evaluate if potential revenue protection outweighs possible lower booking rates.
- Regularly review your cancellation policy against competitors and market demand shifts in Scarborough.
Scarborough STR Booking Lead Time Analysis (2026)
Average Booking Lead Time by Month
Booking Lead Time Insights for Scarborough
- The overall average booking lead time for vacation rentals in Scarborough is 73 days.
- Guests book furthest in advance for stays during July (average 105 days), likely coinciding with peak travel demand or local events.
- The shortest booking windows occur for stays in February (average 35 days), indicating more last-minute travel plans during this time.
- Seasonally, Summer (96 days avg.) sees the longest lead times, while Winter (58 days avg.) has the shortest, reflecting typical travel planning cycles.
Recommendations for Hosts
- Use the overall average lead time (73 days) as a baseline for your pricing and availability strategy in Scarborough.
- For July stays, consider implementing length-of-stay discounts or slightly higher rates for bookings made less than 105 days out to capitalize on advance planning.
- Target marketing efforts for the Summer season well in advance (at least 96 days) to capture early planners.
- Monitor your own booking lead times against these Scarborough averages to identify opportunities for dynamic pricing adjustments.
Popular & Essential Airbnb Amenities in Scarborough (2026)
Amenity Prevalence
Amenity Insights for Scarborough
- Essential amenities in Scarborough that guests expect include: Wifi, TV, Smoke alarm. Lacking these (any) could significantly impact bookings.
- Popular amenities like Heating, Kitchen, Bed linens are common but not universal. Offering these can provide a competitive edge.
Recommendations for Hosts
- Ensure your listing includes all essential amenities for Scarborough: Wifi, TV, Smoke alarm.
- Prioritize adding missing essentials: Wifi, TV, Smoke alarm.
- Consider adding popular differentiators like Heating or Kitchen to increase appeal.
- Highlight unique or less common amenities you offer (e.g., hot tub, dedicated workspace, EV charger) in your listing description and photos.
- Regularly check competitor amenities in Scarborough to stay competitive.
Scarborough Airbnb Guest Demographics & Profile Analysis (2026)
Guest Profile Summary for Scarborough
- The typical guest profile for Airbnb in Scarborough consists of primarily domestic travelers (94%), often arriving from nearby England, typically belonging to the Post-2000s (Gen Z/Alpha) group (50%), primarily speaking English or French.
- Domestic travelers account for 93.6% of guests.
- Key international markets include United Kingdom (93.6%) and United States (1.3%).
- Top languages spoken are English (72.3%) followed by French (6.4%).
- A significant demographic segment is the Post-2000s (Gen Z/Alpha) group, representing 50% of guests.
Recommendations for Hosts
- Target domestic marketing efforts towards travelers from England and London.
- Tailor amenities and listing descriptions to appeal to the dominant Post-2000s (Gen Z/Alpha) demographic (e.g., highlight fast WiFi, smart home features, local guides).
- Highlight unique local experiences or amenities relevant to the primary guest profile.
- Consider seasonal promotions aligned with peak travel times for key origin markets.
Nearby Short-Term Rental Market Comparison
How does the Scarborough Airbnb market stack up against its neighbors? Compare key performance metrics like average monthly revenue, ADR, and occupancy rates in surrounding areas to understand the broader regional STR landscape.
| Market | Active Properties | Monthly Revenue | Daily Rate | Avg. Occupancy |
|---|---|---|---|---|
| Stamford Bridge | 11 | $4,828 | $418.84 | 39% |
| Grinton | 12 | $4,363 | $338.85 | 48% |
| Ellingham | 12 | $4,350 | $318.71 | 51% |
| High Newton by the Sea | 19 | $4,216 | $506.29 | 39% |
| Tollerton | 12 | $4,121 | $303.75 | 52% |
| Holy Island | 14 | $4,102 | $326.39 | 58% |
| Newholm-cum-Dunsley | 19 | $3,988 | $370.23 | 43% |
| Huntington | 19 | $3,823 | $233.48 | 53% |
| Huggate | 10 | $3,763 | $279.44 | 47% |
| Bishop Monkton | 14 | $3,719 | $310.92 | 46% |