Rugby Airbnb Market Analysis 2026: Short Term Rental Data & Vacation Rental Statistics in England, United Kingdom
Is Airbnb profitable in Rugby in 2026? Explore comprehensive Airbnb analytics for Rugby, England, United Kingdom to uncover income potential. This 2026 STR market report for Rugby, based on AirROI data from February 2025 to January 2026, reveals key trends in the niche market of 128 active listings.
Whether you're considering an Airbnb investment in Rugby, optimizing your existing vacation rental, or exploring rental arbitrage opportunities, understanding the Rugby Airbnb data is crucial. Leveraging the low regulation environment is key to maximizing your short term rental income potential. Let's dive into the specifics.
Key Rugby Airbnb Performance Metrics Overview
Monthly Airbnb Revenue Variations & Income Potential in Rugby (2026)
Understanding the monthly revenue variations for Airbnb listings in Rugby is key to maximizing your short term rental income potential. Seasonality significantly impacts earnings. Our analysis, based on data from the past 12 months, shows that the peak revenue month for STRs in Rugby is typically August, while January often presents the lowest earnings, highlighting opportunities for strategic pricing adjustments during shoulder and low seasons. Explore the typical Airbnb income in Rugby across different performance tiers:
- Best-in-class properties (Top 10%) achieve $4,477+ monthly, often utilizing dynamic pricing and superior guest experiences.
- Strong performing properties (Top 25%) earn $2,585 or more, indicating effective management and desirable locations/amenities.
- Typical properties (Median) generate around $1,455 per month, representing the average market performance.
- Entry-level properties (Bottom 25%) see earnings around $671, often with potential for optimization.
Average Monthly Airbnb Earnings Trend in Rugby
Rugby Airbnb Occupancy Rate Trends (2026)
Maximize your bookings by understanding the Rugby STR occupancy trends. Seasonal demand shifts significantly influence how often properties are booked. Typically, Augustsees the highest demand (peak season occupancy), while January experiences the lowest (low season). Effective strategies, like adjusting minimum stays or offering promotions, can boost occupancy during slower periods. Here's how different property tiers perform in Rugby:
- Best-in-class properties (Top 10%) achieve 81%+ occupancy, indicating high desirability and potentially optimized availability.
- Strong performing properties (Top 25%) maintain 63% or higher occupancy, suggesting good market fit and guest satisfaction.
- Typical properties (Median) have an occupancy rate around 39%.
- Entry-level properties (Bottom 25%) average 19% occupancy, potentially facing higher vacancy.
Average Monthly Occupancy Rate Trend in Rugby
Average Daily Rate (ADR) Airbnb Trends in Rugby (2026)
Effective short term rental pricing strategy in Rugby involves understanding monthly ADR fluctuations. The Average Daily Rate (ADR) for Airbnb in Rugby typically peaks in October and dips lowest during March. Leveraging Airbnb dynamic pricing tools or strategies based on this seasonality can significantly boost revenue. Here's a look at the typical nightly rates achieved:
- Best-in-class properties (Top 10%) command rates of $270+ per night, often due to premium features or locations.
- Strong performing properties (Top 25%) achieve nightly rates of $174 or more.
- Typical properties (Median) charge around $117 per night.
- Entry-level properties (Bottom 25%) earn around $82 per night.
Average Daily Rate (ADR) Trend by Month in Rugby
Get Live Rugby Market Intelligence 👇

Explore Real-time Analytics
Airbnb Seasonality Analysis & Trends in Rugby (2026)
Peak Season (August, March, June)
- Revenue averages $2,465 per month
- Occupancy rates average 45.0%
- Daily rates average $157
Shoulder Season
- Revenue averages $2,101 per month
- Occupancy maintains around 43.1%
- Daily rates hold near $158
Low Season (January, November, December)
- Revenue drops to average $1,697 per month
- Occupancy decreases to average 36.6%
- Daily rates adjust to average $164
Seasonality Insights for Rugby
- The Airbnb seasonality in Rugby shows moderate seasonality with distinct peak and low periods. While the sections above show seasonal averages, it's also insightful to look at the extremes:
- During the high season, the absolute peak month showcases Rugby's highest earning potential, with monthly revenues capable of climbing to $2,666, occupancy reaching a high of 48.3%, and ADRs peaking at $167.
- Conversely, the slowest single month of the year, typically falling within the low season, marks the market's lowest point. In this month, revenue might dip to $1,350, occupancy could drop to 29.9%, and ADRs may adjust down to $148.
- Understanding both the seasonal averages and these monthly peaks and troughs in revenue, occupancy, and ADR is crucial for maximizing your Airbnb profit potential in Rugby.
Seasonal Strategies for Maximizing Profit
- Peak Season: Maximize revenue through premium pricing and potentially longer minimum stays. Ensure high availability.
- Low Season: Offer competitive pricing, special promotions (e.g., extended stay discounts), and flexible cancellation policies. Target off-season travelers like remote workers or budget-conscious guests.
- Shoulder Seasons: Implement dynamic pricing that balances peak and low rates. Target weekend travelers or specific events. Offer slightly more flexible terms than peak season.
- Regularly analyze your own performance against these Rugby seasonality benchmarks and adjust your pricing and availability strategy accordingly.
Best Areas for Airbnb Investment in Rugby (2026)
Exploring the top neighborhoods for short-term rentals in Rugby? This section highlights key areas, outlining why they are attractive for hosts and guests, along with notable local attractions. Consider these locations based on your target guest profile and investment strategy.
| Neighborhood / Area | Why Host Here? (Target Guests & Appeal) | Key Attractions & Landmarks |
|---|---|---|
| Rugby Town Centre | The heart of Rugby, offering historic charm, great shopping, and access to local restaurants and bars. It's a prime area for both business and leisure travelers. | Rugby School, Webb Ellis Rugby Football Museum, Rugby Art Gallery and Museum, Caldecott Park, The Clock Tower |
| Hillmorton | A suburban area with a blend of residential and leisure facilities, popular among families and those seeking a quieter stay, yet close to Rugby's amenities. | War Memorial Park, Canal walks, Hillmorton Locks, Local pubs and shops |
| Brownsover | A residential area on the outskirts of Rugby with parks and local amenities. It appeals to families and longer-term visitors. | Brownsover Park, Easy access to Rugby town centre, Local schools and community facilities |
| Coton House | An upscale area with beautiful countryside views and new developments, attracting visitors looking for a serene stay away from the hustle and bustle. | Nearby nature reserves, Quiet residential areas, Local walking trails |
| New Bilton | A diverse residential area close to the town centre, attracting guests looking for affordable options and convenient access to local attractions. | The Rugby Theatre, Local shops and takeaways, Community parks |
| Borough Hill | Known for its elevated views and scenic walking paths, this area attracts visitors seeking outdoor activities and lovely landscapes. | Borough Hill Park, Historic hill fort, Walking and cycling paths |
| Rugby's Cultural Quarter | Featuring a range of artistic and cultural venues, this area is perfect for visitors wanting to immerse themselves in the local arts scene. | The Benn Hall, Local galleries and theaters, Dining and nightlife options |
| East Rugby | A developing area with access to major roads and green spaces, making it suitable for visitors looking for convenience and leisure. | Local parks, Proximity to the M6 motorway, Shopping facilities |
Understanding Airbnb License Requirements & STR Laws in Rugby (2026)
While Rugby, England, United Kingdom currently shows low STR regulations, specific Airbnb license requirements might still exist or change. Always verify the latest short term rental regulations and Airbnb license requirements directly with local government authorities for Rugby to ensure full compliance before hosting.
(Source: AirROI data, 2026, based on 1% licensed listings)
Top Performing Airbnb Properties in Rugby (2026)
Benchmark your potential! Explore examples of top-performing Airbnb properties in Rugbybased on Trailing Twelve Month (TTM) revenue. Analyze their characteristics, revenue, occupancy rate, and ADR to understand what drives success in this market.
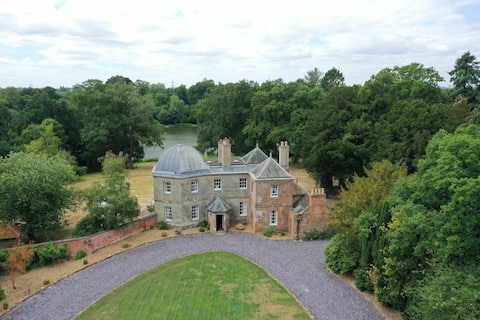
Georgian Lake Mansion with Grounds in Parkland
Entire Place • 8 bedrooms

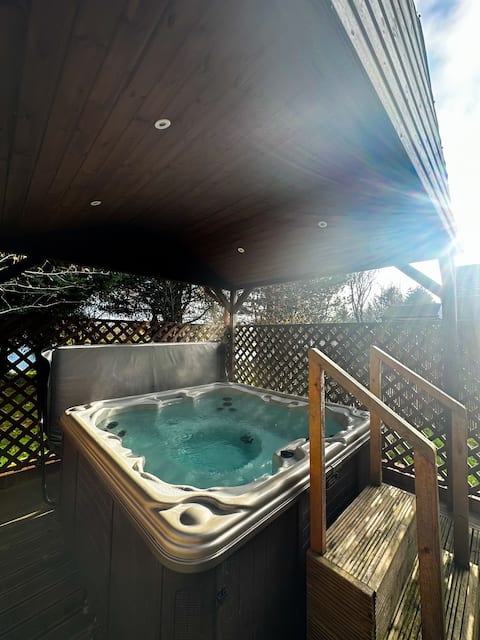
Luxury Barn With Hot Tub
Entire Place • 7 bedrooms

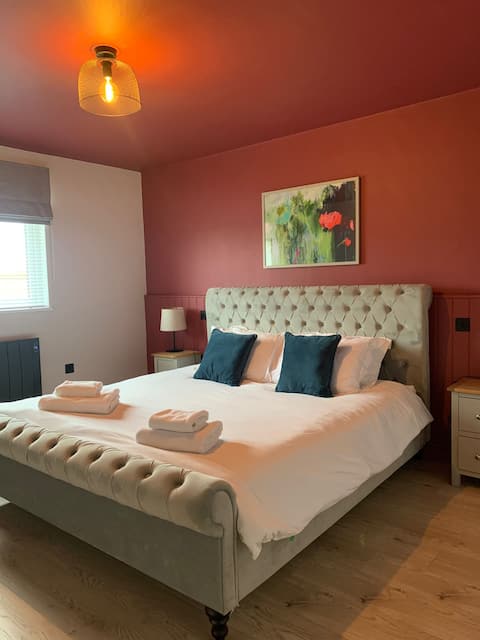
Lily j Rose
Entire Place • 3 bedrooms
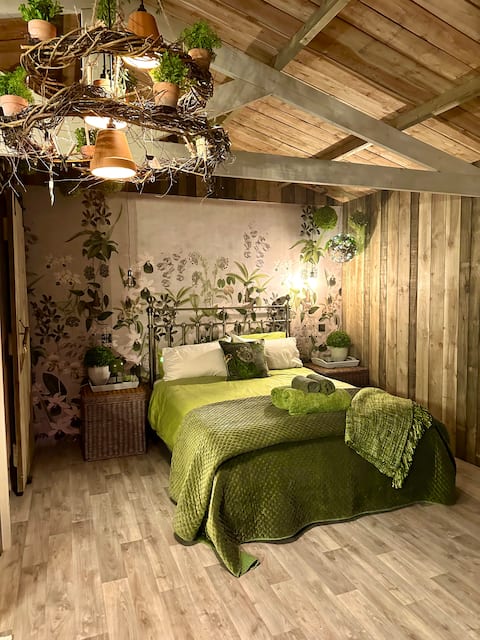
Luxury Lakeview Lodge 3
Entire Place • 3 bedrooms
Luxury Lakeview Lodge (6)
Entire Place • 3 bedrooms
Rural, design led hideaway for 2 with hot tub
Entire Place • 1 bedroom
Note: Performance varies based on location, size, amenities, seasonality, and management quality. Data reflects the past 12 months.
Top Performing Airbnb Hosts in Rugby (2026)
Learn from the best! This table showcases top-performing Airbnb hosts in Rugby based on the number of properties managed and estimated total revenue over the past year. Analyze their scale and performance metrics.
| Host Name | Properties | Grossing Revenue | Stay Reviews | Avg Rating |
|---|---|---|---|---|
| Matt | 5 | $218,368 | 429 | 4.81/5.0 |
| Jane | 1 | $169,452 | 381 | 4.75/5.0 |
| Jenene | 1 | $115,241 | 5 | 5.00/5.0 |
| Lindsey | 2 | $102,304 | 480 | 4.99/5.0 |
| Mark | 4 | $94,309 | 145 | 4.91/5.0 |
| Cottages | 2 | $91,362 | 42 | 4.86/5.0 |
| Ann | 4 | $65,540 | 233 | 4.80/5.0 |
| Joe | 2 | $61,209 | 21 | 4.61/5.0 |
| Emma | 4 | $55,608 | 51 | 4.64/5.0 |
| Jaskran | 1 | $53,669 | 71 | 4.70/5.0 |
Analyzing the strategies of top hosts, such as their property selection, pricing, and guest communication, can offer valuable lessons for optimizing your own Airbnb operations in Rugby.
Dive Deeper: Advanced Rugby STR Market Data (2026)
Ready to unlock more insights? AirROI provides access to advanced metrics and comprehensive Airbnb data for Rugby. Explore detailed analytics beyond this report to refine your investment strategy, optimize pricing, and maximize your vacation rental profits.
Explore Advanced MetricsRugby Short-Term Rental Market Composition (2026): Property & Room Types
Room Type Distribution
Property Type Distribution
Market Composition Insights for Rugby
- The Rugby Airbnb market composition is heavily skewed towards Entire Home/Apt listings, which make up 75.8% of the 128 active rentals. This indicates strong guest preference for privacy and space.
- Looking at the property type distribution in Rugby, House properties are the most common (53.1%), reflecting the local real estate landscape.
- Houses represent a significant 53.1% portion, catering likely to families or larger groups.
- The presence of 8.6% Hotel/Boutique listings indicates integration with traditional hospitality.
- Smaller segments like others, unique stays (combined 9.4%) offer potential for unique stay experiences.
Rugby Airbnb Room Capacity Analysis (2026): Bedroom Distribution
Distribution of Listings by Number of Bedrooms
Room Capacity Insights for Rugby
- The dominant room capacity in Rugby is 1 bedroom listings, making up 35.2% of the market. This suggests a strong demand for properties suitable for couples or solo travelers.
- Together, 1 bedroom and 3 bedrooms properties represent 57.1% of the active Airbnb listings in Rugby, indicating a high concentration in these sizes.
- A significant 30.5% of listings offer 3+ bedrooms, catering to larger groups and families seeking more space in Rugby.
Rugby Vacation Rental Guest Capacity Trends (2026)
Distribution of Listings by Guest Capacity
Guest Capacity Insights for Rugby
- The most common guest capacity trend in Rugby vacation rentals is listings accommodating 2 guests (27.3%). This suggests the primary traveler segment is likely couples or solo travelers.
- Properties designed for 2 guests and 4 guests dominate the Rugby STR market, accounting for 46.8% of listings.
- 23.5% of properties accommodate 6+ guests, serving the market segment for larger families or group travel in Rugby.
- On average, properties in Rugby are equipped to host 3.4 guests.
Rugby Airbnb Booking Patterns (2026): Available vs. Booked Days
Available Days Distribution
Booked Days Distribution
Booking Pattern Insights for Rugby
- The most common availability pattern in Rugby falls within the 271-366 days range, representing 50% of listings. This suggests many properties have significant open periods on their calendars.
- Approximately 80.5% of listings show high availability (181+ days open annually), indicating potential for increased bookings or specific owner usage patterns.
- For booked days, the 91-180 days range is most frequent in Rugby (32%), reflecting common guest stay durations or potential owner blocking patterns.
- A notable 19.5% of properties secure long booking periods (181+ days booked per year), highlighting successful long-term rental strategies or significant owner usage.
Rugby Airbnb Minimum Stay Requirements Analysis
Distribution of Listings by Minimum Night Requirement
1 Night
52 listings
40.6% of total
2 Nights
42 listings
32.8% of total
3 Nights
3 listings
2.3% of total
4-6 Nights
3 listings
2.3% of total
7-29 Nights
8 listings
6.3% of total
30+ Nights
20 listings
15.6% of total
Key Insights
- The most prevalent minimum stay requirement in Rugby is 1 Night, adopted by 40.6% of listings. This highlights the market's preference for shorter, flexible bookings.
- A strong majority (73.4%) of the Rugby Airbnb data shows acceptance of very short stays (1-2 nights), indicating a dynamic, high-turnover market.
- A significant segment (15.6%) caters to monthly stays (30+ nights) in Rugby, pointing to opportunities in the extended-stay market.
Recommendations
- Align with the market by considering a 1 Night minimum stay, as 40.6% of Rugby hosts use this setting.
- Explore offering discounts for stays of 30+ nights to attract the 15.6% of the market seeking extended stays.
- Adjust minimum nights based on seasonality – potentially shorter during low season and longer during peak demand periods in Rugby.
Rugby Airbnb Cancellation Policy Trends Analysis (2026)
Super Strict 30 Days
1 listings
0.8% of total
Super Strict 60 Days
2 listings
1.6% of total
Flexible
41 listings
32% of total
Moderate
48 listings
37.5% of total
Firm
27 listings
21.1% of total
Strict
9 listings
7% of total
Cancellation Policy Insights for Rugby
- The prevailing Airbnb cancellation policy trend in Rugby is Moderate, used by 37.5% of listings.
- There's a relatively balanced mix between guest-friendly (69.5%) and stricter (28.1%) policies, offering choices for different guest needs.
- Strict cancellation policies are quite rare (7%), potentially making listings with this policy less competitive unless justified by high demand or property type.
Recommendations for Hosts
- Consider adopting a Moderate policy to align with the 37.5% market standard in Rugby.
- Using a Strict policy might deter some guests, as only 7% of listings use it. Evaluate if potential revenue protection outweighs possible lower booking rates.
- Regularly review your cancellation policy against competitors and market demand shifts in Rugby.
Rugby STR Booking Lead Time Analysis (2026)
Average Booking Lead Time by Month
Booking Lead Time Insights for Rugby
- The overall average booking lead time for vacation rentals in Rugby is 55 days.
- Guests book furthest in advance for stays during July (average 74 days), likely coinciding with peak travel demand or local events.
- The shortest booking windows occur for stays in February (average 30 days), indicating more last-minute travel plans during this time.
- Seasonally, Summer (66 days avg.) sees the longest lead times, while Spring (46 days avg.) has the shortest, reflecting typical travel planning cycles.
Recommendations for Hosts
- Use the overall average lead time (55 days) as a baseline for your pricing and availability strategy in Rugby.
- For July stays, consider implementing length-of-stay discounts or slightly higher rates for bookings made less than 74 days out to capitalize on advance planning.
- Target marketing efforts for the Summer season well in advance (at least 66 days) to capture early planners.
- Monitor your own booking lead times against these Rugby averages to identify opportunities for dynamic pricing adjustments.
Popular & Essential Airbnb Amenities in Rugby (2026)
Amenity Prevalence
Amenity Insights for Rugby
- Popular amenities like Wifi, TV, Smoke alarm are common but not universal. Offering these can provide a competitive edge.
- Warning: Wifi is not universally provided but is considered essential globally. Ensure reliable Wifi is offered.
Recommendations for Hosts
- Consider adding popular differentiators like Wifi or TV to increase appeal.
- Highlight unique or less common amenities you offer (e.g., hot tub, dedicated workspace, EV charger) in your listing description and photos.
- Regularly check competitor amenities in Rugby to stay competitive.
Rugby Airbnb Guest Demographics & Profile Analysis (2026)
Guest Profile Summary for Rugby
- The typical guest profile for Airbnb in Rugby consists of primarily domestic travelers (89%), often arriving from nearby England, typically belonging to the Post-2000s (Gen Z/Alpha) group (50%), primarily speaking English or French.
- Domestic travelers account for 88.9% of guests.
- Key international markets include United Kingdom (88.9%) and United States (2.8%).
- Top languages spoken are English (67.4%) followed by French (7.8%).
- A significant demographic segment is the Post-2000s (Gen Z/Alpha) group, representing 50% of guests.
Recommendations for Hosts
- Target domestic marketing efforts towards travelers from England and London.
- Tailor amenities and listing descriptions to appeal to the dominant Post-2000s (Gen Z/Alpha) demographic (e.g., highlight fast WiFi, smart home features, local guides).
- Highlight unique local experiences or amenities relevant to the primary guest profile.
- Consider seasonal promotions aligned with peak travel times for key origin markets.
Nearby Short-Term Rental Market Comparison
How does the Rugby Airbnb market stack up against its neighbors? Compare key performance metrics like average monthly revenue, ADR, and occupancy rates in surrounding areas to understand the broader regional STR landscape.
| Market | Active Properties | Monthly Revenue | Daily Rate | Avg. Occupancy |
|---|---|---|---|---|
| Dorney | 11 | $7,510 | $743.63 | 39% |
| Chew Magna | 13 | $7,041 | $430.65 | 44% |
| Englishcombe | 15 | $6,734 | $511.35 | 53% |
| Lambourn | 11 | $6,499 | $723.41 | 31% |
| East Knoyle | 10 | $6,300 | $407.06 | 44% |
| Wraysbury | 16 | $6,199 | $530.56 | 49% |
| City of Westminster | 1,424 | $6,053 | $515.72 | 50% |
| Long Sutton | 18 | $6,029 | $383.58 | 46% |
| Withington | 10 | $5,690 | $499.79 | 44% |
| Ashley | 13 | $5,497 | $364.68 | 54% |