Rother Airbnb Market Analysis 2026: Short Term Rental Data & Vacation Rental Statistics in England, United Kingdom
Is Airbnb profitable in Rother in 2026? Explore comprehensive Airbnb analytics for Rother, England, United Kingdom to uncover income potential. This 2026 STR market report for Rother, based on AirROI data from February 2025 to January 2026, reveals key trends in the market of 917 active listings.
Whether you're considering an Airbnb investment in Rother, optimizing your existing vacation rental, or exploring rental arbitrage opportunities, understanding the Rother Airbnb data is crucial. Leveraging the low regulation environment is key to maximizing your short term rental income potential. Let's dive into the specifics.
Key Rother Airbnb Performance Metrics Overview
Monthly Airbnb Revenue Variations & Income Potential in Rother (2026)
Understanding the monthly revenue variations for Airbnb listings in Rother is key to maximizing your short term rental income potential. Seasonality significantly impacts earnings. Our analysis, based on data from the past 12 months, shows that the peak revenue month for STRs in Rother is typically August, while January often presents the lowest earnings, highlighting opportunities for strategic pricing adjustments during shoulder and low seasons. Explore the typical Airbnb income in Rother across different performance tiers:
- Best-in-class properties (Top 10%) achieve $7,275+ monthly, often utilizing dynamic pricing and superior guest experiences.
- Strong performing properties (Top 25%) earn $4,405 or more, indicating effective management and desirable locations/amenities.
- Typical properties (Median) generate around $2,641 per month, representing the average market performance.
- Entry-level properties (Bottom 25%) see earnings around $1,356, often with potential for optimization.
Average Monthly Airbnb Earnings Trend in Rother
Rother Airbnb Occupancy Rate Trends (2026)
Maximize your bookings by understanding the Rother STR occupancy trends. Seasonal demand shifts significantly influence how often properties are booked. Typically, Augustsees the highest demand (peak season occupancy), while January experiences the lowest (low season). Effective strategies, like adjusting minimum stays or offering promotions, can boost occupancy during slower periods. Here's how different property tiers perform in Rother:
- Best-in-class properties (Top 10%) achieve 79%+ occupancy, indicating high desirability and potentially optimized availability.
- Strong performing properties (Top 25%) maintain 62% or higher occupancy, suggesting good market fit and guest satisfaction.
- Typical properties (Median) have an occupancy rate around 40%.
- Entry-level properties (Bottom 25%) average 22% occupancy, potentially facing higher vacancy.
Average Monthly Occupancy Rate Trend in Rother
Average Daily Rate (ADR) Airbnb Trends in Rother (2026)
Effective short term rental pricing strategy in Rother involves understanding monthly ADR fluctuations. The Average Daily Rate (ADR) for Airbnb in Rother typically peaks in September and dips lowest during March. Leveraging Airbnb dynamic pricing tools or strategies based on this seasonality can significantly boost revenue. Here's a look at the typical nightly rates achieved:
- Best-in-class properties (Top 10%) command rates of $535+ per night, often due to premium features or locations.
- Strong performing properties (Top 25%) achieve nightly rates of $305 or more.
- Typical properties (Median) charge around $193 per night.
- Entry-level properties (Bottom 25%) earn around $145 per night.
Average Daily Rate (ADR) Trend by Month in Rother
Get Live Rother Market Intelligence 👇

Explore Real-time Analytics
Airbnb Seasonality Analysis & Trends in Rother (2026)
Peak Season (August, July, June)
- Revenue averages $4,993 per month
- Occupancy rates average 54.5%
- Daily rates average $289
Shoulder Season
- Revenue averages $3,499 per month
- Occupancy maintains around 41.7%
- Daily rates hold near $275
Low Season (January, February, November)
- Revenue drops to average $2,521 per month
- Occupancy decreases to average 33.0%
- Daily rates adjust to average $267
Seasonality Insights for Rother
- The Airbnb seasonality in Rother shows highly seasonal trends requiring careful strategy. While the sections above show seasonal averages, it's also insightful to look at the extremes:
- During the high season, the absolute peak month showcases Rother's highest earning potential, with monthly revenues capable of climbing to $5,813, occupancy reaching a high of 61.6%, and ADRs peaking at $291.
- Conversely, the slowest single month of the year, typically falling within the low season, marks the market's lowest point. In this month, revenue might dip to $2,227, occupancy could drop to 26.4%, and ADRs may adjust down to $248.
- Understanding both the seasonal averages and these monthly peaks and troughs in revenue, occupancy, and ADR is crucial for maximizing your Airbnb profit potential in Rother.
Seasonal Strategies for Maximizing Profit
- Peak Season: Maximize revenue through premium pricing and potentially longer minimum stays. Ensure high availability.
- Low Season: Offer competitive pricing, special promotions (e.g., extended stay discounts), and flexible cancellation policies. Target off-season travelers like remote workers or budget-conscious guests.
- Shoulder Seasons: Implement dynamic pricing that balances peak and low rates. Target weekend travelers or specific events. Offer slightly more flexible terms than peak season.
- Regularly analyze your own performance against these Rother seasonality benchmarks and adjust your pricing and availability strategy accordingly.
Best Areas for Airbnb Investment in Rother (2026)
Exploring the top neighborhoods for short-term rentals in Rother? This section highlights key areas, outlining why they are attractive for hosts and guests, along with notable local attractions. Consider these locations based on your target guest profile and investment strategy.
| Neighborhood / Area | Why Host Here? (Target Guests & Appeal) | Key Attractions & Landmarks |
|---|---|---|
| Battle | Historic town known for the Battle of Hastings in 1066, attracting history buffs and tourists. A charming location with picturesque streets and attractions. | Battle Abbey, The battlefield, St. Mary the Virgin Church, Battle Museum of Local History, Battle Great Wood |
| Bexhill-on-Sea | Seaside town with a lovely beach and iconic De La Warr Pavilion, popular for beach lovers and cultural events. | De La Warr Pavilion, Bexhill Beach, Egerton Park, Bexhill Museum, The Colonnade |
| Hastings | Bustling coastal town with a rich history, offering a variety of attractions from the beach to cultural hotspots and entertainment. | Hastings Old Town, Hastings Castle, Jerwood Gallery, Hastings Pier, Clambers Indoor Play |
| Rye | Medieval town known for its charming architecture, cobbled streets, and scenic countryside, attracting visitors looking for a quaint getaway. | Rye Castle Museum, St. Mary's Church, Mermaid Street, Visit Rye, Rye Harbour Nature Reserve |
| Eastbourne | Coastal resort famous for its beautiful seafront and Victorian architecture, ideal for families and beachgoers. | Eastbourne Pier, Carpet Gardens, Beachy Head, Towner Art Gallery, Eastbourne Miniature Steam Railway |
| Sidley | Suburb of Bexhill, offering a quiet residential area with easy access to Bexhill and Hastings attractions. | Sidley Park, Local shops, Community events, Green spaces, Transport links to Bexhill |
| Crowhurst | The village known for its scenic beauty and proximity to the countryside, perfect for nature lovers and those seeking a peaceful retreat. | Crowhurst Place, All Saints' Church, Countryside walks, Crowhurst Railway Station, Nature trails |
| Pevensey | Historic village with a Roman castle, attracting visitors interested in history and the seaside. | Pevensey Castle, Pevensey Bay beach, Local shops, Nature walks, Nearby Eastbourne |
Understanding Airbnb License Requirements & STR Laws in Rother (2026)
While Rother, England, United Kingdom currently shows low STR regulations, specific Airbnb license requirements might still exist or change. Always verify the latest short term rental regulations and Airbnb license requirements directly with local government authorities for Rother to ensure full compliance before hosting.
(Source: AirROI data, 2026, based on 1% licensed listings)
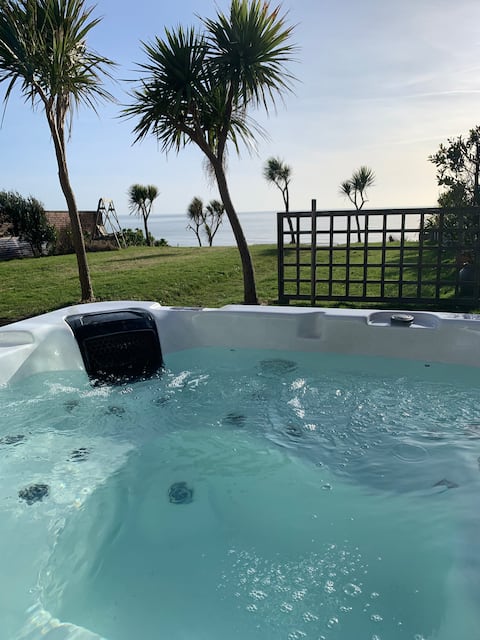
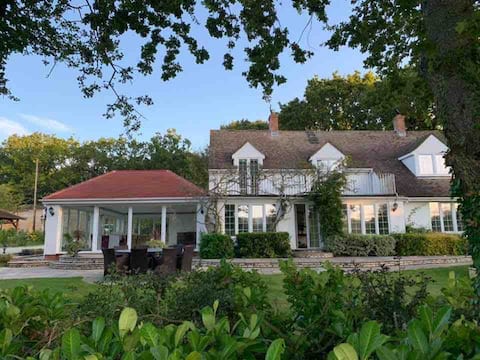
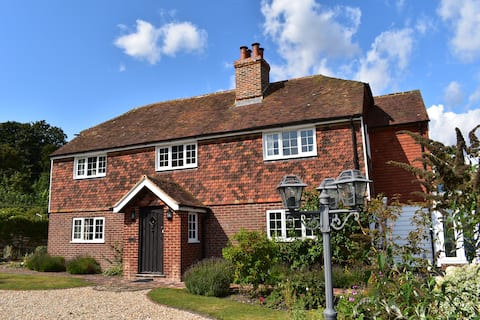
Top Performing Airbnb Properties in Rother (2026)
Benchmark your potential! Explore examples of top-performing Airbnb properties in Rotherbased on Trailing Twelve Month (TTM) revenue. Analyze their characteristics, revenue, occupancy rate, and ADR to understand what drives success in this market.
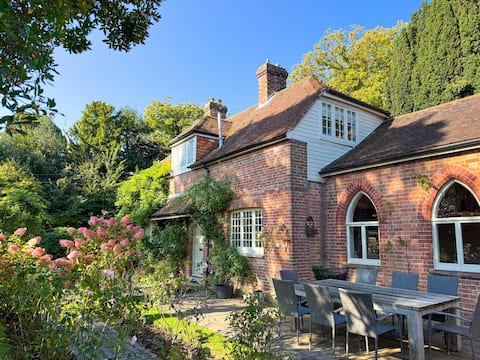
5 Bed in Sedlescombe (oc-c30096)
Entire Place • 5 bedrooms
The Bluff, Cooden Beach
Entire Place • 5 bedrooms

Large Country Home, Indoor Hot Tub, Walled Garden
Entire Place • 8 bedrooms
Littlle Hides Farm detached house
Entire Place • 7 bedrooms
Tollgates, sleeps 9, Rye East Sussex
Entire Place • 5 bedrooms

➡️ The Barn House ⬅️ Swimming Pond▫️Jacuzzi▫️Chicks!
Entire Place • 3 bedrooms
Note: Performance varies based on location, size, amenities, seasonality, and management quality. Data reflects the past 12 months.
Top Performing Airbnb Hosts in Rother (2026)
Learn from the best! This table showcases top-performing Airbnb hosts in Rother based on the number of properties managed and estimated total revenue over the past year. Analyze their scale and performance metrics.
| Host Name | Properties | Grossing Revenue | Stay Reviews | Avg Rating |
|---|---|---|---|---|
| Original Cottages Kent & Susse | 32 | $2,059,051 | 169 | 4.88/5.0 |
| Jacqui | 22 | $1,468,151 | 811 | 4.81/5.0 |
| Cottages | 38 | $1,359,329 | 615 | 4.86/5.0 |
| Beside The Sea Holidays | 31 | $565,038 | 2186 | 4.89/5.0 |
| Quest Cottages | 12 | $475,371 | 368 | 4.71/5.0 |
| Georgina | 17 | $406,222 | 578 | 4.93/5.0 |
| Katherine Victoria | 11 | $366,366 | 238 | 4.88/5.0 |
| Uk Getaways | 28 | $355,047 | 347 | 4.58/5.0 |
| Adrian & Larisa | 1 | $341,064 | 51 | 4.98/5.0 |
| Holidaycottages.Co.Uk | 6 | $312,358 | 15 | 4.50/5.0 |
Analyzing the strategies of top hosts, such as their property selection, pricing, and guest communication, can offer valuable lessons for optimizing your own Airbnb operations in Rother.
Dive Deeper: Advanced Rother STR Market Data (2026)
Ready to unlock more insights? AirROI provides access to advanced metrics and comprehensive Airbnb data for Rother. Explore detailed analytics beyond this report to refine your investment strategy, optimize pricing, and maximize your vacation rental profits.
Explore Advanced MetricsRother Short-Term Rental Market Composition (2026): Property & Room Types
Room Type Distribution
Property Type Distribution
Market Composition Insights for Rother
- The Rother Airbnb market composition is heavily skewed towards Entire Home/Apt listings, which make up 91.5% of the 917 active rentals. This indicates strong guest preference for privacy and space.
- Looking at the property type distribution in Rother, House properties are the most common (59.5%), reflecting the local real estate landscape.
- Houses represent a significant 59.5% portion, catering likely to families or larger groups.
- The presence of 6.5% Hotel/Boutique listings indicates integration with traditional hospitality.
- Smaller segments like unique stays (combined 4.6%) offer potential for unique stay experiences.
Rother Airbnb Room Capacity Analysis (2026): Bedroom Distribution
Distribution of Listings by Number of Bedrooms
Room Capacity Insights for Rother
- The dominant room capacity in Rother is 2 bedrooms listings, making up 29.6% of the market. This suggests a strong demand for properties suitable for couples or solo travelers.
- Together, 2 bedrooms and 1 bedroom properties represent 57.4% of the active Airbnb listings in Rother, indicating a high concentration in these sizes.
- A significant 33.3% of listings offer 3+ bedrooms, catering to larger groups and families seeking more space in Rother.
Rother Vacation Rental Guest Capacity Trends (2026)
Distribution of Listings by Guest Capacity
Guest Capacity Insights for Rother
- The most common guest capacity trend in Rother vacation rentals is listings accommodating 4 guests (25.2%). This suggests the primary traveler segment is likely small families or groups.
- Properties designed for 4 guests and 2 guests dominate the Rother STR market, accounting for 50.1% of listings.
- 36.1% of properties accommodate 6+ guests, serving the market segment for larger families or group travel in Rother.
- On average, properties in Rother are equipped to host 4.4 guests.
Rother Airbnb Booking Patterns (2026): Available vs. Booked Days
Available Days Distribution
Booked Days Distribution
Booking Pattern Insights for Rother
- The most common availability pattern in Rother falls within the 271-366 days range, representing 39.4% of listings. This suggests many properties have significant open periods on their calendars.
- Approximately 75.2% of listings show high availability (181+ days open annually), indicating potential for increased bookings or specific owner usage patterns.
- For booked days, the 91-180 days range is most frequent in Rother (36.8%), reflecting common guest stay durations or potential owner blocking patterns.
- A notable 26.0% of properties secure long booking periods (181+ days booked per year), highlighting successful long-term rental strategies or significant owner usage.
Rother Airbnb Minimum Stay Requirements Analysis
Distribution of Listings by Minimum Night Requirement
1 Night
189 listings
20.7% of total
2 Nights
265 listings
29% of total
3 Nights
72 listings
7.9% of total
4-6 Nights
11 listings
1.2% of total
7-29 Nights
4 listings
0.4% of total
30+ Nights
373 listings
40.8% of total
Key Insights
- The most prevalent minimum stay requirement in Rother is 30+ Nights, adopted by 40.8% of listings. This highlights the market's preference for longer commitments.
- A significant segment (40.8%) caters to monthly stays (30+ nights) in Rother, pointing to opportunities in the extended-stay market.
Recommendations
- Align with the market by considering a 30+ Nights minimum stay, as 40.8% of Rother hosts use this setting.
- If feasible, allowing 1-night stays, especially midweek or during low season, could capture last-minute bookings, as only 20.7% currently do.
- Explore offering discounts for stays of 30+ nights to attract the 40.8% of the market seeking extended stays.
- Adjust minimum nights based on seasonality – potentially shorter during low season and longer during peak demand periods in Rother.
Rother Airbnb Cancellation Policy Trends Analysis (2026)
Non-refundable
2 listings
0.2% of total
Super Strict 30 Days
4 listings
0.4% of total
Limited
7 listings
0.8% of total
Super Strict 60 Days
97 listings
10.6% of total
Flexible
131 listings
14.4% of total
Moderate
210 listings
23% of total
Firm
358 listings
39.3% of total
Strict
103 listings
11.3% of total
Cancellation Policy Insights for Rother
- The prevailing Airbnb cancellation policy trend in Rother is Firm, used by 39.3% of listings.
- A majority (50.6%) of hosts in Rother utilize Firm or Strict policies, indicating a market where hosts prioritize booking security.
Recommendations for Hosts
- Consider adopting a Firm policy to align with the 39.3% market standard in Rother.
- Using a Strict policy might deter some guests, as only 11.3% of listings use it. Evaluate if potential revenue protection outweighs possible lower booking rates.
- Regularly review your cancellation policy against competitors and market demand shifts in Rother.
Rother STR Booking Lead Time Analysis (2026)
Average Booking Lead Time by Month
Booking Lead Time Insights for Rother
- The overall average booking lead time for vacation rentals in Rother is 62 days.
- Guests book furthest in advance for stays during August (average 91 days), likely coinciding with peak travel demand or local events.
- The shortest booking windows occur for stays in March (average 38 days), indicating more last-minute travel plans during this time.
- Seasonally, Summer (78 days avg.) sees the longest lead times, while Spring (54 days avg.) has the shortest, reflecting typical travel planning cycles.
Recommendations for Hosts
- Use the overall average lead time (62 days) as a baseline for your pricing and availability strategy in Rother.
- For August stays, consider implementing length-of-stay discounts or slightly higher rates for bookings made less than 91 days out to capitalize on advance planning.
- Target marketing efforts for the Summer season well in advance (at least 78 days) to capture early planners.
- Monitor your own booking lead times against these Rother averages to identify opportunities for dynamic pricing adjustments.
Popular & Essential Airbnb Amenities in Rother (2026)
Amenity Prevalence
Amenity Insights for Rother
- Popular amenities like Heating, Smoke alarm, TV are common but not universal. Offering these can provide a competitive edge.
- Warning: Wifi is not universally provided but is considered essential globally. Ensure reliable Wifi is offered.
Recommendations for Hosts
- Consider adding popular differentiators like Heating or Smoke alarm to increase appeal.
- Highlight unique or less common amenities you offer (e.g., hot tub, dedicated workspace, EV charger) in your listing description and photos.
- Regularly check competitor amenities in Rother to stay competitive.
Rother Airbnb Guest Demographics & Profile Analysis (2026)
Guest Profile Summary for Rother
- The typical guest profile for Airbnb in Rother consists of primarily domestic travelers (89%), often arriving from nearby England, typically belonging to the Post-2000s (Gen Z/Alpha) group (50%), primarily speaking English or French.
- Domestic travelers account for 89.3% of guests.
- Key international markets include United Kingdom (89.3%) and United States (2.3%).
- Top languages spoken are English (60.9%) followed by French (11.4%).
- A significant demographic segment is the Post-2000s (Gen Z/Alpha) group, representing 50% of guests.
Recommendations for Hosts
- Target domestic marketing efforts towards travelers from England and London.
- Tailor amenities and listing descriptions to appeal to the dominant Post-2000s (Gen Z/Alpha) demographic (e.g., highlight fast WiFi, smart home features, local guides).
- Highlight unique local experiences or amenities relevant to the primary guest profile.
- Consider seasonal promotions aligned with peak travel times for key origin markets.
Nearby Short-Term Rental Market Comparison
How does the Rother Airbnb market stack up against its neighbors? Compare key performance metrics like average monthly revenue, ADR, and occupancy rates in surrounding areas to understand the broader regional STR landscape.
| Market | Active Properties | Monthly Revenue | Daily Rate | Avg. Occupancy |
|---|---|---|---|---|
| Dorney | 11 | $7,510 | $743.63 | 39% |
| Wraysbury | 16 | $6,199 | $530.56 | 49% |
| City of Westminster | 1,424 | $6,053 | $515.72 | 50% |
| Old Windsor | 20 | $4,177 | $286.69 | 49% |
| Cookham | 20 | $4,138 | $347.79 | 47% |
| Bourne End | 10 | $4,086 | $496.86 | 46% |
| La Poterie-Cap-d'Antifer | 15 | $3,878 | $273.66 | 48% |
| City of London | 242 | $3,522 | $340.82 | 47% |
| Saint-Étienne-la-Thillaye | 23 | $3,486 | $390.94 | 35% |
| Roedean | 52 | $3,379 | $273.40 | 45% |