Plymouth Airbnb Market Analysis 2026: Short Term Rental Data & Vacation Rental Statistics in England, United Kingdom
Is Airbnb profitable in Plymouth in 2026? Explore comprehensive Airbnb analytics for Plymouth, England, United Kingdom to uncover income potential. This 2026 STR market report for Plymouth, based on AirROI data from February 2025 to January 2026, reveals key trends in the market of 638 active listings.
Whether you're considering an Airbnb investment in Plymouth, optimizing your existing vacation rental, or exploring rental arbitrage opportunities, understanding the Plymouth Airbnb data is crucial. Leveraging the low regulation environment is key to maximizing your short term rental income potential. Let's dive into the specifics.
Key Plymouth Airbnb Performance Metrics Overview
Monthly Airbnb Revenue Variations & Income Potential in Plymouth (2026)
Understanding the monthly revenue variations for Airbnb listings in Plymouth is key to maximizing your short term rental income potential. Seasonality significantly impacts earnings. Our analysis, based on data from the past 12 months, shows that the peak revenue month for STRs in Plymouth is typically August, while January often presents the lowest earnings, highlighting opportunities for strategic pricing adjustments during shoulder and low seasons. Explore the typical Airbnb income in Plymouth across different performance tiers:
- Best-in-class properties (Top 10%) achieve $4,270+ monthly, often utilizing dynamic pricing and superior guest experiences.
- Strong performing properties (Top 25%) earn $2,962 or more, indicating effective management and desirable locations/amenities.
- Typical properties (Median) generate around $1,754 per month, representing the average market performance.
- Entry-level properties (Bottom 25%) see earnings around $824, often with potential for optimization.
Average Monthly Airbnb Earnings Trend in Plymouth
Plymouth Airbnb Occupancy Rate Trends (2026)
Maximize your bookings by understanding the Plymouth STR occupancy trends. Seasonal demand shifts significantly influence how often properties are booked. Typically, Augustsees the highest demand (peak season occupancy), while January experiences the lowest (low season). Effective strategies, like adjusting minimum stays or offering promotions, can boost occupancy during slower periods. Here's how different property tiers perform in Plymouth:
- Best-in-class properties (Top 10%) achieve 82%+ occupancy, indicating high desirability and potentially optimized availability.
- Strong performing properties (Top 25%) maintain 65% or higher occupancy, suggesting good market fit and guest satisfaction.
- Typical properties (Median) have an occupancy rate around 44%.
- Entry-level properties (Bottom 25%) average 21% occupancy, potentially facing higher vacancy.
Average Monthly Occupancy Rate Trend in Plymouth
Average Daily Rate (ADR) Airbnb Trends in Plymouth (2026)
Effective short term rental pricing strategy in Plymouth involves understanding monthly ADR fluctuations. The Average Daily Rate (ADR) for Airbnb in Plymouth typically peaks in August and dips lowest during February. Leveraging Airbnb dynamic pricing tools or strategies based on this seasonality can significantly boost revenue. Here's a look at the typical nightly rates achieved:
- Best-in-class properties (Top 10%) command rates of $285+ per night, often due to premium features or locations.
- Strong performing properties (Top 25%) achieve nightly rates of $198 or more.
- Typical properties (Median) charge around $138 per night.
- Entry-level properties (Bottom 25%) earn around $91 per night.
Average Daily Rate (ADR) Trend by Month in Plymouth
Get Live Plymouth Market Intelligence 👇

Explore Real-time Analytics
Airbnb Seasonality Analysis & Trends in Plymouth (2026)
Peak Season (August, July, September)
- Revenue averages $2,834 per month
- Occupancy rates average 52.9%
- Daily rates average $174
Shoulder Season
- Revenue averages $2,094 per month
- Occupancy maintains around 43.9%
- Daily rates hold near $159
Low Season (January, February, December)
- Revenue drops to average $1,654 per month
- Occupancy decreases to average 37.5%
- Daily rates adjust to average $154
Seasonality Insights for Plymouth
- The Airbnb seasonality in Plymouth shows highly seasonal trends requiring careful strategy. While the sections above show seasonal averages, it's also insightful to look at the extremes:
- During the high season, the absolute peak month showcases Plymouth's highest earning potential, with monthly revenues capable of climbing to $3,291, occupancy reaching a high of 56.6%, and ADRs peaking at $178.
- Conversely, the slowest single month of the year, typically falling within the low season, marks the market's lowest point. In this month, revenue might dip to $1,433, occupancy could drop to 31.9%, and ADRs may adjust down to $145.
- Understanding both the seasonal averages and these monthly peaks and troughs in revenue, occupancy, and ADR is crucial for maximizing your Airbnb profit potential in Plymouth.
Seasonal Strategies for Maximizing Profit
- Peak Season: Maximize revenue through premium pricing and potentially longer minimum stays. Ensure high availability.
- Low Season: Offer competitive pricing, special promotions (e.g., extended stay discounts), and flexible cancellation policies. Target off-season travelers like remote workers or budget-conscious guests.
- Shoulder Seasons: Implement dynamic pricing that balances peak and low rates. Target weekend travelers or specific events. Offer slightly more flexible terms than peak season.
- Regularly analyze your own performance against these Plymouth seasonality benchmarks and adjust your pricing and availability strategy accordingly.
Best Areas for Airbnb Investment in Plymouth (2026)
Exploring the top neighborhoods for short-term rentals in Plymouth? This section highlights key areas, outlining why they are attractive for hosts and guests, along with notable local attractions. Consider these locations based on your target guest profile and investment strategy.
| Neighborhood / Area | Why Host Here? (Target Guests & Appeal) | Key Attractions & Landmarks |
|---|---|---|
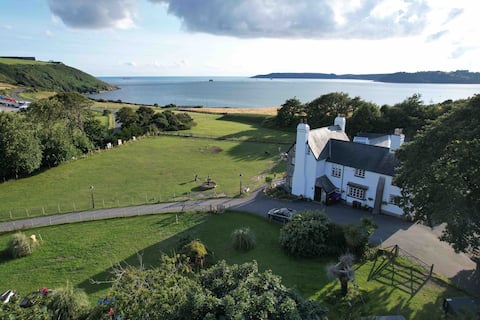
| The Hoe | Famous for its stunning sea views and historic significance, The Hoe attracts tourists for its iconic landmarks and beautiful parks, making it a prime location for short-term rentals. | Plymouth Hoe, Smeaton's Tower, Royal William Yard, Mayflower Steps, The Royal Citadel |
| Plymouth City Centre | The vibrant heart of the city, ideal for visitors seeking shopping, dining, and nightlife. Its central location makes it convenient for tourists and business travelers alike. | Drake Circus Shopping Centre, Theatre Royal Plymouth, Plymouth Market, National Marine Aquarium, Royal Parade |
| Mutley Plain | A lively area popular among students and young professionals, known for its cafes, bars, and shops. This location is perfect for hosting guests looking for a lively atmosphere close to the university. | Mutley Plain shops, Student accommodations, Local cafes and restaurants, Sutton Harbour, Plymouth University |
| Mount Edgcumbe | Set in a historic park, this area offers beautiful views and outdoor activities, appealing to nature lovers and those looking for a retreat from the urban environment. | Mount Edgcumbe House and Country Park, The Cremyll Ferry, Plymouth Sound, Gardens and walking trails, Historic buildings |
| Stoke Damerel | A residential area with a mix of housing types, appealing to families and business travelers due to its proximity to the city and amenities. | Royal Navy Museum, Local parks, Proximity to city center, Good transport links, Nearby schools |
| Plympton | A suburb of Plymouth that's great for families looking for larger spaces. Offers a quieter environment but with good access to the city and local amenities. | Saltram House, Local parks, Shopping facilities, Community events, Historic sites |
| Saltram | Renowned for its beautiful National Trust property and gardens, this area attracts visitors interested in history and nature, making it a unique Airbnb spot. | Saltram House, Gardens, Walking trails, Historical exhibits, Picnic areas |
| Peverell | A residential neighborhood with a friendly community vibe, ideal for families and professionals, and conveniently located near various schools and parks. | Local shops, Parks, Schools, Community events, Residential charm |
Understanding Airbnb License Requirements & STR Laws in Plymouth (2026)
While Plymouth, England, United Kingdom currently shows low STR regulations, specific Airbnb license requirements might still exist or change. Always verify the latest short term rental regulations and Airbnb license requirements directly with local government authorities for Plymouth to ensure full compliance before hosting.
(Source: AirROI data, 2026, based on 0% licensed listings)
Top Performing Airbnb Properties in Plymouth (2026)
Benchmark your potential! Explore examples of top-performing Airbnb properties in Plymouthbased on Trailing Twelve Month (TTM) revenue. Analyze their characteristics, revenue, occupancy rate, and ADR to understand what drives success in this market.
St Anne's House, Sea Views, 7 Bedrooms
Entire Place • 7 bedrooms
Ocean City Retreat (2-25 guests) with parking x3
Entire Place • 7 bedrooms
Fisherman's Cottage
Entire Place • 1 bedroom
Ocean City x5 Flats (30 Guests)
Entire Place • 10 bedrooms
Huge spacious 8 bed luxury villa
Entire Place • 8 bedrooms

The Old Canoe Club
Entire Place • 3 bedrooms
Note: Performance varies based on location, size, amenities, seasonality, and management quality. Data reflects the past 12 months.
Top Performing Airbnb Hosts in Plymouth (2026)
Learn from the best! This table showcases top-performing Airbnb hosts in Plymouth based on the number of properties managed and estimated total revenue over the past year. Analyze their scale and performance metrics.
| Host Name | Properties | Grossing Revenue | Stay Reviews | Avg Rating |
|---|---|---|---|---|
| Pureserviced | 57 | $1,259,011 | 1817 | 4.62/5.0 |
| Josiah | 21 | $854,491 | 1482 | 4.83/5.0 |
| Cottages | 7 | $315,268 | 154 | 4.76/5.0 |
| Zaneta | 5 | $219,033 | 465 | 4.91/5.0 |
| Royal William Yard Apartments | 11 | $211,203 | 112 | 4.89/5.0 |
| Neal | 6 | $186,434 | 262 | 4.84/5.0 |
| William | 4 | $167,252 | 406 | 4.90/5.0 |
| Luxe Living By | 4 | $147,188 | 224 | 4.77/5.0 |
| Habita | 11 | $136,624 | 122 | 4.58/5.0 |
| Caroline | 3 | $128,861 | 180 | 4.70/5.0 |
Analyzing the strategies of top hosts, such as their property selection, pricing, and guest communication, can offer valuable lessons for optimizing your own Airbnb operations in Plymouth.
Dive Deeper: Advanced Plymouth STR Market Data (2026)
Ready to unlock more insights? AirROI provides access to advanced metrics and comprehensive Airbnb data for Plymouth. Explore detailed analytics beyond this report to refine your investment strategy, optimize pricing, and maximize your vacation rental profits.
Explore Advanced MetricsPlymouth Short-Term Rental Market Composition (2026): Property & Room Types
Room Type Distribution
Property Type Distribution
Market Composition Insights for Plymouth
- The Plymouth Airbnb market composition is heavily skewed towards Entire Home/Apt listings, which make up 77% of the 638 active rentals. This indicates strong guest preference for privacy and space.
- Looking at the property type distribution in Plymouth, Apartment/Condo properties are the most common (55.3%), reflecting the local real estate landscape.
- Houses represent a significant 35.6% portion, catering likely to families or larger groups.
- The presence of 5.6% Hotel/Boutique listings indicates integration with traditional hospitality.
- Smaller segments like others, outdoor/unique, unique stays (combined 3.5%) offer potential for unique stay experiences.
Plymouth Airbnb Room Capacity Analysis (2026): Bedroom Distribution
Distribution of Listings by Number of Bedrooms
Room Capacity Insights for Plymouth
- The dominant room capacity in Plymouth is 1 bedroom listings, making up 36.8% of the market. This suggests a strong demand for properties suitable for couples or solo travelers.
- Together, 1 bedroom and 2 bedrooms properties represent 62.3% of the active Airbnb listings in Plymouth, indicating a high concentration in these sizes.
- A significant 21.3% of listings offer 3+ bedrooms, catering to larger groups and families seeking more space in Plymouth.
Plymouth Vacation Rental Guest Capacity Trends (2026)
Distribution of Listings by Guest Capacity
Guest Capacity Insights for Plymouth
- The most common guest capacity trend in Plymouth vacation rentals is listings accommodating 2 guests (26.8%). This suggests the primary traveler segment is likely couples or solo travelers.
- Properties designed for 2 guests and 4 guests dominate the Plymouth STR market, accounting for 48.0% of listings.
- 25.5% of properties accommodate 6+ guests, serving the market segment for larger families or group travel in Plymouth.
- On average, properties in Plymouth are equipped to host 3.5 guests.
Plymouth Airbnb Booking Patterns (2026): Available vs. Booked Days
Available Days Distribution
Booked Days Distribution
Booking Pattern Insights for Plymouth
- The most common availability pattern in Plymouth falls within the 271-366 days range, representing 41.5% of listings. This suggests many properties have significant open periods on their calendars.
- Approximately 71.8% of listings show high availability (181+ days open annually), indicating potential for increased bookings or specific owner usage patterns.
- For booked days, the 91-180 days range is most frequent in Plymouth (30.7%), reflecting common guest stay durations or potential owner blocking patterns.
- A notable 28.5% of properties secure long booking periods (181+ days booked per year), highlighting successful long-term rental strategies or significant owner usage.
Plymouth Airbnb Minimum Stay Requirements Analysis
Distribution of Listings by Minimum Night Requirement
1 Night
188 listings
29.5% of total
2 Nights
166 listings
26% of total
3 Nights
59 listings
9.2% of total
4-6 Nights
19 listings
3% of total
7-29 Nights
9 listings
1.4% of total
30+ Nights
197 listings
30.9% of total
Key Insights
- The most prevalent minimum stay requirement in Plymouth is 30+ Nights, adopted by 30.9% of listings. This highlights the market's preference for longer commitments.
- A significant segment (30.9%) caters to monthly stays (30+ nights) in Plymouth, pointing to opportunities in the extended-stay market.
Recommendations
- Align with the market by considering a 30+ Nights minimum stay, as 30.9% of Plymouth hosts use this setting.
- If feasible, allowing 1-night stays, especially midweek or during low season, could capture last-minute bookings, as only 29.5% currently do.
- Explore offering discounts for stays of 30+ nights to attract the 30.9% of the market seeking extended stays.
- Adjust minimum nights based on seasonality – potentially shorter during low season and longer during peak demand periods in Plymouth.
Plymouth Airbnb Cancellation Policy Trends Analysis (2026)
Refundable
3 listings
0.5% of total
Super Strict 30 Days
7 listings
1.1% of total
Limited
5 listings
0.8% of total
Super Strict 60 Days
11 listings
1.7% of total
Flexible
141 listings
22.2% of total
Moderate
233 listings
36.7% of total
Firm
181 listings
28.5% of total
Strict
54 listings
8.5% of total
Cancellation Policy Insights for Plymouth
- The prevailing Airbnb cancellation policy trend in Plymouth is Moderate, used by 36.7% of listings.
- There's a relatively balanced mix between guest-friendly (58.9%) and stricter (37.0%) policies, offering choices for different guest needs.
- Strict cancellation policies are quite rare (8.5%), potentially making listings with this policy less competitive unless justified by high demand or property type.
Recommendations for Hosts
- Consider adopting a Moderate policy to align with the 36.7% market standard in Plymouth.
- Using a Strict policy might deter some guests, as only 8.5% of listings use it. Evaluate if potential revenue protection outweighs possible lower booking rates.
- Regularly review your cancellation policy against competitors and market demand shifts in Plymouth.
Plymouth STR Booking Lead Time Analysis (2026)
Average Booking Lead Time by Month
Booking Lead Time Insights for Plymouth
- The overall average booking lead time for vacation rentals in Plymouth is 43 days.
- Guests book furthest in advance for stays during August (average 63 days), likely coinciding with peak travel demand or local events.
- The shortest booking windows occur for stays in February (average 26 days), indicating more last-minute travel plans during this time.
- Seasonally, Summer (54 days avg.) sees the longest lead times, while Winter (35 days avg.) has the shortest, reflecting typical travel planning cycles.
Recommendations for Hosts
- Use the overall average lead time (43 days) as a baseline for your pricing and availability strategy in Plymouth.
- For August stays, consider implementing length-of-stay discounts or slightly higher rates for bookings made less than 63 days out to capitalize on advance planning.
- Target marketing efforts for the Summer season well in advance (at least 54 days) to capture early planners.
- Monitor your own booking lead times against these Plymouth averages to identify opportunities for dynamic pricing adjustments.
Popular & Essential Airbnb Amenities in Plymouth (2026)
Amenity Prevalence
Amenity Insights for Plymouth
- Essential amenities in Plymouth that guests expect include: Wifi, Smoke alarm. Lacking these (any) could significantly impact bookings.
- Popular amenities like Heating, TV, Hot water are common but not universal. Offering these can provide a competitive edge.
Recommendations for Hosts
- Ensure your listing includes all essential amenities for Plymouth: Wifi, Smoke alarm.
- Prioritize adding missing essentials: Wifi, Smoke alarm.
- Consider adding popular differentiators like Heating or TV to increase appeal.
- Highlight unique or less common amenities you offer (e.g., hot tub, dedicated workspace, EV charger) in your listing description and photos.
- Regularly check competitor amenities in Plymouth to stay competitive.
Plymouth Airbnb Guest Demographics & Profile Analysis (2026)
Guest Profile Summary for Plymouth
- The typical guest profile for Airbnb in Plymouth consists of primarily domestic travelers (84%), often arriving from nearby England, typically belonging to the Post-2000s (Gen Z/Alpha) group (50%), primarily speaking English or French.
- Domestic travelers account for 84.4% of guests.
- Key international markets include United Kingdom (84.4%) and United States (2.5%).
- Top languages spoken are English (64.7%) followed by French (8.7%).
- A significant demographic segment is the Post-2000s (Gen Z/Alpha) group, representing 50% of guests.
Recommendations for Hosts
- Target domestic marketing efforts towards travelers from England and London.
- Tailor amenities and listing descriptions to appeal to the dominant Post-2000s (Gen Z/Alpha) demographic (e.g., highlight fast WiFi, smart home features, local guides).
- Highlight unique local experiences or amenities relevant to the primary guest profile.
- Consider seasonal promotions aligned with peak travel times for key origin markets.
Nearby Short-Term Rental Market Comparison
How does the Plymouth Airbnb market stack up against its neighbors? Compare key performance metrics like average monthly revenue, ADR, and occupancy rates in surrounding areas to understand the broader regional STR landscape.
| Market | Active Properties | Monthly Revenue | Daily Rate | Avg. Occupancy |
|---|---|---|---|---|
| Angle | 13 | $6,069 | $626.63 | 50% |
| Milverton | 10 | $5,067 | $377.17 | 48% |
| Southerndown | 16 | $5,064 | $409.45 | 46% |
| Southgate | 13 | $4,781 | $282.69 | 56% |
| Bridgwater | 18 | $4,662 | $355.91 | 53% |
| Crai | 31 | $4,496 | $552.02 | 38% |
| New Polzeath | 17 | $4,089 | $281.24 | 54% |
| Llantrisant | 15 | $4,086 | $275.56 | 44% |
| Trenance | 25 | $4,037 | $513.80 | 39% |
| Rhossili | 30 | $4,019 | $313.39 | 50% |