Oxford Airbnb Market Analysis 2026: Short Term Rental Data & Vacation Rental Statistics in England, United Kingdom
Is Airbnb profitable in Oxford in 2026? Explore comprehensive Airbnb analytics for Oxford, England, United Kingdom to uncover income potential. This 2026 STR market report for Oxford, based on AirROI data from February 2025 to January 2026, reveals key trends in the bustling market of 1,110 active listings.
Whether you're considering an Airbnb investment in Oxford, optimizing your existing vacation rental, or exploring rental arbitrage opportunities, understanding the Oxford Airbnb data is crucial. Leveraging the low regulation environment is key to maximizing your short term rental income potential. Let's dive into the specifics.
Key Oxford Airbnb Performance Metrics Overview
Monthly Airbnb Revenue Variations & Income Potential in Oxford (2026)
Understanding the monthly revenue variations for Airbnb listings in Oxford is key to maximizing your short term rental income potential. Seasonality significantly impacts earnings. Our analysis, based on data from the past 12 months, shows that the peak revenue month for STRs in Oxford is typically July, while January often presents the lowest earnings, highlighting opportunities for strategic pricing adjustments during shoulder and low seasons. Explore the typical Airbnb income in Oxford across different performance tiers:
- Best-in-class properties (Top 10%) achieve $6,407+ monthly, often utilizing dynamic pricing and superior guest experiences.
- Strong performing properties (Top 25%) earn $4,000 or more, indicating effective management and desirable locations/amenities.
- Typical properties (Median) generate around $2,105 per month, representing the average market performance.
- Entry-level properties (Bottom 25%) see earnings around $1,027, often with potential for optimization.
Average Monthly Airbnb Earnings Trend in Oxford
Oxford Airbnb Occupancy Rate Trends (2026)
Maximize your bookings by understanding the Oxford STR occupancy trends. Seasonal demand shifts significantly influence how often properties are booked. Typically, Julysees the highest demand (peak season occupancy), while January experiences the lowest (low season). Effective strategies, like adjusting minimum stays or offering promotions, can boost occupancy during slower periods. Here's how different property tiers perform in Oxford:
- Best-in-class properties (Top 10%) achieve 87%+ occupancy, indicating high desirability and potentially optimized availability.
- Strong performing properties (Top 25%) maintain 74% or higher occupancy, suggesting good market fit and guest satisfaction.
- Typical properties (Median) have an occupancy rate around 53%.
- Entry-level properties (Bottom 25%) average 27% occupancy, potentially facing higher vacancy.
Average Monthly Occupancy Rate Trend in Oxford
Average Daily Rate (ADR) Airbnb Trends in Oxford (2026)
Effective short term rental pricing strategy in Oxford involves understanding monthly ADR fluctuations. The Average Daily Rate (ADR) for Airbnb in Oxford typically peaks in September and dips lowest during February. Leveraging Airbnb dynamic pricing tools or strategies based on this seasonality can significantly boost revenue. Here's a look at the typical nightly rates achieved:
- Best-in-class properties (Top 10%) command rates of $340+ per night, often due to premium features or locations.
- Strong performing properties (Top 25%) achieve nightly rates of $242 or more.
- Typical properties (Median) charge around $149 per night.
- Entry-level properties (Bottom 25%) earn around $86 per night.
Average Daily Rate (ADR) Trend by Month in Oxford
Get Live Oxford Market Intelligence 👇

Explore Real-time Analytics
Airbnb Seasonality Analysis & Trends in Oxford (2026)
Peak Season (July, September, June)
- Revenue averages $3,663 per month
- Occupancy rates average 58.7%
- Daily rates average $193
Shoulder Season
- Revenue averages $2,912 per month
- Occupancy maintains around 51.5%
- Daily rates hold near $181
Low Season (January, February, December)
- Revenue drops to average $2,075 per month
- Occupancy decreases to average 41.5%
- Daily rates adjust to average $177
Seasonality Insights for Oxford
- The Airbnb seasonality in Oxford shows highly seasonal trends requiring careful strategy. While the sections above show seasonal averages, it's also insightful to look at the extremes:
- During the high season, the absolute peak month showcases Oxford's highest earning potential, with monthly revenues capable of climbing to $4,312, occupancy reaching a high of 63.7%, and ADRs peaking at $195.
- Conversely, the slowest single month of the year, typically falling within the low season, marks the market's lowest point. In this month, revenue might dip to $1,653, occupancy could drop to 33.4%, and ADRs may adjust down to $168.
- Understanding both the seasonal averages and these monthly peaks and troughs in revenue, occupancy, and ADR is crucial for maximizing your Airbnb profit potential in Oxford.
Seasonal Strategies for Maximizing Profit
- Peak Season: Maximize revenue through premium pricing and potentially longer minimum stays. Ensure high availability.
- Low Season: Offer competitive pricing, special promotions (e.g., extended stay discounts), and flexible cancellation policies. Target off-season travelers like remote workers or budget-conscious guests.
- Shoulder Seasons: Implement dynamic pricing that balances peak and low rates. Target weekend travelers or specific events. Offer slightly more flexible terms than peak season.
- Regularly analyze your own performance against these Oxford seasonality benchmarks and adjust your pricing and availability strategy accordingly.
Best Areas for Airbnb Investment in Oxford (2026)
Exploring the top neighborhoods for short-term rentals in Oxford? This section highlights key areas, outlining why they are attractive for hosts and guests, along with notable local attractions. Consider these locations based on your target guest profile and investment strategy.
| Neighborhood / Area | Why Host Here? (Target Guests & Appeal) | Key Attractions & Landmarks |
|---|---|---|
| City Centre | The vibrant heart of Oxford, known for its stunning architecture, historic sites, and proximity to universities. Ideal for tourists and academics alike, offering a rich cultural experience. | Ashmolean Museum, Bodleian Library, Cornmarket Street, University of Oxford, Radcliffe Camera, Christ Church College |
| Jericho | A quaint district filled with independent shops, cafes, and beautiful canals. Popular among tourists seeking a more local experience while still being close to downtown attractions. | Canal Walks, Port Meadow, The Natural History Museum, Modern Art Oxford, Jericho's eateries and boutiques |
| North Oxford | Known for its leafy streets and family-friendly atmosphere. Attractive to longer-term visitors and professionals who prefer a quieter stay away from the hustle of the city centre. | University Parks, The Woodstock Road, Summertown shops and restaurants, Oxford University Press Museum, Rugby clubs |
| East Oxford | A culturally diverse area known for its vibrant nightlife and artistic community. Great for younger visitors looking for a mix of relaxation and fun, with various entertainment options. | Cowley Road, The Oxford Community Centre, Cowley Road Carnival, Local pubs and bars, Independent cinemas |
| Headington | Home to many students and medical professionals due to its proximity to hospitals and universities. This area offers a good mix of residential and commercial opportunities. | Headington Shark, Oxford Brookes University, Bury Knowle Park, Headington shops and cafes, The John Radcliffe Hospital |
| Botley | A suburban area just outside the city centre with great transport links. Suitable for families and longer-term stays, combining green spaces with urban amenities. | Botley Park, Oxpens Road, The Oxford United Football Club, Local shopping areas, The Oxford Canal |
| Summertown | An affluent area known for its high-quality homes and strong community vibe. Attracts both short and long-term visitors looking for tranquillity with easy access to the city. | Summertown shops, Local parks, The Oxford Playhouse, Restaurants, Galleries |
| Cowley | A lively area popular with students due to its bars and affordable accommodations. Perfect for budget travelers and younger demographics looking for a fun atmosphere. | Cowley Road shopping, Parks, The Ultimate Picture Palace, Local cafés and diners, Rugby festivities |
Understanding Airbnb License Requirements & STR Laws in Oxford (2026)
While Oxford, England, United Kingdom currently shows low STR regulations, specific Airbnb license requirements might still exist or change. Always verify the latest short term rental regulations and Airbnb license requirements directly with local government authorities for Oxford to ensure full compliance before hosting.
(Source: AirROI data, 2026, based on 0% licensed listings)
Top Performing Airbnb Properties in Oxford (2026)
Benchmark your potential! Explore examples of top-performing Airbnb properties in Oxfordbased on Trailing Twelve Month (TTM) revenue. Analyze their characteristics, revenue, occupancy rate, and ADR to understand what drives success in this market.
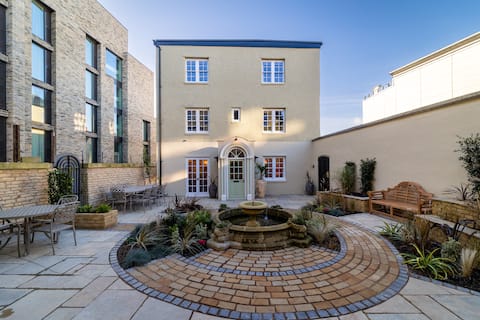
Stunning 4 bed historic townhouse in Oxfords heart
Entire Place • 4 bedrooms

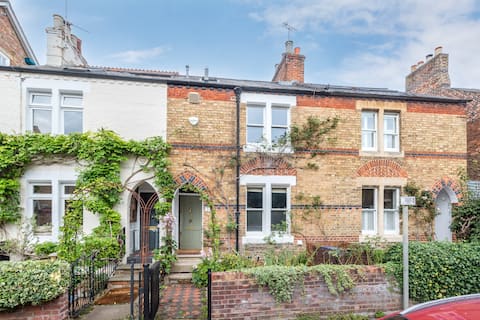
Beautiful Victorian Home near central Oxford
Entire Place • 4 bedrooms
Spacious 4 bedroom city centre house, free parking
Entire Place • 4 bedrooms
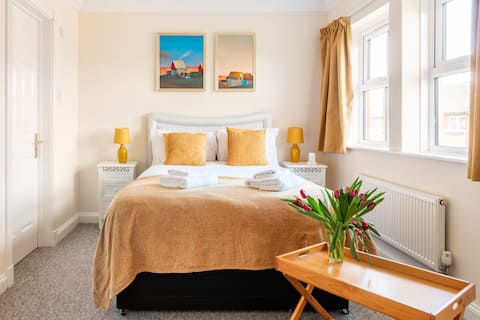
The Professor’s House - 3 Bedrooms - Jericho
Entire Place • 3 bedrooms

Stunning Four Bedroom Town House in City Centre
Entire Place • 4 bedrooms

Observatory Retreat: Luxury Jericho Townhouse
Entire Place • 3 bedrooms
Note: Performance varies based on location, size, amenities, seasonality, and management quality. Data reflects the past 12 months.
Top Performing Airbnb Hosts in Oxford (2026)
Learn from the best! This table showcases top-performing Airbnb hosts in Oxford based on the number of properties managed and estimated total revenue over the past year. Analyze their scale and performance metrics.
| Host Name | Properties | Grossing Revenue | Stay Reviews | Avg Rating |
|---|---|---|---|---|
| Penny & Sinclair | 52 | $1,003,994 | 726 | 4.67/5.0 |
| Mamadou & Polly | 10 | $676,130 | 1572 | 4.78/5.0 |
| Sharon | 11 | $451,755 | 262 | 4.77/5.0 |
| Oxfordshire Living | 7 | $448,056 | 710 | 4.85/5.0 |
| Emma | 7 | $438,307 | 905 | 4.91/5.0 |
| Evie | 5 | $408,001 | 567 | 4.79/5.0 |
| Short Let Space | 31 | $397,641 | 474 | 4.75/5.0 |
| Monika | 9 | $359,678 | 374 | 4.84/5.0 |
| Dominic | 2 | $318,763 | 43 | 4.95/5.0 |
| Andrei | 12 | $303,803 | 984 | 4.47/5.0 |
Analyzing the strategies of top hosts, such as their property selection, pricing, and guest communication, can offer valuable lessons for optimizing your own Airbnb operations in Oxford.
Dive Deeper: Advanced Oxford STR Market Data (2026)
Ready to unlock more insights? AirROI provides access to advanced metrics and comprehensive Airbnb data for Oxford. Explore detailed analytics beyond this report to refine your investment strategy, optimize pricing, and maximize your vacation rental profits.
Explore Advanced MetricsOxford Short-Term Rental Market Composition (2026): Property & Room Types
Room Type Distribution
Property Type Distribution
Market Composition Insights for Oxford
- The Oxford Airbnb market composition is heavily skewed towards Entire Home/Apt listings, which make up 59.3% of the 1,110 active rentals. This indicates strong guest preference for privacy and space.
- However, a notable 40.7% share for Private Rooms suggests opportunities for budget-conscious travelers or hosts renting out spare rooms.
- Looking at the property type distribution in Oxford, House properties are the most common (51.8%), reflecting the local real estate landscape.
- Houses represent a significant 51.8% portion, catering likely to families or larger groups.
- The presence of 8.8% Hotel/Boutique listings indicates integration with traditional hospitality.
- Smaller segments like others, outdoor/unique, unique stays (combined 3.1%) offer potential for unique stay experiences.
Oxford Airbnb Room Capacity Analysis (2026): Bedroom Distribution
Distribution of Listings by Number of Bedrooms
Room Capacity Insights for Oxford
- The dominant room capacity in Oxford is 1 bedroom listings, making up 30.1% of the market. This suggests a strong demand for properties suitable for couples or solo travelers.
- Together, 1 bedroom and 2 bedrooms properties represent 49.0% of the active Airbnb listings in Oxford, indicating a high concentration in these sizes.
Oxford Vacation Rental Guest Capacity Trends (2026)
Distribution of Listings by Guest Capacity
Guest Capacity Insights for Oxford
- The most common guest capacity trend in Oxford vacation rentals is listings accommodating 2 guests (20.1%). This suggests the primary traveler segment is likely couples or solo travelers.
- Properties designed for 2 guests and 4 guests dominate the Oxford STR market, accounting for 35.7% of listings.
- 18.0% of properties accommodate 6+ guests, serving the market segment for larger families or group travel in Oxford.
- On average, properties in Oxford are equipped to host 2.6 guests.
Oxford Airbnb Booking Patterns (2026): Available vs. Booked Days
Available Days Distribution
Booked Days Distribution
Booking Pattern Insights for Oxford
- The most common availability pattern in Oxford falls within the 271-366 days range, representing 35.9% of listings. This suggests many properties have significant open periods on their calendars.
- Approximately 64.1% of listings show high availability (181+ days open annually), indicating potential for increased bookings or specific owner usage patterns.
- For booked days, the 91-180 days range is most frequent in Oxford (29%), reflecting common guest stay durations or potential owner blocking patterns.
- A notable 37.1% of properties secure long booking periods (181+ days booked per year), highlighting successful long-term rental strategies or significant owner usage.
Oxford Airbnb Minimum Stay Requirements Analysis
Distribution of Listings by Minimum Night Requirement
1 Night
315 listings
28.4% of total
2 Nights
143 listings
12.9% of total
3 Nights
91 listings
8.2% of total
4-6 Nights
132 listings
11.9% of total
7-29 Nights
118 listings
10.6% of total
30+ Nights
311 listings
28% of total
Key Insights
- The most prevalent minimum stay requirement in Oxford is 1 Night, adopted by 28.4% of listings. This highlights the market's preference for shorter, flexible bookings.
- A significant segment (28%) caters to monthly stays (30+ nights) in Oxford, pointing to opportunities in the extended-stay market.
Recommendations
- Align with the market by considering a 1 Night minimum stay, as 28.4% of Oxford hosts use this setting.
- If feasible, allowing 1-night stays, especially midweek or during low season, could capture last-minute bookings, as only 28.4% currently do.
- Explore offering discounts for stays of 30+ nights to attract the 28% of the market seeking extended stays.
- Adjust minimum nights based on seasonality – potentially shorter during low season and longer during peak demand periods in Oxford.
Oxford Airbnb Cancellation Policy Trends Analysis (2026)
Limited
5 listings
0.5% of total
Super Strict 60 Days
1 listings
0.1% of total
Refundable
1 listings
0.1% of total
Super Strict 30 Days
14 listings
1.3% of total
Non-refundable
1 listings
0.1% of total
Flexible
220 listings
19.9% of total
Moderate
328 listings
29.6% of total
Firm
398 listings
35.9% of total
Strict
140 listings
12.6% of total
Cancellation Policy Insights for Oxford
- The prevailing Airbnb cancellation policy trend in Oxford is Firm, used by 35.9% of listings.
- There's a relatively balanced mix between guest-friendly (49.5%) and stricter (48.5%) policies, offering choices for different guest needs.
Recommendations for Hosts
- Consider adopting a Firm policy to align with the 35.9% market standard in Oxford.
- Using a Strict policy might deter some guests, as only 12.6% of listings use it. Evaluate if potential revenue protection outweighs possible lower booking rates.
- Regularly review your cancellation policy against competitors and market demand shifts in Oxford.
Oxford STR Booking Lead Time Analysis (2026)
Average Booking Lead Time by Month
Booking Lead Time Insights for Oxford
- The overall average booking lead time for vacation rentals in Oxford is 48 days.
- Guests book furthest in advance for stays during July (average 65 days), likely coinciding with peak travel demand or local events.
- The shortest booking windows occur for stays in February (average 30 days), indicating more last-minute travel plans during this time.
- Seasonally, Summer (58 days avg.) sees the longest lead times, while Winter (37 days avg.) has the shortest, reflecting typical travel planning cycles.
Recommendations for Hosts
- Use the overall average lead time (48 days) as a baseline for your pricing and availability strategy in Oxford.
- For July stays, consider implementing length-of-stay discounts or slightly higher rates for bookings made less than 65 days out to capitalize on advance planning.
- Target marketing efforts for the Summer season well in advance (at least 58 days) to capture early planners.
- Monitor your own booking lead times against these Oxford averages to identify opportunities for dynamic pricing adjustments.
Popular & Essential Airbnb Amenities in Oxford (2026)
Amenity Prevalence
Amenity Insights for Oxford
- Essential amenities in Oxford that guests expect include: Wifi, Smoke alarm, Heating. Lacking these (any) could significantly impact bookings.
- Popular amenities like Hot water, Hangers, Hair dryer are common but not universal. Offering these can provide a competitive edge.
Recommendations for Hosts
- Ensure your listing includes all essential amenities for Oxford: Wifi, Smoke alarm, Heating.
- Prioritize adding missing essentials: Wifi, Smoke alarm, Heating.
- Consider adding popular differentiators like Hot water or Hangers to increase appeal.
- Highlight unique or less common amenities you offer (e.g., hot tub, dedicated workspace, EV charger) in your listing description and photos.
- Regularly check competitor amenities in Oxford to stay competitive.
Oxford Airbnb Guest Demographics & Profile Analysis (2026)
Guest Profile Summary for Oxford
- The typical guest profile for Airbnb in Oxford consists of a mix of domestic (49%) and international guests, with top international origins including United States, typically belonging to the Post-2000s (Gen Z/Alpha) group (50%), primarily speaking English or French.
- Domestic travelers account for 48.8% of guests.
- Key international markets include United Kingdom (48.8%) and United States (17.4%).
- Top languages spoken are English (50.2%) followed by French (11.8%).
- A significant demographic segment is the Post-2000s (Gen Z/Alpha) group, representing 50% of guests.
Recommendations for Hosts
- Balance marketing efforts between domestic and international channels based on the guest mix.
- Tailor amenities and listing descriptions to appeal to the dominant Post-2000s (Gen Z/Alpha) demographic (e.g., highlight fast WiFi, smart home features, local guides).
- Highlight unique local experiences or amenities relevant to the primary guest profile.
- Consider seasonal promotions aligned with peak travel times for key origin markets.
Nearby Short-Term Rental Market Comparison
How does the Oxford Airbnb market stack up against its neighbors? Compare key performance metrics like average monthly revenue, ADR, and occupancy rates in surrounding areas to understand the broader regional STR landscape.
| Market | Active Properties | Monthly Revenue | Daily Rate | Avg. Occupancy |
|---|---|---|---|---|
| Dorney | 11 | $7,510 | $743.63 | 39% |
| Chew Magna | 13 | $7,041 | $430.65 | 44% |
| Englishcombe | 15 | $6,734 | $511.35 | 53% |
| Lambourn | 11 | $6,499 | $723.41 | 31% |
| East Knoyle | 10 | $6,300 | $407.06 | 44% |
| Wraysbury | 16 | $6,199 | $530.56 | 49% |
| City of Westminster | 1,424 | $6,053 | $515.72 | 50% |
| Long Sutton | 18 | $6,029 | $383.58 | 46% |
| Withington | 10 | $5,690 | $499.79 | 44% |
| Ashley | 13 | $5,497 | $364.68 | 54% |