Millbrook Airbnb Market Analysis 2026: Short Term Rental Data & Vacation Rental Statistics in England, United Kingdom
Is Airbnb profitable in Millbrook in 2026? Explore comprehensive Airbnb analytics for Millbrook, England, United Kingdom to uncover income potential. This 2026 STR market report for Millbrook, based on AirROI data from February 2025 to January 2026, reveals key trends in the niche market of 20 active listings.
Whether you're considering an Airbnb investment in Millbrook, optimizing your existing vacation rental, or exploring rental arbitrage opportunities, understanding the Millbrook Airbnb data is crucial. Leveraging the low regulation environment is key to maximizing your short term rental income potential. Let's dive into the specifics.
Key Millbrook Airbnb Performance Metrics Overview
Monthly Airbnb Revenue Variations & Income Potential in Millbrook (2026)
Understanding the monthly revenue variations for Airbnb listings in Millbrook is key to maximizing your short term rental income potential. Seasonality significantly impacts earnings. Our analysis, based on data from the past 12 months, shows that the peak revenue month for STRs in Millbrook is typically August, while February often presents the lowest earnings, highlighting opportunities for strategic pricing adjustments during shoulder and low seasons. Explore the typical Airbnb income in Millbrook across different performance tiers:
- Best-in-class properties (Top 10%) achieve $5,341+ monthly, often utilizing dynamic pricing and superior guest experiences.
- Strong performing properties (Top 25%) earn $3,102 or more, indicating effective management and desirable locations/amenities.
- Typical properties (Median) generate around $1,648 per month, representing the average market performance.
- Entry-level properties (Bottom 25%) see earnings around $828, often with potential for optimization.
Average Monthly Airbnb Earnings Trend in Millbrook
Millbrook Airbnb Occupancy Rate Trends (2026)
Maximize your bookings by understanding the Millbrook STR occupancy trends. Seasonal demand shifts significantly influence how often properties are booked. Typically, Augustsees the highest demand (peak season occupancy), while January experiences the lowest (low season). Effective strategies, like adjusting minimum stays or offering promotions, can boost occupancy during slower periods. Here's how different property tiers perform in Millbrook:
- Best-in-class properties (Top 10%) achieve 68%+ occupancy, indicating high desirability and potentially optimized availability.
- Strong performing properties (Top 25%) maintain 51% or higher occupancy, suggesting good market fit and guest satisfaction.
- Typical properties (Median) have an occupancy rate around 38%.
- Entry-level properties (Bottom 25%) average 25% occupancy, potentially facing higher vacancy.
Average Monthly Occupancy Rate Trend in Millbrook
Average Daily Rate (ADR) Airbnb Trends in Millbrook (2026)
Effective short term rental pricing strategy in Millbrook involves understanding monthly ADR fluctuations. The Average Daily Rate (ADR) for Airbnb in Millbrook typically peaks in December and dips lowest during March. Leveraging Airbnb dynamic pricing tools or strategies based on this seasonality can significantly boost revenue. Here's a look at the typical nightly rates achieved:
- Best-in-class properties (Top 10%) command rates of $427+ per night, often due to premium features or locations.
- Strong performing properties (Top 25%) achieve nightly rates of $248 or more.
- Typical properties (Median) charge around $141 per night.
- Entry-level properties (Bottom 25%) earn around $98 per night.
Average Daily Rate (ADR) Trend by Month in Millbrook
Get Live Millbrook Market Intelligence 👇
Explore Real-time Analytics
Airbnb Seasonality Analysis & Trends in Millbrook (2026)
Peak Season (August, July, September)
- Revenue averages $4,247 per month
- Occupancy rates average 55.0%
- Daily rates average $240
Shoulder Season
- Revenue averages $2,330 per month
- Occupancy maintains around 40.3%
- Daily rates hold near $230
Low Season (January, February, March)
- Revenue drops to average $994 per month
- Occupancy decreases to average 22.0%
- Daily rates adjust to average $216
Seasonality Insights for Millbrook
- The Airbnb seasonality in Millbrook shows highly seasonal trends requiring careful strategy. While the sections above show seasonal averages, it's also insightful to look at the extremes:
- During the high season, the absolute peak month showcases Millbrook's highest earning potential, with monthly revenues capable of climbing to $5,277, occupancy reaching a high of 67.7%, and ADRs peaking at $255.
- Conversely, the slowest single month of the year, typically falling within the low season, marks the market's lowest point. In this month, revenue might dip to $604, occupancy could drop to 14.6%, and ADRs may adjust down to $197.
- Understanding both the seasonal averages and these monthly peaks and troughs in revenue, occupancy, and ADR is crucial for maximizing your Airbnb profit potential in Millbrook.
Seasonal Strategies for Maximizing Profit
- Peak Season: Maximize revenue through premium pricing and potentially longer minimum stays. Ensure high availability.
- Low Season: Offer competitive pricing, special promotions (e.g., extended stay discounts), and flexible cancellation policies. Target off-season travelers like remote workers or budget-conscious guests.
- Shoulder Seasons: Implement dynamic pricing that balances peak and low rates. Target weekend travelers or specific events. Offer slightly more flexible terms than peak season.
- Regularly analyze your own performance against these Millbrook seasonality benchmarks and adjust your pricing and availability strategy accordingly.
Best Areas for Airbnb Investment in Millbrook (2026)
Exploring the top neighborhoods for short-term rentals in Millbrook? This section highlights key areas, outlining why they are attractive for hosts and guests, along with notable local attractions. Consider these locations based on your target guest profile and investment strategy.
| Neighborhood / Area | Why Host Here? (Target Guests & Appeal) | Key Attractions & Landmarks |
|---|---|---|
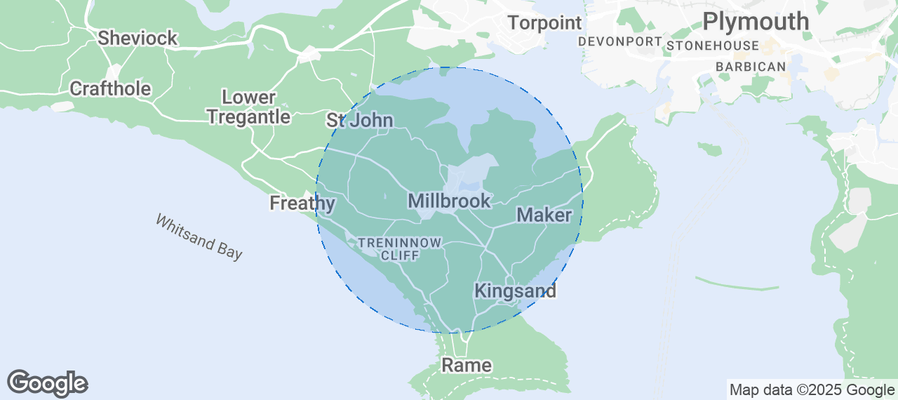
| Millbrook | A picturesque village located in the South East of England, offering a tranquil atmosphere and proximity to scenic countryside and nature attractions. Great for visitors seeking a peaceful getaway away from the hustle of city life. | Millbrook Beach, Millbrook Village Hall, The Millbrook Garden Centre, Hedge End Country Park, Nearby New Forest National Park |
| Calshot | Calshot is a beautiful coastal area known for its impressive beaches and water sports activities. Perfect for families and adventure seekers looking for fun activities such as sailing, windsurfing, and kitesurfing. | Calshot Beach, Calshot Activity Centre, Calshot Castle, Stoke Park, New Forest National Park |
| Hythe | A charming town located on the southern coast with scenic views of the Solent. It's popular for its ferry service to Southampton and offers a quaint seaside experience. | Hythe Pier, Hythe Village, New Forest Marina, Hythe Swimming Pool, St John's Church |
| Beaulieu | Famous for the Beaulieu Palace and the National Motor Museum, Beaulieu attracts visitors who are interested in history, cars, and beautiful landscapes. An excellent spot for culture lovers. | Beaulieu Abbey, Beaulieu National Motor Museum, Buckler's Hard, Beaulieu River, New Forest National Park |
| Netley Abbey | A serene place known for the historical Netley Abbey ruins and beautiful surrounding parks. Attracts visitors interested in history while enjoying nature. | Netley Abbey Ruins, Royal Victoria Country Park, Netley Marsh, Hound Beach |
| Totton | An ideal stop for those exploring the New Forest and its surrounding areas. It offers local amenities and is close to nature trails, making it attractive to outdoor enthusiasts. | Totton Town Centre, Testwood Lakes, The New Forest Heritage Centre, Hollybank Woods |
| Lymington | A picturesque coastal town known for its marinas and boating activities. It's a lovely destination for those wanting to explore the coast and enjoy fresh seafood cuisine. | Lymington Marina, Lymington Sea Water Baths, St. Barbe Museum, Keyhaven Marshes, Nearby New Forest |
| Southampton | A vibrant city with a rich maritime history, offering various entertainment options and cultural experiences. Strong demand from tourists and business travelers. | SeaCity Museum, Southampton City Art Gallery, Mayflower Park, Westquay Shopping Centre, The Titanic Story Museum |
Understanding Airbnb License Requirements & STR Laws in Millbrook (2026)
While Millbrook, England, United Kingdom currently shows low STR regulations, specific Airbnb license requirements might still exist or change. Always verify the latest short term rental regulations and Airbnb license requirements directly with local government authorities for Millbrook to ensure full compliance before hosting.
(Source: AirROI data, 2026, finding no licensed listings among those analyzed)
Top Performing Airbnb Properties in Millbrook (2026)
Benchmark your potential! Explore examples of top-performing Airbnb properties in Millbrookbased on Trailing Twelve Month (TTM) revenue. Analyze their characteristics, revenue, occupancy rate, and ADR to understand what drives success in this market.

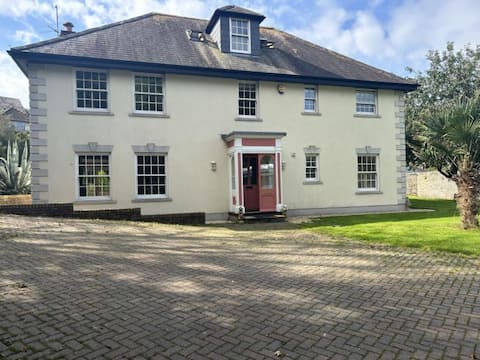
4 Bed in Millbrook (58602)
Entire Place • 4 bedrooms
Finest Retreats | Nicely Tucked Away Cottage
Entire Place • 2 bedrooms
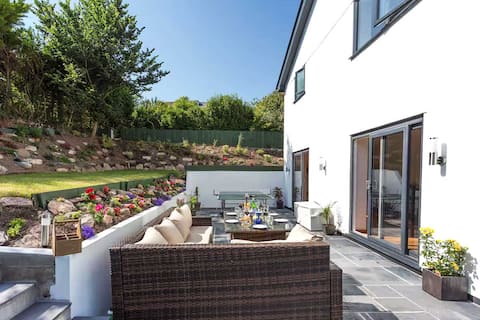
Luxury holiday home, Rame Peninsula
Entire Place • 4 bedrooms

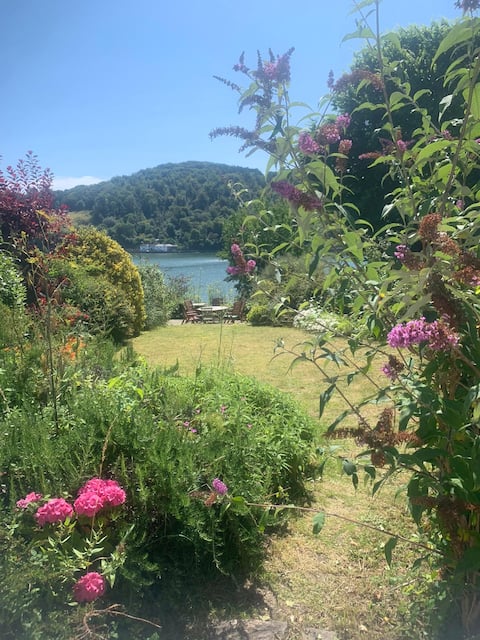
Luxurious home secluded location with rural views
Entire Place • 2 bedrooms

Wood Park Stables, Millbrook, Cornwall. Waterside
Entire Place • 1 bedroom
Seawinds terraced cottage
Entire Place • 3 bedrooms
Note: Performance varies based on location, size, amenities, seasonality, and management quality. Data reflects the past 12 months.
Top Performing Airbnb Hosts in Millbrook (2026)
Learn from the best! This table showcases top-performing Airbnb hosts in Millbrook based on the number of properties managed and estimated total revenue over the past year. Analyze their scale and performance metrics.
| Host Name | Properties | Grossing Revenue | Stay Reviews | Avg Rating |
|---|---|---|---|---|
| Holidaycottages.Co.Uk | 1 | $95,882 | 1 | Not Rated |
| Finest Retreats | 1 | $71,171 | 16 | 5.00/5.0 |
| James | 1 | $47,162 | 106 | 4.99/5.0 |
| Leisha | 1 | $32,613 | 124 | 4.99/5.0 |
| Bee | 1 | $32,210 | 168 | 4.98/5.0 |
| Ian | 2 | $29,512 | 62 | 4.97/5.0 |
| Rebecca | 1 | $28,795 | 10 | 5.00/5.0 |
| Sarah | 1 | $28,323 | 93 | 4.97/5.0 |
| Sykes | 1 | $25,802 | 7 | 4.71/5.0 |
| Jen | 1 | $23,761 | 132 | 4.98/5.0 |
Analyzing the strategies of top hosts, such as their property selection, pricing, and guest communication, can offer valuable lessons for optimizing your own Airbnb operations in Millbrook.
Dive Deeper: Advanced Millbrook STR Market Data (2026)
Ready to unlock more insights? AirROI provides access to advanced metrics and comprehensive Airbnb data for Millbrook. Explore detailed analytics beyond this report to refine your investment strategy, optimize pricing, and maximize your vacation rental profits.
Explore Advanced MetricsMillbrook Short-Term Rental Market Composition (2026): Property & Room Types
Room Type Distribution
Property Type Distribution
Market Composition Insights for Millbrook
- The Millbrook Airbnb market composition is heavily skewed towards Entire Home/Apt listings, which make up 75% of the 20 active rentals. This indicates strong guest preference for privacy and space.
- Looking at the property type distribution in Millbrook, House properties are the most common (75%), reflecting the local real estate landscape.
- Houses represent a significant 75% portion, catering likely to families or larger groups.
Millbrook Airbnb Room Capacity Analysis (2026): Bedroom Distribution
Distribution of Listings by Number of Bedrooms
Room Capacity Insights for Millbrook
- The dominant room capacity in Millbrook is 1 bedroom listings, making up 30% of the market. This suggests a strong demand for properties suitable for couples or solo travelers.
- Together, 1 bedroom and 2 bedrooms properties represent 50.0% of the active Airbnb listings in Millbrook, indicating a high concentration in these sizes.
- A significant 30.0% of listings offer 3+ bedrooms, catering to larger groups and families seeking more space in Millbrook.
Millbrook Vacation Rental Guest Capacity Trends (2026)
Distribution of Listings by Guest Capacity
Guest Capacity Insights for Millbrook
- The most common guest capacity trend in Millbrook vacation rentals is listings accommodating 2 guests (20%). This suggests the primary traveler segment is likely couples or solo travelers.
- Properties designed for 2 guests and 4 guests dominate the Millbrook STR market, accounting for 40.0% of listings.
- 30.0% of properties accommodate 6+ guests, serving the market segment for larger families or group travel in Millbrook.
- On average, properties in Millbrook are equipped to host 3.6 guests.
Millbrook Airbnb Booking Patterns (2026): Available vs. Booked Days
Available Days Distribution
Booked Days Distribution
Booking Pattern Insights for Millbrook
- The most common availability pattern in Millbrook falls within the 181-270 days range, representing 65% of listings. This suggests many properties have significant open periods on their calendars.
- Approximately 90.0% of listings show high availability (181+ days open annually), indicating potential for increased bookings or specific owner usage patterns.
- For booked days, the 91-180 days range is most frequent in Millbrook (65%), reflecting common guest stay durations or potential owner blocking patterns.
- A notable 10.0% of properties secure long booking periods (181+ days booked per year), highlighting successful long-term rental strategies or significant owner usage.
Millbrook Airbnb Minimum Stay Requirements Analysis
Distribution of Listings by Minimum Night Requirement
1 Night
4 listings
20% of total
2 Nights
3 listings
15% of total
3 Nights
5 listings
25% of total
30+ Nights
8 listings
40% of total
Key Insights
- The most prevalent minimum stay requirement in Millbrook is 30+ Nights, adopted by 40% of listings. This highlights the market's preference for longer commitments.
- A significant segment (40%) caters to monthly stays (30+ nights) in Millbrook, pointing to opportunities in the extended-stay market.
Recommendations
- Align with the market by considering a 30+ Nights minimum stay, as 40% of Millbrook hosts use this setting.
- If feasible, allowing 1-night stays, especially midweek or during low season, could capture last-minute bookings, as only 20% currently do.
- Explore offering discounts for stays of 30+ nights to attract the 40% of the market seeking extended stays.
- Adjust minimum nights based on seasonality – potentially shorter during low season and longer during peak demand periods in Millbrook.
Millbrook Airbnb Cancellation Policy Trends Analysis (2026)
Super Strict 60 Days
2 listings
10% of total
Flexible
3 listings
15% of total
Moderate
3 listings
15% of total
Firm
9 listings
45% of total
Strict
3 listings
15% of total
Cancellation Policy Insights for Millbrook
- The prevailing Airbnb cancellation policy trend in Millbrook is Firm, used by 45% of listings.
- A majority (60.0%) of hosts in Millbrook utilize Firm or Strict policies, indicating a market where hosts prioritize booking security.
Recommendations for Hosts
- Consider adopting a Firm policy to align with the 45% market standard in Millbrook.
- Regularly review your cancellation policy against competitors and market demand shifts in Millbrook.
Millbrook STR Booking Lead Time Analysis (2026)
Average Booking Lead Time by Month
Booking Lead Time Insights for Millbrook
- The overall average booking lead time for vacation rentals in Millbrook is 73 days.
- Guests book furthest in advance for stays during March (average 97 days), likely coinciding with peak travel demand or local events.
- The shortest booking windows occur for stays in November (average 47 days), indicating more last-minute travel plans during this time.
- Seasonally, Spring (83 days avg.) sees the longest lead times, while Fall (64 days avg.) has the shortest, reflecting typical travel planning cycles.
Recommendations for Hosts
- Use the overall average lead time (73 days) as a baseline for your pricing and availability strategy in Millbrook.
- For March stays, consider implementing length-of-stay discounts or slightly higher rates for bookings made less than 97 days out to capitalize on advance planning.
- Target marketing efforts for the Spring season well in advance (at least 83 days) to capture early planners.
- Monitor your own booking lead times against these Millbrook averages to identify opportunities for dynamic pricing adjustments.
Popular & Essential Airbnb Amenities in Millbrook (2026)
Amenity Prevalence
Amenity Insights for Millbrook
- Essential amenities in Millbrook that guests expect include: Hot water, Wifi, Heating, Smoke alarm, Bed linens. Lacking these (any) could significantly impact bookings.
- Popular amenities like TV, Kitchen, Essentials are common but not universal. Offering these can provide a competitive edge.
Recommendations for Hosts
- Ensure your listing includes all essential amenities for Millbrook: Hot water, Wifi, Heating, Smoke alarm, Bed linens.
- Prioritize adding missing essentials: Bed linens.
- Consider adding popular differentiators like TV or Kitchen to increase appeal.
- Highlight unique or less common amenities you offer (e.g., hot tub, dedicated workspace, EV charger) in your listing description and photos.
- Regularly check competitor amenities in Millbrook to stay competitive.
Millbrook Airbnb Guest Demographics & Profile Analysis (2026)
Guest Profile Summary for Millbrook
- The typical guest profile for Airbnb in Millbrook consists of primarily domestic travelers (92%), often arriving from nearby England, typically belonging to the Post-2000s (Gen Z/Alpha) group (50%), primarily speaking English or French.
- Domestic travelers account for 91.8% of guests.
- Key international markets include United Kingdom (91.8%) and Ireland (1.4%).
- Top languages spoken are English (73.2%) followed by French (10.7%).
- A significant demographic segment is the Post-2000s (Gen Z/Alpha) group, representing 50% of guests.
Recommendations for Hosts
- Target domestic marketing efforts towards travelers from England and London.
- Tailor amenities and listing descriptions to appeal to the dominant Post-2000s (Gen Z/Alpha) demographic (e.g., highlight fast WiFi, smart home features, local guides).
- Highlight unique local experiences or amenities relevant to the primary guest profile.
- Consider seasonal promotions aligned with peak travel times for key origin markets.
Nearby Short-Term Rental Market Comparison
How does the Millbrook Airbnb market stack up against its neighbors? Compare key performance metrics like average monthly revenue, ADR, and occupancy rates in surrounding areas to understand the broader regional STR landscape.
| Market | Active Properties | Monthly Revenue | Daily Rate | Avg. Occupancy |
|---|---|---|---|---|
| Angle | 13 | $6,069 | $626.63 | 50% |
| Milverton | 10 | $5,067 | $377.17 | 48% |
| Southerndown | 16 | $5,064 | $409.45 | 46% |
| Southgate | 13 | $4,781 | $282.69 | 56% |
| Bridgwater | 18 | $4,662 | $355.91 | 53% |
| Crai | 31 | $4,496 | $552.02 | 38% |
| New Polzeath | 17 | $4,089 | $281.24 | 54% |
| Llantrisant | 15 | $4,086 | $275.56 | 44% |
| Trenance | 25 | $4,037 | $513.80 | 39% |
| Rhossili | 30 | $4,019 | $313.39 | 50% |