Maidenhead Airbnb Market Analysis 2026: Short Term Rental Data & Vacation Rental Statistics in England, United Kingdom
Is Airbnb profitable in Maidenhead in 2026? Explore comprehensive Airbnb analytics for Maidenhead, England, United Kingdom to uncover income potential. This 2026 STR market report for Maidenhead, based on AirROI data from February 2025 to January 2026, reveals key trends in the niche market of 95 active listings.
Whether you're considering an Airbnb investment in Maidenhead, optimizing your existing vacation rental, or exploring rental arbitrage opportunities, understanding the Maidenhead Airbnb data is crucial. Leveraging the low regulation environment is key to maximizing your short term rental income potential. Let's dive into the specifics.
Key Maidenhead Airbnb Performance Metrics Overview
Monthly Airbnb Revenue Variations & Income Potential in Maidenhead (2026)
Understanding the monthly revenue variations for Airbnb listings in Maidenhead is key to maximizing your short term rental income potential. Seasonality significantly impacts earnings. Our analysis, based on data from the past 12 months, shows that the peak revenue month for STRs in Maidenhead is typically June, while January often presents the lowest earnings, highlighting opportunities for strategic pricing adjustments during shoulder and low seasons. Explore the typical Airbnb income in Maidenhead across different performance tiers:
- Best-in-class properties (Top 10%) achieve $5,017+ monthly, often utilizing dynamic pricing and superior guest experiences.
- Strong performing properties (Top 25%) earn $2,844 or more, indicating effective management and desirable locations/amenities.
- Typical properties (Median) generate around $1,470 per month, representing the average market performance.
- Entry-level properties (Bottom 25%) see earnings around $647, often with potential for optimization.
Average Monthly Airbnb Earnings Trend in Maidenhead
Maidenhead Airbnb Occupancy Rate Trends (2026)
Maximize your bookings by understanding the Maidenhead STR occupancy trends. Seasonal demand shifts significantly influence how often properties are booked. Typically, Junesees the highest demand (peak season occupancy), while January experiences the lowest (low season). Effective strategies, like adjusting minimum stays or offering promotions, can boost occupancy during slower periods. Here's how different property tiers perform in Maidenhead:
- Best-in-class properties (Top 10%) achieve 81%+ occupancy, indicating high desirability and potentially optimized availability.
- Strong performing properties (Top 25%) maintain 65% or higher occupancy, suggesting good market fit and guest satisfaction.
- Typical properties (Median) have an occupancy rate around 40%.
- Entry-level properties (Bottom 25%) average 20% occupancy, potentially facing higher vacancy.
Average Monthly Occupancy Rate Trend in Maidenhead
Average Daily Rate (ADR) Airbnb Trends in Maidenhead (2026)
Effective short term rental pricing strategy in Maidenhead involves understanding monthly ADR fluctuations. The Average Daily Rate (ADR) for Airbnb in Maidenhead typically peaks in June and dips lowest during January. Leveraging Airbnb dynamic pricing tools or strategies based on this seasonality can significantly boost revenue. Here's a look at the typical nightly rates achieved:
- Best-in-class properties (Top 10%) command rates of $302+ per night, often due to premium features or locations.
- Strong performing properties (Top 25%) achieve nightly rates of $205 or more.
- Typical properties (Median) charge around $133 per night.
- Entry-level properties (Bottom 25%) earn around $75 per night.
Average Daily Rate (ADR) Trend by Month in Maidenhead
Get Live Maidenhead Market Intelligence 👇

Explore Real-time Analytics
Airbnb Seasonality Analysis & Trends in Maidenhead (2026)
Peak Season (June, September, July)
- Revenue averages $2,556 per month
- Occupancy rates average 48.7%
- Daily rates average $184
Shoulder Season
- Revenue averages $2,311 per month
- Occupancy maintains around 44.2%
- Daily rates hold near $179
Low Season (January, February, November)
- Revenue drops to average $1,570 per month
- Occupancy decreases to average 36.2%
- Daily rates adjust to average $169
Seasonality Insights for Maidenhead
- The Airbnb seasonality in Maidenhead shows moderate seasonality with distinct peak and low periods. While the sections above show seasonal averages, it's also insightful to look at the extremes:
- During the high season, the absolute peak month showcases Maidenhead's highest earning potential, with monthly revenues capable of climbing to $2,612, occupancy reaching a high of 50.9%, and ADRs peaking at $188.
- Conversely, the slowest single month of the year, typically falling within the low season, marks the market's lowest point. In this month, revenue might dip to $1,221, occupancy could drop to 27.5%, and ADRs may adjust down to $165.
- Understanding both the seasonal averages and these monthly peaks and troughs in revenue, occupancy, and ADR is crucial for maximizing your Airbnb profit potential in Maidenhead.
Seasonal Strategies for Maximizing Profit
- Peak Season: Maximize revenue through premium pricing and potentially longer minimum stays. Ensure high availability.
- Low Season: Offer competitive pricing, special promotions (e.g., extended stay discounts), and flexible cancellation policies. Target off-season travelers like remote workers or budget-conscious guests.
- Shoulder Seasons: Implement dynamic pricing that balances peak and low rates. Target weekend travelers or specific events. Offer slightly more flexible terms than peak season.
- Regularly analyze your own performance against these Maidenhead seasonality benchmarks and adjust your pricing and availability strategy accordingly.
Best Areas for Airbnb Investment in Maidenhead (2026)
Exploring the top neighborhoods for short-term rentals in Maidenhead? This section highlights key areas, outlining why they are attractive for hosts and guests, along with notable local attractions. Consider these locations based on your target guest profile and investment strategy.
| Neighborhood / Area | Why Host Here? (Target Guests & Appeal) | Key Attractions & Landmarks |
|---|---|---|
| Maidenhead Town Centre | The heart of Maidenhead, it offers a variety of shops, restaurants, and nightlife. It's conveniently located near the train station, making it ideal for commuters and travelers alike. | Maidenhead Railway Station, Nicholsons Shopping Centre, Boulters Lock, Kidwells Park, The Old Court |
| Cookham | A picturesque village on the River Thames known for its charming scenery and artistic heritage. Great for guests looking for a tranquil and scenic retreat close to nature. | River Thames, The Stanley Spencer Gallery, Cookham Village, National Trust - Cookham, Boulters Lock |
| Taplow | A suburban area with easy access to Maidenhead and its own train station. Known for its green spaces and Taplow Court, making it attractive for families and outdoor enthusiasts. | Taplow Court, Cliveden House, Taplow Riverside, Burnham Beeches, Riverside Gardens |
| Bray | A small village with renowned restaurants like the Fat Duck, Bray is perfect for foodies and those seeking an upscale culinary experience on the Thames. | The Fat Duck, The Waterside Inn, Bray Village, Bray Marina, Bray Film Studios |
| Bourne End | A riverside village ideal for visitors looking for a quaint getaway. Its proximity to the Thames makes it a great spot for outdoor activities. | Bourne End Marina, River Thames, The Flower Pot pub, Bourne End Railway Station, High Street shops |
| Windsor | Nearby Windsor is great for tourists visiting Windsor Castle and Legoland. Very popular with travelers for its historical significance. | Windsor Castle, Legoland Windsor, The Long Walk, Windsor Great Park, Windsor Royal Shopping |
| DATCHET | An attractive village on the banks of the Thames, perfect for visitors who enjoy quaint surroundings and easy access to both Windsor and central Maidenhead. | Datchet Village, Thames Path, Datchet Common, The Queen's Head pub, Historic buildings |
| Holyport | A charming village just outside Maidenhead, known for its historic buildings and rural scenery. Perfect for guests looking for peace away from the hustle of city life. | Holyport Green, Holyport Village Hall, Local pubs, Shurlock Row, Surrounding countryside |
Understanding Airbnb License Requirements & STR Laws in Maidenhead (2026)
While Maidenhead, England, United Kingdom currently shows low STR regulations, specific Airbnb license requirements might still exist or change. Always verify the latest short term rental regulations and Airbnb license requirements directly with local government authorities for Maidenhead to ensure full compliance before hosting.
(Source: AirROI data, 2026, based on 1% licensed listings)
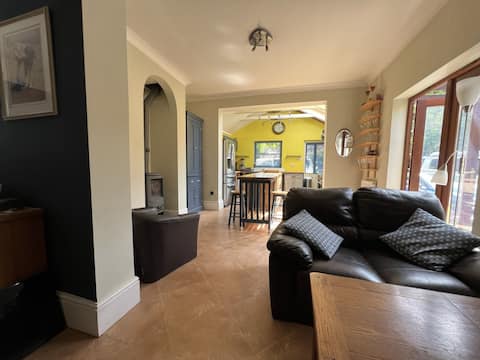
Top Performing Airbnb Properties in Maidenhead (2026)
Benchmark your potential! Explore examples of top-performing Airbnb properties in Maidenheadbased on Trailing Twelve Month (TTM) revenue. Analyze their characteristics, revenue, occupancy rate, and ADR to understand what drives success in this market.
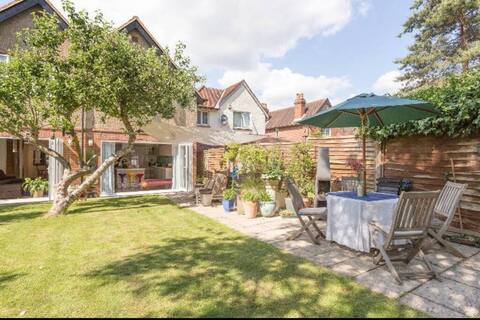
Bright & Spacious Home 10 min from Elizabeth line
Entire Place • 6 bedrooms

Families & Friends I Parking+EV - Station 10 mins
Entire Place • 3 bedrooms
A great base for London work+tourism and Heathrow
Entire Place • 4 bedrooms

6-7 Bedroom, 260sqm, 4 x parking + street
Entire Place • 7 bedrooms

4Bedroom 6Bed 3Bath | PoolTable / PS4 | Parking
Entire Place • 4 bedrooms

Artists Victorian Semi
Entire Place • 2 bedrooms
Note: Performance varies based on location, size, amenities, seasonality, and management quality. Data reflects the past 12 months.
Top Performing Airbnb Hosts in Maidenhead (2026)
Learn from the best! This table showcases top-performing Airbnb hosts in Maidenhead based on the number of properties managed and estimated total revenue over the past year. Analyze their scale and performance metrics.
| Host Name | Properties | Grossing Revenue | Stay Reviews | Avg Rating |
|---|---|---|---|---|
| Van | 3 | $127,769 | 126 | 4.83/5.0 |
| Wendy | 9 | $117,791 | 338 | 4.74/5.0 |
| 360stays | 9 | $110,583 | 27 | 4.55/5.0 |
| Eve | 1 | $102,456 | 175 | 4.77/5.0 |
| Ruth | 1 | $86,177 | 58 | 5.00/5.0 |
| Jeremy | 1 | $84,231 | 28 | 5.00/5.0 |
| Maeve Kingshomeaccommodation.C | 1 | $73,806 | 52 | 4.67/5.0 |
| Frank | 2 | $60,475 | 257 | 4.97/5.0 |
| Angie | 4 | $56,556 | 35 | 4.63/5.0 |
| Louise | 1 | $47,632 | 74 | 5.00/5.0 |
Analyzing the strategies of top hosts, such as their property selection, pricing, and guest communication, can offer valuable lessons for optimizing your own Airbnb operations in Maidenhead.
Dive Deeper: Advanced Maidenhead STR Market Data (2026)
Ready to unlock more insights? AirROI provides access to advanced metrics and comprehensive Airbnb data for Maidenhead. Explore detailed analytics beyond this report to refine your investment strategy, optimize pricing, and maximize your vacation rental profits.
Explore Advanced MetricsMaidenhead Short-Term Rental Market Composition (2026): Property & Room Types
Room Type Distribution
Property Type Distribution
Market Composition Insights for Maidenhead
- The Maidenhead Airbnb market composition is heavily skewed towards Entire Home/Apt listings, which make up 65.3% of the 95 active rentals. This indicates strong guest preference for privacy and space.
- However, a notable 34.7% share for Private Rooms suggests opportunities for budget-conscious travelers or hosts renting out spare rooms.
- Looking at the property type distribution in Maidenhead, Apartment/Condo properties are the most common (44.2%), reflecting the local real estate landscape.
- Houses represent a significant 44.2% portion, catering likely to families or larger groups.
- The presence of 10.5% Hotel/Boutique listings indicates integration with traditional hospitality.
- Smaller segments like others (combined 1.1%) offer potential for unique stay experiences.
Maidenhead Airbnb Room Capacity Analysis (2026): Bedroom Distribution
Distribution of Listings by Number of Bedrooms
Room Capacity Insights for Maidenhead
- The dominant room capacity in Maidenhead is 1 bedroom listings, making up 31.6% of the market. This suggests a strong demand for properties suitable for couples or solo travelers.
- Together, 1 bedroom and 2 bedrooms properties represent 53.7% of the active Airbnb listings in Maidenhead, indicating a high concentration in these sizes.
Maidenhead Vacation Rental Guest Capacity Trends (2026)
Distribution of Listings by Guest Capacity
Guest Capacity Insights for Maidenhead
- The most common guest capacity trend in Maidenhead vacation rentals is listings accommodating 4 guests (24.2%). This suggests the primary traveler segment is likely small families or groups.
- Properties designed for 4 guests and 2 guests dominate the Maidenhead STR market, accounting for 43.1% of listings.
- 21.1% of properties accommodate 6+ guests, serving the market segment for larger families or group travel in Maidenhead.
- On average, properties in Maidenhead are equipped to host 3.1 guests.
Maidenhead Airbnb Booking Patterns (2026): Available vs. Booked Days
Available Days Distribution
Booked Days Distribution
Booking Pattern Insights for Maidenhead
- The most common availability pattern in Maidenhead falls within the 271-366 days range, representing 50.5% of listings. This suggests many properties have significant open periods on their calendars.
- Approximately 83.1% of listings show high availability (181+ days open annually), indicating potential for increased bookings or specific owner usage patterns.
- For booked days, the 91-180 days range is most frequent in Maidenhead (32.6%), reflecting common guest stay durations or potential owner blocking patterns.
- A notable 17.9% of properties secure long booking periods (181+ days booked per year), highlighting successful long-term rental strategies or significant owner usage.
Maidenhead Airbnb Minimum Stay Requirements Analysis
Distribution of Listings by Minimum Night Requirement
1 Night
29 listings
30.5% of total
2 Nights
15 listings
15.8% of total
3 Nights
10 listings
10.5% of total
4-6 Nights
11 listings
11.6% of total
7-29 Nights
11 listings
11.6% of total
30+ Nights
19 listings
20% of total
Key Insights
- The most prevalent minimum stay requirement in Maidenhead is 1 Night, adopted by 30.5% of listings. This highlights the market's preference for shorter, flexible bookings.
- A significant segment (20%) caters to monthly stays (30+ nights) in Maidenhead, pointing to opportunities in the extended-stay market.
Recommendations
- Align with the market by considering a 1 Night minimum stay, as 30.5% of Maidenhead hosts use this setting.
- Explore offering discounts for stays of 30+ nights to attract the 20% of the market seeking extended stays.
- Adjust minimum nights based on seasonality – potentially shorter during low season and longer during peak demand periods in Maidenhead.
Maidenhead Airbnb Cancellation Policy Trends Analysis (2026)
Super Strict 60 Days
1 listings
1.1% of total
Refundable
1 listings
1.1% of total
Flexible
24 listings
25.5% of total
Moderate
33 listings
35.1% of total
Firm
24 listings
25.5% of total
Strict
11 listings
11.7% of total
Cancellation Policy Insights for Maidenhead
- The prevailing Airbnb cancellation policy trend in Maidenhead is Moderate, used by 35.1% of listings.
- There's a relatively balanced mix between guest-friendly (60.6%) and stricter (37.2%) policies, offering choices for different guest needs.
Recommendations for Hosts
- Consider adopting a Moderate policy to align with the 35.1% market standard in Maidenhead.
- Using a Strict policy might deter some guests, as only 11.7% of listings use it. Evaluate if potential revenue protection outweighs possible lower booking rates.
- Regularly review your cancellation policy against competitors and market demand shifts in Maidenhead.
Maidenhead STR Booking Lead Time Analysis (2026)
Average Booking Lead Time by Month
Booking Lead Time Insights for Maidenhead
- The overall average booking lead time for vacation rentals in Maidenhead is 36 days.
- Guests book furthest in advance for stays during June (average 54 days), likely coinciding with peak travel demand or local events.
- The shortest booking windows occur for stays in February (average 21 days), indicating more last-minute travel plans during this time.
- Seasonally, Summer (53 days avg.) sees the longest lead times, while Winter (33 days avg.) has the shortest, reflecting typical travel planning cycles.
Recommendations for Hosts
- Use the overall average lead time (36 days) as a baseline for your pricing and availability strategy in Maidenhead.
- For June stays, consider implementing length-of-stay discounts or slightly higher rates for bookings made less than 54 days out to capitalize on advance planning.
- Target marketing efforts for the Summer season well in advance (at least 53 days) to capture early planners.
- Monitor your own booking lead times against these Maidenhead averages to identify opportunities for dynamic pricing adjustments.
Popular & Essential Airbnb Amenities in Maidenhead (2026)
Amenity Prevalence
Amenity Insights for Maidenhead
- Essential amenities in Maidenhead that guests expect include: Wifi, Smoke alarm. Lacking these (any) could significantly impact bookings.
- Popular amenities like Heating, Kitchen, Hot water are common but not universal. Offering these can provide a competitive edge.
Recommendations for Hosts
- Ensure your listing includes all essential amenities for Maidenhead: Wifi, Smoke alarm.
- Prioritize adding missing essentials: Smoke alarm.
- Consider adding popular differentiators like Heating or Kitchen to increase appeal.
- Highlight unique or less common amenities you offer (e.g., hot tub, dedicated workspace, EV charger) in your listing description and photos.
- Regularly check competitor amenities in Maidenhead to stay competitive.
Maidenhead Airbnb Guest Demographics & Profile Analysis (2026)
Guest Profile Summary for Maidenhead
- The typical guest profile for Airbnb in Maidenhead consists of primarily domestic travelers (75%), often arriving from nearby England, typically belonging to the Post-2000s (Gen Z/Alpha) group (50%), primarily speaking English or French.
- Domestic travelers account for 75.1% of guests.
- Key international markets include United Kingdom (75.1%) and United States (5.7%).
- Top languages spoken are English (61.4%) followed by French (9.2%).
- A significant demographic segment is the Post-2000s (Gen Z/Alpha) group, representing 50% of guests.
Recommendations for Hosts
- Target domestic marketing efforts towards travelers from England and London.
- Tailor amenities and listing descriptions to appeal to the dominant Post-2000s (Gen Z/Alpha) demographic (e.g., highlight fast WiFi, smart home features, local guides).
- Highlight unique local experiences or amenities relevant to the primary guest profile.
- Consider seasonal promotions aligned with peak travel times for key origin markets.
Nearby Short-Term Rental Market Comparison
How does the Maidenhead Airbnb market stack up against its neighbors? Compare key performance metrics like average monthly revenue, ADR, and occupancy rates in surrounding areas to understand the broader regional STR landscape.
| Market | Active Properties | Monthly Revenue | Daily Rate | Avg. Occupancy |
|---|---|---|---|---|
| Dorney | 11 | $7,510 | $743.63 | 39% |
| Lambourn | 11 | $6,499 | $723.41 | 31% |
| Wraysbury | 16 | $6,199 | $530.56 | 49% |
| City of Westminster | 1,424 | $6,053 | $515.72 | 50% |
| Dinton | 11 | $4,871 | $292.60 | 52% |
| Furzehill | 10 | $4,680 | $287.32 | 49% |
| Shrewton | 15 | $4,402 | $465.24 | 44% |
| Alderbury | 21 | $4,337 | $357.78 | 47% |
| Old Windsor | 20 | $4,177 | $286.69 | 49% |
| Cookham | 20 | $4,138 | $347.79 | 47% |