Little Petherick Airbnb Market Analysis 2026: Short Term Rental Data & Vacation Rental Statistics in England, United Kingdom
Is Airbnb profitable in Little Petherick in 2026? Explore comprehensive Airbnb analytics for Little Petherick, England, United Kingdom to uncover income potential. This 2026 STR market report for Little Petherick, based on AirROI data from February 2025 to January 2026, reveals key trends in the niche market of 32 active listings.
Whether you're considering an Airbnb investment in Little Petherick, optimizing your existing vacation rental, or exploring rental arbitrage opportunities, understanding the Little Petherick Airbnb data is crucial. Leveraging the low regulation environment is key to maximizing your short term rental income potential. Let's dive into the specifics.
Key Little Petherick Airbnb Performance Metrics Overview
Monthly Airbnb Revenue Variations & Income Potential in Little Petherick (2026)
Understanding the monthly revenue variations for Airbnb listings in Little Petherick is key to maximizing your short term rental income potential. Seasonality significantly impacts earnings. Our analysis, based on data from the past 12 months, shows that the peak revenue month for STRs in Little Petherick is typically July, while October often presents the lowest earnings, highlighting opportunities for strategic pricing adjustments during shoulder and low seasons. Explore the typical Airbnb income in Little Petherick across different performance tiers:
- Best-in-class properties (Top 10%) achieve $14,300+ monthly, often utilizing dynamic pricing and superior guest experiences.
- Strong performing properties (Top 25%) earn $9,354 or more, indicating effective management and desirable locations/amenities.
- Typical properties (Median) generate around $3,368 per month, representing the average market performance.
- Entry-level properties (Bottom 25%) see earnings around $1,486, often with potential for optimization.
Average Monthly Airbnb Earnings Trend in Little Petherick
Little Petherick Airbnb Occupancy Rate Trends (2026)
Maximize your bookings by understanding the Little Petherick STR occupancy trends. Seasonal demand shifts significantly influence how often properties are booked. Typically, Julysees the highest demand (peak season occupancy), while October experiences the lowest (low season). Effective strategies, like adjusting minimum stays or offering promotions, can boost occupancy during slower periods. Here's how different property tiers perform in Little Petherick:
- Best-in-class properties (Top 10%) achieve 78%+ occupancy, indicating high desirability and potentially optimized availability.
- Strong performing properties (Top 25%) maintain 57% or higher occupancy, suggesting good market fit and guest satisfaction.
- Typical properties (Median) have an occupancy rate around 34%.
- Entry-level properties (Bottom 25%) average 18% occupancy, potentially facing higher vacancy.
Average Monthly Occupancy Rate Trend in Little Petherick
Average Daily Rate (ADR) Airbnb Trends in Little Petherick (2026)
Effective short term rental pricing strategy in Little Petherick involves understanding monthly ADR fluctuations. The Average Daily Rate (ADR) for Airbnb in Little Petherick typically peaks in June and dips lowest during February. Leveraging Airbnb dynamic pricing tools or strategies based on this seasonality can significantly boost revenue. Here's a look at the typical nightly rates achieved:
- Best-in-class properties (Top 10%) command rates of $882+ per night, often due to premium features or locations.
- Strong performing properties (Top 25%) achieve nightly rates of $564 or more.
- Typical properties (Median) charge around $313 per night.
- Entry-level properties (Bottom 25%) earn around $179 per night.
Average Daily Rate (ADR) Trend by Month in Little Petherick
Get Live Little Petherick Market Intelligence 👇

Explore Real-time Analytics
Airbnb Seasonality Analysis & Trends in Little Petherick (2026)
Peak Season (July, August, March)
- Revenue averages $10,303 per month
- Occupancy rates average 50.8%
- Daily rates average $446
Shoulder Season
- Revenue averages $6,689 per month
- Occupancy maintains around 39.0%
- Daily rates hold near $446
Low Season (January, October, November)
- Revenue drops to average $3,238 per month
- Occupancy decreases to average 26.2%
- Daily rates adjust to average $413
Seasonality Insights for Little Petherick
- The Airbnb seasonality in Little Petherick shows highly seasonal trends requiring careful strategy. While the sections above show seasonal averages, it's also insightful to look at the extremes:
- During the high season, the absolute peak month showcases Little Petherick's highest earning potential, with monthly revenues capable of climbing to $12,262, occupancy reaching a high of 60.7%, and ADRs peaking at $507.
- Conversely, the slowest single month of the year, typically falling within the low season, marks the market's lowest point. In this month, revenue might dip to $2,684, occupancy could drop to 21.2%, and ADRs may adjust down to $377.
- Understanding both the seasonal averages and these monthly peaks and troughs in revenue, occupancy, and ADR is crucial for maximizing your Airbnb profit potential in Little Petherick.
Seasonal Strategies for Maximizing Profit
- Peak Season: Maximize revenue through premium pricing and potentially longer minimum stays. Ensure high availability.
- Low Season: Offer competitive pricing, special promotions (e.g., extended stay discounts), and flexible cancellation policies. Target off-season travelers like remote workers or budget-conscious guests.
- Shoulder Seasons: Implement dynamic pricing that balances peak and low rates. Target weekend travelers or specific events. Offer slightly more flexible terms than peak season.
- Regularly analyze your own performance against these Little Petherick seasonality benchmarks and adjust your pricing and availability strategy accordingly.
Best Areas for Airbnb Investment in Little Petherick (2026)
Exploring the top neighborhoods for short-term rentals in Little Petherick? This section highlights key areas, outlining why they are attractive for hosts and guests, along with notable local attractions. Consider these locations based on your target guest profile and investment strategy.
| Neighborhood / Area | Why Host Here? (Target Guests & Appeal) | Key Attractions & Landmarks |
|---|---|---|
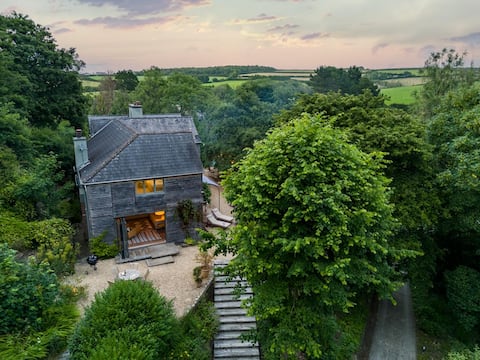
| Little Petherick Village | Charming village atmosphere with traditional English character, perfect for tourists looking to experience the countryside of Cornwall. Close to waterway activities and nature. | St. Petroc's Church, Camel River, Walking trails through rural Cornwall, Local pubs and restaurants, Nearby beaches like Padstow, Tranquil countryside views |
| Padstow | Famous for its picturesque harbor and seafood restaurants, Padstow is a popular destination for tourists. Offers a lively atmosphere with plenty of dining options and coastal activities. | Padstow Harbour, Rick Stein's Seafood Restaurant, Camel Trail, Constantine Bay, Nearby beaches, Padstow Museum |
| Rock | A serene coastal village directly across from Padstow, known for its sandy beaches and sailing. Attracts families and water sports enthusiasts during the summer months. | Rock Beach, Sailing and windsurfing, St. Enodoc Golf Club, Dining with a view of the estuary, Water taxis to Padstow, Coastal walks |
| Tintagel | Rich in Arthurian legend and stunning coastal scenery, Tintagel attracts history buffs and nature lovers. An excellent spot to experience the dramatic cliffs of Cornwall. | Tintagel Castle, Merlin's Cave, King Arthur's Great Halls, Coastal walking paths, Tintagel Haven, Local shops and cafes |
| Newquay | A bustling seaside town famous for its surf beaches and vibrant nightlife. Attracts a younger crowd looking for beach activities and socializing. | Fistral Beach, Newquay Zoo, Watergate Bay, Newquay Harbour, Surf schools, Nightclubs |
| Bude | Popular coastal town with beautiful beaches and a relaxed vibe. Suitable for families and anyone looking for outdoor activities like surfing, cycling, and walking. | Summerleaze Beach, Bude Castle, Canal walks, Surfing and beach activities, Camelot Castle, Local shops and cafes |
| St Ives | Artistic community with stunning beaches and rich culture. Great for tourists interested in art galleries, beaches, and local cuisine. | St Ives Harbour, Tate St Ives, Barbara Hepworth Museum, Porthmeor Beach, Art galleries, Coastal paths |
| Fowey | Charming harbor town with rich maritime history. Popular for sailing, coastal walks, and exploring local shops and eateries. | Fowey estuary, Readymoney Cove, Fowey Museum, The historic town centre, Sailing and boat trips, Local seafood restaurants |
Understanding Airbnb License Requirements & STR Laws in Little Petherick (2026)
While Little Petherick, England, United Kingdom currently shows low STR regulations, specific Airbnb license requirements might still exist or change. Always verify the latest short term rental regulations and Airbnb license requirements directly with local government authorities for Little Petherick to ensure full compliance before hosting.
(Source: AirROI data, 2026, finding no licensed listings among those analyzed)
Top Performing Airbnb Properties in Little Petherick (2026)
Benchmark your potential! Explore examples of top-performing Airbnb properties in Little Petherickbased on Trailing Twelve Month (TTM) revenue. Analyze their characteristics, revenue, occupancy rate, and ADR to understand what drives success in this market.
5 Bed in Little Petherick (oc-s29057)
Entire Place • 5 bedrooms
Glebe Cottage, Little Petherick, near Padstow
Entire Place • 4 bedrooms
2 Bed in Wadebridge (oc-82681)
Entire Place • 2 bedrooms

1 Bed in Little Petherick (oc-a30789)
Entire Place • 1 bedroom
3 Bed in St. Ervan (oc-t29660)
Entire Place • 3 bedrooms
The Roundhouse Tregonce, Padstow
Entire Place • 1 bedroom
Note: Performance varies based on location, size, amenities, seasonality, and management quality. Data reflects the past 12 months.
Top Performing Airbnb Hosts in Little Petherick (2026)
Learn from the best! This table showcases top-performing Airbnb hosts in Little Petherick based on the number of properties managed and estimated total revenue over the past year. Analyze their scale and performance metrics.
| Host Name | Properties | Grossing Revenue | Stay Reviews | Avg Rating |
|---|---|---|---|---|
| Holidaycottages.Co.Uk | 17 | $863,995 | 48 | 4.65/5.0 |
| Holidaycottages.Co.Uk | 2 | $140,891 | 7 | 4.67/5.0 |
| David | 1 | $128,269 | 39 | 4.97/5.0 |
| Scott | 1 | $75,474 | 69 | 4.99/5.0 |
| Cornish Holiday | 1 | $33,756 | 15 | 4.60/5.0 |
| Ninety Stays | 1 | $25,761 | 15 | 4.20/5.0 |
| Allison | 1 | $24,532 | 60 | 5.00/5.0 |
| Cottages | 2 | $20,627 | 6 | 4.00/5.0 |
| Olivia | 1 | $10,707 | 66 | 4.64/5.0 |
| Alison | 1 | $10,669 | 68 | 4.97/5.0 |
Analyzing the strategies of top hosts, such as their property selection, pricing, and guest communication, can offer valuable lessons for optimizing your own Airbnb operations in Little Petherick.
Dive Deeper: Advanced Little Petherick STR Market Data (2026)
Ready to unlock more insights? AirROI provides access to advanced metrics and comprehensive Airbnb data for Little Petherick. Explore detailed analytics beyond this report to refine your investment strategy, optimize pricing, and maximize your vacation rental profits.
Explore Advanced MetricsLittle Petherick Short-Term Rental Market Composition (2026): Property & Room Types
Room Type Distribution
Property Type Distribution
Market Composition Insights for Little Petherick
- The Little Petherick Airbnb market composition is heavily skewed towards Entire Home/Apt listings, which make up 100% of the 32 active rentals. This indicates strong guest preference for privacy and space.
- Looking at the property type distribution in Little Petherick, House properties are the most common (84.4%), reflecting the local real estate landscape.
- Houses represent a significant 84.4% portion, catering likely to families or larger groups.
- Smaller segments like unique stays, others (combined 6.2%) offer potential for unique stay experiences.
Little Petherick Airbnb Room Capacity Analysis (2026): Bedroom Distribution
Distribution of Listings by Number of Bedrooms
Room Capacity Insights for Little Petherick
- The dominant room capacity in Little Petherick is 2 bedrooms listings, making up 34.4% of the market. This suggests a strong demand for properties suitable for couples or solo travelers.
- Together, 2 bedrooms and 3 bedrooms properties represent 56.3% of the active Airbnb listings in Little Petherick, indicating a high concentration in these sizes.
- A significant 43.8% of listings offer 3+ bedrooms, catering to larger groups and families seeking more space in Little Petherick.
Little Petherick Vacation Rental Guest Capacity Trends (2026)
Distribution of Listings by Guest Capacity
Guest Capacity Insights for Little Petherick
- The most common guest capacity trend in Little Petherick vacation rentals is listings accommodating 4 guests (37.5%). This suggests the primary traveler segment is likely small families or groups.
- Properties designed for 4 guests and 6 guests dominate the Little Petherick STR market, accounting for 59.4% of listings.
- 43.8% of properties accommodate 6+ guests, serving the market segment for larger families or group travel in Little Petherick.
- On average, properties in Little Petherick are equipped to host 4.9 guests.
Little Petherick Airbnb Booking Patterns (2026): Available vs. Booked Days
Available Days Distribution
Booked Days Distribution
Booking Pattern Insights for Little Petherick
- The most common availability pattern in Little Petherick falls within the 271-366 days range, representing 68.8% of listings. This suggests many properties have significant open periods on their calendars.
- Approximately 87.6% of listings show high availability (181+ days open annually), indicating potential for increased bookings or specific owner usage patterns.
- For booked days, the 1-30 days range is most frequent in Little Petherick (34.4%), reflecting common guest stay durations or potential owner blocking patterns.
- A notable 15.6% of properties secure long booking periods (181+ days booked per year), highlighting successful long-term rental strategies or significant owner usage.
Little Petherick Airbnb Minimum Stay Requirements Analysis
Distribution of Listings by Minimum Night Requirement
1 Night
8 listings
25% of total
3 Nights
3 listings
9.4% of total
4-6 Nights
1 listings
3.1% of total
30+ Nights
20 listings
62.5% of total
Key Insights
- The most prevalent minimum stay requirement in Little Petherick is 30+ Nights, adopted by 62.5% of listings. This highlights the market's preference for longer commitments.
- A significant segment (62.5%) caters to monthly stays (30+ nights) in Little Petherick, pointing to opportunities in the extended-stay market.
Recommendations
- Align with the market by considering a 30+ Nights minimum stay, as 62.5% of Little Petherick hosts use this setting.
- If feasible, allowing 1-night stays, especially midweek or during low season, could capture last-minute bookings, as only 25% currently do.
- Explore offering discounts for stays of 30+ nights to attract the 62.5% of the market seeking extended stays.
- Adjust minimum nights based on seasonality – potentially shorter during low season and longer during peak demand periods in Little Petherick.
Little Petherick Airbnb Cancellation Policy Trends Analysis (2026)
Super Strict 60 Days
22 listings
68.8% of total
Moderate
1 listings
3.1% of total
Firm
6 listings
18.8% of total
Strict
3 listings
9.4% of total
Cancellation Policy Insights for Little Petherick
- The prevailing Airbnb cancellation policy trend in Little Petherick is Super Strict 60 Days, used by 68.8% of listings.
- There's a relatively balanced mix between guest-friendly (3.1%) and stricter (28.2%) policies, offering choices for different guest needs.
- Strict cancellation policies are quite rare (9.4%), potentially making listings with this policy less competitive unless justified by high demand or property type.
Recommendations for Hosts
- Consider adopting a Super Strict 60 Days policy to align with the 68.8% market standard in Little Petherick.
- Using a Strict policy might deter some guests, as only 9.4% of listings use it. Evaluate if potential revenue protection outweighs possible lower booking rates.
- Regularly review your cancellation policy against competitors and market demand shifts in Little Petherick.
Little Petherick STR Booking Lead Time Analysis (2026)
Average Booking Lead Time by Month
Booking Lead Time Insights for Little Petherick
- The overall average booking lead time for vacation rentals in Little Petherick is 67 days.
- Guests book furthest in advance for stays during September (average 122 days), likely coinciding with peak travel demand or local events.
- The shortest booking windows occur for stays in February (average 16 days), indicating more last-minute travel plans during this time.
- Seasonally, Summer (80 days avg.) sees the longest lead times, while Winter (44 days avg.) has the shortest, reflecting typical travel planning cycles.
Recommendations for Hosts
- Use the overall average lead time (67 days) as a baseline for your pricing and availability strategy in Little Petherick.
- For September stays, consider implementing length-of-stay discounts or slightly higher rates for bookings made less than 122 days out to capitalize on advance planning.
- Target marketing efforts for the Summer season well in advance (at least 80 days) to capture early planners.
- Monitor your own booking lead times against these Little Petherick averages to identify opportunities for dynamic pricing adjustments.
Popular & Essential Airbnb Amenities in Little Petherick (2026)
Amenity Prevalence
Amenity Insights for Little Petherick
- Essential amenities in Little Petherick that guests expect include: Heating, Kitchen. Lacking these (any) could significantly impact bookings.
- Popular amenities like Wifi, TV, Dishes and silverware are common but not universal. Offering these can provide a competitive edge.
- Warning: Wifi is not universally provided but is considered essential globally. Ensure reliable Wifi is offered.
Recommendations for Hosts
- Ensure your listing includes all essential amenities for Little Petherick: Heating, Kitchen.
- Prioritize adding missing essentials: Heating, Kitchen.
- Consider adding popular differentiators like Wifi or TV to increase appeal.
- Highlight unique or less common amenities you offer (e.g., hot tub, dedicated workspace, EV charger) in your listing description and photos.
- Regularly check competitor amenities in Little Petherick to stay competitive.
Little Petherick Airbnb Guest Demographics & Profile Analysis (2026)
Guest Profile Summary for Little Petherick
- The typical guest profile for Airbnb in Little Petherick consists of primarily domestic travelers (91%), often arriving from nearby England, typically belonging to the Post-2000s (Gen Z/Alpha) group (50%), primarily speaking English or French.
- Domestic travelers account for 90.6% of guests.
- Key international markets include United Kingdom (90.6%) and Australia (4.2%).
- Top languages spoken are English (53.8%) followed by French (12.8%).
- A significant demographic segment is the Post-2000s (Gen Z/Alpha) group, representing 50% of guests.
Recommendations for Hosts
- Target domestic marketing efforts towards travelers from England and London.
- Tailor amenities and listing descriptions to appeal to the dominant Post-2000s (Gen Z/Alpha) demographic (e.g., highlight fast WiFi, smart home features, local guides).
- Highlight unique local experiences or amenities relevant to the primary guest profile.
- Consider seasonal promotions aligned with peak travel times for key origin markets.
Nearby Short-Term Rental Market Comparison
How does the Little Petherick Airbnb market stack up against its neighbors? Compare key performance metrics like average monthly revenue, ADR, and occupancy rates in surrounding areas to understand the broader regional STR landscape.
| Market | Active Properties | Monthly Revenue | Daily Rate | Avg. Occupancy |
|---|---|---|---|---|
| Angle | 13 | $6,069 | $626.63 | 50% |
| Milverton | 10 | $5,067 | $377.17 | 48% |
| Southerndown | 16 | $5,064 | $409.45 | 46% |
| Southgate | 13 | $4,781 | $282.69 | 56% |
| Bridgwater | 18 | $4,662 | $355.91 | 53% |
| Crai | 31 | $4,496 | $552.02 | 38% |
| New Polzeath | 17 | $4,089 | $281.24 | 54% |
| Llantrisant | 15 | $4,086 | $275.56 | 44% |
| Trenance | 25 | $4,037 | $513.80 | 39% |
| Rhossili | 30 | $4,019 | $313.39 | 50% |