Lanreath Airbnb Market Analysis 2026: Short Term Rental Data & Vacation Rental Statistics in England, United Kingdom
Is Airbnb profitable in Lanreath in 2026? Explore comprehensive Airbnb analytics for Lanreath, England, United Kingdom to uncover income potential. This 2026 STR market report for Lanreath, based on AirROI data from February 2025 to January 2026, reveals key trends in the niche market of 25 active listings.
Whether you're considering an Airbnb investment in Lanreath, optimizing your existing vacation rental, or exploring rental arbitrage opportunities, understanding the Lanreath Airbnb data is crucial. Leveraging the low regulation environment is key to maximizing your short term rental income potential. Let's dive into the specifics.
Key Lanreath Airbnb Performance Metrics Overview
Monthly Airbnb Revenue Variations & Income Potential in Lanreath (2026)
Understanding the monthly revenue variations for Airbnb listings in Lanreath is key to maximizing your short term rental income potential. Seasonality significantly impacts earnings. Our analysis, based on data from the past 12 months, shows that the peak revenue month for STRs in Lanreath is typically August, while January often presents the lowest earnings, highlighting opportunities for strategic pricing adjustments during shoulder and low seasons. Explore the typical Airbnb income in Lanreath across different performance tiers:
- Best-in-class properties (Top 10%) achieve $3,152+ monthly, often utilizing dynamic pricing and superior guest experiences.
- Strong performing properties (Top 25%) earn $2,333 or more, indicating effective management and desirable locations/amenities.
- Typical properties (Median) generate around $1,419 per month, representing the average market performance.
- Entry-level properties (Bottom 25%) see earnings around $1,027, often with potential for optimization.
Average Monthly Airbnb Earnings Trend in Lanreath
Lanreath Airbnb Occupancy Rate Trends (2026)
Maximize your bookings by understanding the Lanreath STR occupancy trends. Seasonal demand shifts significantly influence how often properties are booked. Typically, Augustsees the highest demand (peak season occupancy), while January experiences the lowest (low season). Effective strategies, like adjusting minimum stays or offering promotions, can boost occupancy during slower periods. Here's how different property tiers perform in Lanreath:
- Best-in-class properties (Top 10%) achieve 59%+ occupancy, indicating high desirability and potentially optimized availability.
- Strong performing properties (Top 25%) maintain 41% or higher occupancy, suggesting good market fit and guest satisfaction.
- Typical properties (Median) have an occupancy rate around 29%.
- Entry-level properties (Bottom 25%) average 20% occupancy, potentially facing higher vacancy.
Average Monthly Occupancy Rate Trend in Lanreath
Average Daily Rate (ADR) Airbnb Trends in Lanreath (2026)
Effective short term rental pricing strategy in Lanreath involves understanding monthly ADR fluctuations. The Average Daily Rate (ADR) for Airbnb in Lanreath typically peaks in January and dips lowest during March. Leveraging Airbnb dynamic pricing tools or strategies based on this seasonality can significantly boost revenue. Here's a look at the typical nightly rates achieved:
- Best-in-class properties (Top 10%) command rates of $396+ per night, often due to premium features or locations.
- Strong performing properties (Top 25%) achieve nightly rates of $265 or more.
- Typical properties (Median) charge around $155 per night.
- Entry-level properties (Bottom 25%) earn around $127 per night.
Average Daily Rate (ADR) Trend by Month in Lanreath
Get Live Lanreath Market Intelligence 👇

Explore Real-time Analytics
Airbnb Seasonality Analysis & Trends in Lanreath (2026)
Peak Season (August, July, September)
- Revenue averages $2,845 per month
- Occupancy rates average 59.3%
- Daily rates average $224
Shoulder Season
- Revenue averages $1,647 per month
- Occupancy maintains around 30.8%
- Daily rates hold near $202
Low Season (January, February, November)
- Revenue drops to average $699 per month
- Occupancy decreases to average 11.1%
- Daily rates adjust to average $219
Seasonality Insights for Lanreath
- The Airbnb seasonality in Lanreath shows highly seasonal trends requiring careful strategy. While the sections above show seasonal averages, it's also insightful to look at the extremes:
- During the high season, the absolute peak month showcases Lanreath's highest earning potential, with monthly revenues capable of climbing to $3,245, occupancy reaching a high of 64.0%, and ADRs peaking at $251.
- Conversely, the slowest single month of the year, typically falling within the low season, marks the market's lowest point. In this month, revenue might dip to $374, occupancy could drop to 4.8%, and ADRs may adjust down to $181.
- Understanding both the seasonal averages and these monthly peaks and troughs in revenue, occupancy, and ADR is crucial for maximizing your Airbnb profit potential in Lanreath.
Seasonal Strategies for Maximizing Profit
- Peak Season: Maximize revenue through premium pricing and potentially longer minimum stays. Ensure high availability.
- Low Season: Offer competitive pricing, special promotions (e.g., extended stay discounts), and flexible cancellation policies. Target off-season travelers like remote workers or budget-conscious guests.
- Shoulder Seasons: Implement dynamic pricing that balances peak and low rates. Target weekend travelers or specific events. Offer slightly more flexible terms than peak season.
- Regularly analyze your own performance against these Lanreath seasonality benchmarks and adjust your pricing and availability strategy accordingly.
Best Areas for Airbnb Investment in Lanreath (2026)
Exploring the top neighborhoods for short-term rentals in Lanreath? This section highlights key areas, outlining why they are attractive for hosts and guests, along with notable local attractions. Consider these locations based on your target guest profile and investment strategy.
| Neighborhood / Area | Why Host Here? (Target Guests & Appeal) | Key Attractions & Landmarks |
|---|---|---|
| Polperro | Picturesque fishing village famous for its narrow streets and stunning coastal scenery. Attracts tourists with its charm and proximity to beautiful beaches. | Polperro Harbour, Polperro Arts Foundation, Talland Bay, The Smugglers Museum, St. John's Church |
| Looe | Popular seaside town known for its sandy beaches and vibrant fishing port. Ideal for vacationers looking for a relaxing seaside experience with lots of local attractions. | Looe Beach, East Looe Beach, The Old Guildhall Museum and Gaol, Looe Island, River Looe |
| Fowey | Quaint town located at the mouth of the River Fowey. Offers scenic views and is a gateway to the South West Coast Path, making it a hit with walkers and nature lovers. | Fowey Estuary, St. Catherine's Castle, Fowey River Heritage Trail, Readymoney Cove, Fowey Museum |
| Bodmin Moor | Rugged moorland offering stunning natural landscapes and hiking opportunities. A perfect spot for adventure seekers and those looking to escape the crowds. | Brown Willy, Rough Tor, Bodmin Jail, Siblyback Lake, Golitha Falls |
| Lostwithiel | Historical town known for its medieval buildings and antique shops. Attracts visitors interested in history and culture, making it a great location for short stays. | Restormel Castle, Lostwithiel Museum, St. Bartholomew's Church, Causley Trust, The Duchy of Cornwall |
| Mevagissey | Charming fishing village with a bustling harbor. It's a great destination for those looking for authenticity and local seafood experiences. | Mevagissey Harbour, Mevagissey Museum, The Lost Gardens of Heligan, Pentewan Sands |
| Charlestown | Georgian harbour village known for its picturesque setting and historical Tall Ships. Popular with film and history buffs. | Charlestown Harbour, Shipwreck and Heritage Centre, Tall Ships, Local pubs and restaurants |
| Porthcurno | Stunning beach known for its clear waters and the famous Minack Theatre. Attracts beach lovers and theatre enthusiasts alike. | Porthcurno Beach, Minack Theatre, Porthcurno Telegraph Museum, The Logan Rock |
Understanding Airbnb License Requirements & STR Laws in Lanreath (2026)
While Lanreath, England, United Kingdom currently shows low STR regulations, specific Airbnb license requirements might still exist or change. Always verify the latest short term rental regulations and Airbnb license requirements directly with local government authorities for Lanreath to ensure full compliance before hosting.
(Source: AirROI data, 2026, finding no licensed listings among those analyzed)
Top Performing Airbnb Properties in Lanreath (2026)
Benchmark your potential! Explore examples of top-performing Airbnb properties in Lanreathbased on Trailing Twelve Month (TTM) revenue. Analyze their characteristics, revenue, occupancy rate, and ADR to understand what drives success in this market.

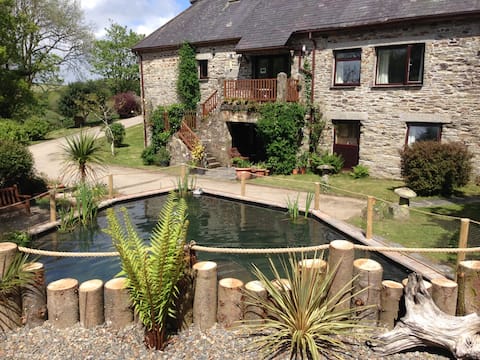
The Hay Loft, Wilton Farm
Entire Place • 2 bedrooms

Swallow Cottage Cornwall
Entire Place • 2 bedrooms
The Linney, Woodlay Holidays
Entire Place • 3 bedrooms

Wykeham Coach House
Entire Place • 2 bedrooms
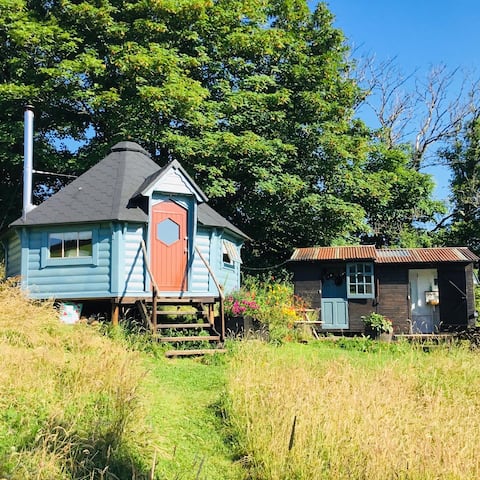
Cabin and shepherds hut in Rural Cornwall for 2-6
Entire Place • 2 bedrooms
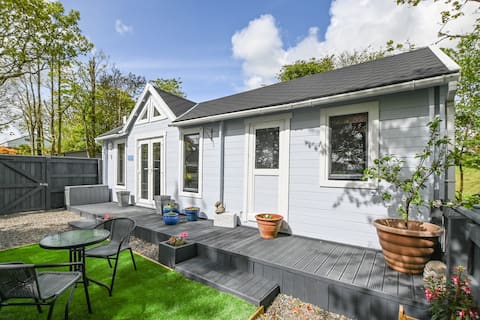
The Little Blue Studio a peaceful retreat for two
Entire Place • 1 bedroom
Note: Performance varies based on location, size, amenities, seasonality, and management quality. Data reflects the past 12 months.
Top Performing Airbnb Hosts in Lanreath (2026)
Learn from the best! This table showcases top-performing Airbnb hosts in Lanreath based on the number of properties managed and estimated total revenue over the past year. Analyze their scale and performance metrics.
| Host Name | Properties | Grossing Revenue | Stay Reviews | Avg Rating |
|---|---|---|---|---|
| Julie | 6 | $73,106 | 204 | 4.82/5.0 |
| Julia & Jon | 2 | $31,472 | 155 | 4.85/5.0 |
| Janet/Kirsty | 3 | $29,325 | 96 | 4.79/5.0 |
| Jacqueline | 1 | $27,540 | 54 | 4.94/5.0 |
| Simon | 1 | $22,641 | 14 | 4.93/5.0 |
| Stephen | 1 | $20,464 | 26 | 4.96/5.0 |
| Sykes Holiday Cottages Limited | 2 | $19,850 | 12 | 4.73/5.0 |
| Philippa | 1 | $19,361 | 86 | 4.93/5.0 |
| Hilary | 1 | $19,208 | 105 | 4.98/5.0 |
| Sykes Holiday Cottages | 5 | $14,408 | 9 | 4.33/5.0 |
Analyzing the strategies of top hosts, such as their property selection, pricing, and guest communication, can offer valuable lessons for optimizing your own Airbnb operations in Lanreath.
Dive Deeper: Advanced Lanreath STR Market Data (2026)
Ready to unlock more insights? AirROI provides access to advanced metrics and comprehensive Airbnb data for Lanreath. Explore detailed analytics beyond this report to refine your investment strategy, optimize pricing, and maximize your vacation rental profits.
Explore Advanced MetricsLanreath Short-Term Rental Market Composition (2026): Property & Room Types
Room Type Distribution
Property Type Distribution
Market Composition Insights for Lanreath
- The Lanreath Airbnb market composition is heavily skewed towards Entire Home/Apt listings, which make up 100% of the 25 active rentals. This indicates strong guest preference for privacy and space.
- Looking at the property type distribution in Lanreath, House properties are the most common (52%), reflecting the local real estate landscape.
- Houses represent a significant 52% portion, catering likely to families or larger groups.
- Smaller segments like outdoor/unique (combined 4.0%) offer potential for unique stay experiences.
Lanreath Airbnb Room Capacity Analysis (2026): Bedroom Distribution
Distribution of Listings by Number of Bedrooms
Room Capacity Insights for Lanreath
- The dominant room capacity in Lanreath is 2 bedrooms listings, making up 64% of the market. This suggests a strong demand for properties suitable for couples or solo travelers.
- Together, 2 bedrooms and 1 bedroom properties represent 92.0% of the active Airbnb listings in Lanreath, indicating a high concentration in these sizes.
- Listings with 3+ bedrooms (8.0%) represent a smaller niche, potentially indicating an underserved market for larger group accommodations in Lanreath.
Lanreath Vacation Rental Guest Capacity Trends (2026)
Distribution of Listings by Guest Capacity
Guest Capacity Insights for Lanreath
- The most common guest capacity trend in Lanreath vacation rentals is listings accommodating 4 guests (60%). This suggests the primary traveler segment is likely small families or groups.
- Properties designed for 4 guests and 2 guests dominate the Lanreath STR market, accounting for 84.0% of listings.
- On average, properties in Lanreath are equipped to host 3.8 guests.
Lanreath Airbnb Booking Patterns (2026): Available vs. Booked Days
Available Days Distribution
Booked Days Distribution
Booking Pattern Insights for Lanreath
- The most common availability pattern in Lanreath falls within the 271-366 days range, representing 68% of listings. This suggests many properties have significant open periods on their calendars.
- Approximately 100.0% of listings show high availability (181+ days open annually), indicating potential for increased bookings or specific owner usage patterns.
- For booked days, the 31-90 days range is most frequent in Lanreath (36%), reflecting common guest stay durations or potential owner blocking patterns.
Lanreath Airbnb Minimum Stay Requirements Analysis
Distribution of Listings by Minimum Night Requirement
3 Nights
7 listings
28% of total
4-6 Nights
2 listings
8% of total
7-29 Nights
2 listings
8% of total
30+ Nights
14 listings
56% of total
Key Insights
- The most prevalent minimum stay requirement in Lanreath is 30+ Nights, adopted by 56% of listings. This highlights the market's preference for longer commitments.
- A significant segment (56%) caters to monthly stays (30+ nights) in Lanreath, pointing to opportunities in the extended-stay market.
Recommendations
- Align with the market by considering a 30+ Nights minimum stay, as 56% of Lanreath hosts use this setting.
- Explore offering discounts for stays of 30+ nights to attract the 56% of the market seeking extended stays.
- Adjust minimum nights based on seasonality – potentially shorter during low season and longer during peak demand periods in Lanreath.
Lanreath Airbnb Cancellation Policy Trends Analysis (2026)
Super Strict 60 Days
8 listings
32% of total
Moderate
2 listings
8% of total
Firm
12 listings
48% of total
Strict
3 listings
12% of total
Cancellation Policy Insights for Lanreath
- The prevailing Airbnb cancellation policy trend in Lanreath is Firm, used by 48% of listings.
- A majority (60.0%) of hosts in Lanreath utilize Firm or Strict policies, indicating a market where hosts prioritize booking security.
Recommendations for Hosts
- Consider adopting a Firm policy to align with the 48% market standard in Lanreath.
- Using a Strict policy might deter some guests, as only 12% of listings use it. Evaluate if potential revenue protection outweighs possible lower booking rates.
- Regularly review your cancellation policy against competitors and market demand shifts in Lanreath.
Lanreath STR Booking Lead Time Analysis (2026)
Average Booking Lead Time by Month
Booking Lead Time Insights for Lanreath
- The overall average booking lead time for vacation rentals in Lanreath is 55 days.
- Guests book furthest in advance for stays during March (average 119 days), likely coinciding with peak travel demand or local events.
- The shortest booking windows occur for stays in January (average 1 days), indicating more last-minute travel plans during this time.
- Seasonally, Spring (86 days avg.) sees the longest lead times, while Winter (19 days avg.) has the shortest, reflecting typical travel planning cycles.
Recommendations for Hosts
- Use the overall average lead time (55 days) as a baseline for your pricing and availability strategy in Lanreath.
- For March stays, consider implementing length-of-stay discounts or slightly higher rates for bookings made less than 119 days out to capitalize on advance planning.
- During January, focus on last-minute booking availability and promotions, as guests book with very short notice (1 days avg.).
- Target marketing efforts for the Spring season well in advance (at least 86 days) to capture early planners.
- Monitor your own booking lead times against these Lanreath averages to identify opportunities for dynamic pricing adjustments.
Popular & Essential Airbnb Amenities in Lanreath (2026)
Amenity Prevalence
Amenity Insights for Lanreath
- Essential amenities in Lanreath that guests expect include: Smoke alarm, Kitchen, Heating, Hot water, Free parking on premises. Lacking these (any) could significantly impact bookings.
- Popular amenities like TV, Fire extinguisher, Dishes and silverware are common but not universal. Offering these can provide a competitive edge.
- Warning: Wifi is not universally provided but is considered essential globally. Ensure reliable Wifi is offered.
Recommendations for Hosts
- Ensure your listing includes all essential amenities for Lanreath: Smoke alarm, Kitchen, Heating, Hot water, Free parking on premises.
- Prioritize adding missing essentials: Hot water, Free parking on premises.
- Consider adding popular differentiators like TV or Fire extinguisher to increase appeal.
- Highlight unique or less common amenities you offer (e.g., hot tub, dedicated workspace, EV charger) in your listing description and photos.
- Regularly check competitor amenities in Lanreath to stay competitive.
Lanreath Airbnb Guest Demographics & Profile Analysis (2026)
Guest Profile Summary for Lanreath
- The typical guest profile for Airbnb in Lanreath consists of primarily domestic travelers (84%), often arriving from nearby England, typically belonging to the Post-2000s (Gen Z/Alpha) group (50%), primarily speaking English or French.
- Domestic travelers account for 83.9% of guests.
- Key international markets include United Kingdom (83.9%) and Germany (4.3%).
- Top languages spoken are English (67.3%) followed by French (12.2%).
- A significant demographic segment is the Post-2000s (Gen Z/Alpha) group, representing 50% of guests.
Recommendations for Hosts
- Target domestic marketing efforts towards travelers from England and London.
- Tailor amenities and listing descriptions to appeal to the dominant Post-2000s (Gen Z/Alpha) demographic (e.g., highlight fast WiFi, smart home features, local guides).
- Highlight unique local experiences or amenities relevant to the primary guest profile.
- Consider seasonal promotions aligned with peak travel times for key origin markets.
Nearby Short-Term Rental Market Comparison
How does the Lanreath Airbnb market stack up against its neighbors? Compare key performance metrics like average monthly revenue, ADR, and occupancy rates in surrounding areas to understand the broader regional STR landscape.
| Market | Active Properties | Monthly Revenue | Daily Rate | Avg. Occupancy |
|---|---|---|---|---|
| Angle | 13 | $6,069 | $626.63 | 50% |
| Milverton | 10 | $5,067 | $377.17 | 48% |
| Southerndown | 16 | $5,064 | $409.45 | 46% |
| Southgate | 13 | $4,781 | $282.69 | 56% |
| Bridgwater | 18 | $4,662 | $355.91 | 53% |
| Crai | 31 | $4,496 | $552.02 | 38% |
| New Polzeath | 17 | $4,089 | $281.24 | 54% |
| Llantrisant | 15 | $4,086 | $275.56 | 44% |
| Trenance | 25 | $4,037 | $513.80 | 39% |
| Rhossili | 30 | $4,019 | $313.39 | 50% |