Hull Airbnb Market Analysis 2026: Short Term Rental Data & Vacation Rental Statistics in England, United Kingdom
Is Airbnb profitable in Hull in 2026? Explore comprehensive Airbnb analytics for Hull, England, United Kingdom to uncover income potential. This 2026 STR market report for Hull, based on AirROI data from February 2025 to January 2026, reveals key trends in the market of 273 active listings.
Whether you're considering an Airbnb investment in Hull, optimizing your existing vacation rental, or exploring rental arbitrage opportunities, understanding the Hull Airbnb data is crucial. Leveraging the low regulation environment is key to maximizing your short term rental income potential. Let's dive into the specifics.
Key Hull Airbnb Performance Metrics Overview
Monthly Airbnb Revenue Variations & Income Potential in Hull (2026)
Understanding the monthly revenue variations for Airbnb listings in Hull is key to maximizing your short term rental income potential. Seasonality significantly impacts earnings. Our analysis, based on data from the past 12 months, shows that the peak revenue month for STRs in Hull is typically July, while January often presents the lowest earnings, highlighting opportunities for strategic pricing adjustments during shoulder and low seasons. Explore the typical Airbnb income in Hull across different performance tiers:
- Best-in-class properties (Top 10%) achieve $3,083+ monthly, often utilizing dynamic pricing and superior guest experiences.
- Strong performing properties (Top 25%) earn $2,109 or more, indicating effective management and desirable locations/amenities.
- Typical properties (Median) generate around $1,118 per month, representing the average market performance.
- Entry-level properties (Bottom 25%) see earnings around $470, often with potential for optimization.
Average Monthly Airbnb Earnings Trend in Hull
Hull Airbnb Occupancy Rate Trends (2026)
Maximize your bookings by understanding the Hull STR occupancy trends. Seasonal demand shifts significantly influence how often properties are booked. Typically, Marchsees the highest demand (peak season occupancy), while January experiences the lowest (low season). Effective strategies, like adjusting minimum stays or offering promotions, can boost occupancy during slower periods. Here's how different property tiers perform in Hull:
- Best-in-class properties (Top 10%) achieve 77%+ occupancy, indicating high desirability and potentially optimized availability.
- Strong performing properties (Top 25%) maintain 60% or higher occupancy, suggesting good market fit and guest satisfaction.
- Typical properties (Median) have an occupancy rate around 35%.
- Entry-level properties (Bottom 25%) average 15% occupancy, potentially facing higher vacancy.
Average Monthly Occupancy Rate Trend in Hull
Average Daily Rate (ADR) Airbnb Trends in Hull (2026)
Effective short term rental pricing strategy in Hull involves understanding monthly ADR fluctuations. The Average Daily Rate (ADR) for Airbnb in Hull typically peaks in August and dips lowest during February. Leveraging Airbnb dynamic pricing tools or strategies based on this seasonality can significantly boost revenue. Here's a look at the typical nightly rates achieved:
- Best-in-class properties (Top 10%) command rates of $186+ per night, often due to premium features or locations.
- Strong performing properties (Top 25%) achieve nightly rates of $155 or more.
- Typical properties (Median) charge around $115 per night.
- Entry-level properties (Bottom 25%) earn around $85 per night.
Average Daily Rate (ADR) Trend by Month in Hull
Get Live Hull Market Intelligence 👇

Explore Real-time Analytics
Airbnb Seasonality Analysis & Trends in Hull (2026)
Peak Season (July, June, March)
- Revenue averages $1,692 per month
- Occupancy rates average 43.9%
- Daily rates average $122
Shoulder Season
- Revenue averages $1,467 per month
- Occupancy maintains around 39.7%
- Daily rates hold near $122
Low Season (January, November, December)
- Revenue drops to average $1,075 per month
- Occupancy decreases to average 30.7%
- Daily rates adjust to average $119
Seasonality Insights for Hull
- The Airbnb seasonality in Hull shows moderate seasonality with distinct peak and low periods. While the sections above show seasonal averages, it's also insightful to look at the extremes:
- During the high season, the absolute peak month showcases Hull's highest earning potential, with monthly revenues capable of climbing to $1,800, occupancy reaching a high of 45.1%, and ADRs peaking at $131.
- Conversely, the slowest single month of the year, typically falling within the low season, marks the market's lowest point. In this month, revenue might dip to $911, occupancy could drop to 27.3%, and ADRs may adjust down to $114.
- Understanding both the seasonal averages and these monthly peaks and troughs in revenue, occupancy, and ADR is crucial for maximizing your Airbnb profit potential in Hull.
Seasonal Strategies for Maximizing Profit
- Peak Season: Maximize revenue through premium pricing and potentially longer minimum stays. Ensure high availability.
- Low Season: Offer competitive pricing, special promotions (e.g., extended stay discounts), and flexible cancellation policies. Target off-season travelers like remote workers or budget-conscious guests.
- Shoulder Seasons: Implement dynamic pricing that balances peak and low rates. Target weekend travelers or specific events. Offer slightly more flexible terms than peak season.
- Regularly analyze your own performance against these Hull seasonality benchmarks and adjust your pricing and availability strategy accordingly.
Best Areas for Airbnb Investment in Hull (2026)
Exploring the top neighborhoods for short-term rentals in Hull? This section highlights key areas, outlining why they are attractive for hosts and guests, along with notable local attractions. Consider these locations based on your target guest profile and investment strategy.
| Neighborhood / Area | Why Host Here? (Target Guests & Appeal) | Key Attractions & Landmarks |
|---|---|---|
| City Centre | The bustling heart of Hull, offering a mix of culture, shopping, and dining. A prime location for tourists wanting to explore the city's attractions and nightlife. | Ferens Art Gallery, Hull Maritime Museum, St Stephen's Shopping Centre, Princess Quay, Middle Street Resource Centre |
| Old Town | A historic area filled with charming architecture and rich history. Great for guests interested in exploring Hull's past and enjoying boutique shops and pubs. | Streetlife Museum, Wilberforce House, Holy Trinity Church, The Hull New Theatre, The Old Grammar School |
| Marina | A picturesque waterfront area perfect for leisure and dining. Attracts visitors looking for scenic views and access to boating and water activities. | Hull Marina, The Deep, Craven Park, St. Andrew's Dock, Marina Entertainment |
| Newland Village | A vibrant student area that attracts a young crowd. Ideal for hosts looking to cater to university students and young professionals. | Newland Avenue, University of Hull, Local pubs and cafes, Endeavour Wharf, Parks and green spaces |
| Humber Bridge | A scenic area with beautiful views of the bridge and the River Humber. Attractive for nature lovers and those looking for picturesque stays. | Humber Bridge, Humber Bridge Country Park, Cycle paths, Scenic picnic spots, Walking trails |
| East Riding of Yorkshire | A beautiful rural area adjacent to Hull with natural attractions, making it ideal for guests looking for a peaceful getaway. | Sewerby Hall and Gardens, Bridlington Beach, Flamborough Head, Nature reserves, Walking and cycling paths |
| Anlaby | A suburban area with family-friendly attractions. Good for hosting families or those looking for a quieter stay close to Hull. | Anlaby Park, Local cafes, Shopping facilities, Parks, Community events |
| Beverley | A historic market town near Hull, known for its quaint streets and cultural events. Perfect for guests wanting a charming stay away from urban noise. | Beverley Minster, East Riding Treasure House, Beverley Market, Beverley Westwood, Historic streets |
Understanding Airbnb License Requirements & STR Laws in Hull (2026)
While Hull, England, United Kingdom currently shows low STR regulations, specific Airbnb license requirements might still exist or change. Always verify the latest short term rental regulations and Airbnb license requirements directly with local government authorities for Hull to ensure full compliance before hosting.
(Source: AirROI data, 2026, finding no licensed listings among those analyzed)
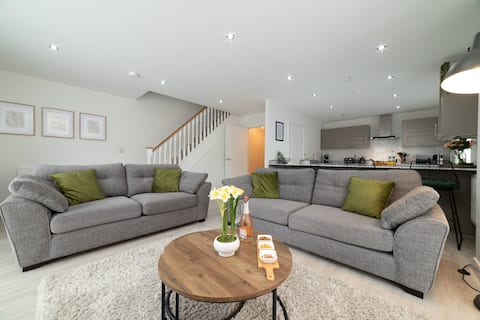
Top Performing Airbnb Properties in Hull (2026)
Benchmark your potential! Explore examples of top-performing Airbnb properties in Hullbased on Trailing Twelve Month (TTM) revenue. Analyze their characteristics, revenue, occupancy rate, and ADR to understand what drives success in this market.

Grammar School Yard four bedroom free parking
Entire Place • 4 bedrooms
Luxury Duplex 2-Bed Apartment Fruit Market Marina
Entire Place • 2 bedrooms

Luxurious Big BeautifulTown home
Entire Place • 3 bedrooms
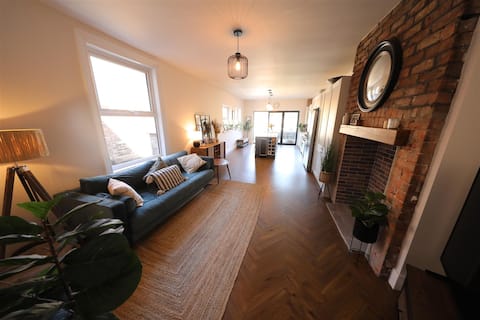
Beautiful three bed period home
Entire Place • 3 bedrooms

We Love HU -Sky Marina Suite
Entire Place • 2 bedrooms

Modern 3 Bed Town House Marina Hull
Entire Place • 3 bedrooms
Note: Performance varies based on location, size, amenities, seasonality, and management quality. Data reflects the past 12 months.
Top Performing Airbnb Hosts in Hull (2026)
Learn from the best! This table showcases top-performing Airbnb hosts in Hull based on the number of properties managed and estimated total revenue over the past year. Analyze their scale and performance metrics.
| Host Name | Properties | Grossing Revenue | Stay Reviews | Avg Rating |
|---|---|---|---|---|
| Jesouth | 17 | $154,995 | 336 | 4.66/5.0 |
| Nicola | 10 | $151,537 | 128 | 4.94/5.0 |
| Hullidays | 14 | $135,340 | 265 | 4.67/5.0 |
| Natalie | 7 | $95,855 | 32 | 4.56/5.0 |
| Rohit | 6 | $87,533 | 94 | 4.91/5.0 |
| Kenny | 4 | $85,059 | 275 | 4.83/5.0 |
| High Demand Hideaways | 5 | $76,757 | 71 | 4.45/5.0 |
| Tony | 5 | $63,491 | 266 | 4.73/5.0 |
| My Property Host | 3 | $63,008 | 66 | 4.51/5.0 |
| Humber Lofts Serviced Apartmen | 5 | $62,413 | 252 | 4.64/5.0 |
Analyzing the strategies of top hosts, such as their property selection, pricing, and guest communication, can offer valuable lessons for optimizing your own Airbnb operations in Hull.
Dive Deeper: Advanced Hull STR Market Data (2026)
Ready to unlock more insights? AirROI provides access to advanced metrics and comprehensive Airbnb data for Hull. Explore detailed analytics beyond this report to refine your investment strategy, optimize pricing, and maximize your vacation rental profits.
Explore Advanced MetricsHull Short-Term Rental Market Composition (2026): Property & Room Types
Room Type Distribution
Property Type Distribution
Market Composition Insights for Hull
- The Hull Airbnb market composition is heavily skewed towards Entire Home/Apt listings, which make up 78.4% of the 273 active rentals. This indicates strong guest preference for privacy and space.
- Looking at the property type distribution in Hull, Apartment/Condo properties are the most common (53.1%), reflecting the local real estate landscape.
- Houses represent a significant 42.9% portion, catering likely to families or larger groups.
- Smaller segments like hotel/boutique, others (combined 4.0%) offer potential for unique stay experiences.
Hull Airbnb Room Capacity Analysis (2026): Bedroom Distribution
Distribution of Listings by Number of Bedrooms
Room Capacity Insights for Hull
- The dominant room capacity in Hull is 2 bedrooms listings, making up 31.9% of the market. This suggests a strong demand for properties suitable for couples or solo travelers.
- Together, 2 bedrooms and 1 bedroom properties represent 60.5% of the active Airbnb listings in Hull, indicating a high concentration in these sizes.
- A significant 21.6% of listings offer 3+ bedrooms, catering to larger groups and families seeking more space in Hull.
Hull Vacation Rental Guest Capacity Trends (2026)
Distribution of Listings by Guest Capacity
Guest Capacity Insights for Hull
- The most common guest capacity trend in Hull vacation rentals is listings accommodating 4 guests (28.6%). This suggests the primary traveler segment is likely small families or groups.
- Properties designed for 4 guests and 2 guests dominate the Hull STR market, accounting for 50.2% of listings.
- 20.5% of properties accommodate 6+ guests, serving the market segment for larger families or group travel in Hull.
- On average, properties in Hull are equipped to host 3.4 guests.
Hull Airbnb Booking Patterns (2026): Available vs. Booked Days
Available Days Distribution
Booked Days Distribution
Booking Pattern Insights for Hull
- The most common availability pattern in Hull falls within the 271-366 days range, representing 54.2% of listings. This suggests many properties have significant open periods on their calendars.
- Approximately 86.1% of listings show high availability (181+ days open annually), indicating potential for increased bookings or specific owner usage patterns.
- For booked days, the 91-180 days range is most frequent in Hull (32.2%), reflecting common guest stay durations or potential owner blocking patterns.
- A notable 15.8% of properties secure long booking periods (181+ days booked per year), highlighting successful long-term rental strategies or significant owner usage.
Hull Airbnb Minimum Stay Requirements Analysis
Distribution of Listings by Minimum Night Requirement
1 Night
64 listings
23.4% of total
2 Nights
49 listings
17.9% of total
3 Nights
16 listings
5.9% of total
4-6 Nights
12 listings
4.4% of total
7-29 Nights
22 listings
8.1% of total
30+ Nights
110 listings
40.3% of total
Key Insights
- The most prevalent minimum stay requirement in Hull is 30+ Nights, adopted by 40.3% of listings. This highlights the market's preference for longer commitments.
- A significant segment (40.3%) caters to monthly stays (30+ nights) in Hull, pointing to opportunities in the extended-stay market.
Recommendations
- Align with the market by considering a 30+ Nights minimum stay, as 40.3% of Hull hosts use this setting.
- If feasible, allowing 1-night stays, especially midweek or during low season, could capture last-minute bookings, as only 23.4% currently do.
- Explore offering discounts for stays of 30+ nights to attract the 40.3% of the market seeking extended stays.
- Adjust minimum nights based on seasonality – potentially shorter during low season and longer during peak demand periods in Hull.
Hull Airbnb Cancellation Policy Trends Analysis (2026)
Super Strict 30 Days
2 listings
0.7% of total
Limited
4 listings
1.5% of total
Refundable
1 listings
0.4% of total
Flexible
89 listings
32.6% of total
Moderate
72 listings
26.4% of total
Firm
61 listings
22.3% of total
Strict
44 listings
16.1% of total
Cancellation Policy Insights for Hull
- The prevailing Airbnb cancellation policy trend in Hull is Flexible, used by 32.6% of listings.
- There's a relatively balanced mix between guest-friendly (59.0%) and stricter (38.4%) policies, offering choices for different guest needs.
Recommendations for Hosts
- Consider adopting a Flexible policy to align with the 32.6% market standard in Hull.
- Regularly review your cancellation policy against competitors and market demand shifts in Hull.
Hull STR Booking Lead Time Analysis (2026)
Average Booking Lead Time by Month
Booking Lead Time Insights for Hull
- The overall average booking lead time for vacation rentals in Hull is 37 days.
- Guests book furthest in advance for stays during August (average 91 days), likely coinciding with peak travel demand or local events.
- The shortest booking windows occur for stays in February (average 21 days), indicating more last-minute travel plans during this time.
- Seasonally, Summer (56 days avg.) sees the longest lead times, while Winter (28 days avg.) has the shortest, reflecting typical travel planning cycles.
Recommendations for Hosts
- Use the overall average lead time (37 days) as a baseline for your pricing and availability strategy in Hull.
- For August stays, consider implementing length-of-stay discounts or slightly higher rates for bookings made less than 91 days out to capitalize on advance planning.
- Target marketing efforts for the Summer season well in advance (at least 56 days) to capture early planners.
- Monitor your own booking lead times against these Hull averages to identify opportunities for dynamic pricing adjustments.
Popular & Essential Airbnb Amenities in Hull (2026)
Amenity Prevalence
Amenity Insights for Hull
- Essential amenities in Hull that guests expect include: Wifi, Kitchen, Washer, Smoke alarm. Lacking these (any) could significantly impact bookings.
- Popular amenities like TV, Heating, Refrigerator are common but not universal. Offering these can provide a competitive edge.
Recommendations for Hosts
- Ensure your listing includes all essential amenities for Hull: Wifi, Kitchen, Washer, Smoke alarm.
- Prioritize adding missing essentials: Wifi, Kitchen, Washer, Smoke alarm.
- Consider adding popular differentiators like TV or Heating to increase appeal.
- Highlight unique or less common amenities you offer (e.g., hot tub, dedicated workspace, EV charger) in your listing description and photos.
- Regularly check competitor amenities in Hull to stay competitive.
Hull Airbnb Guest Demographics & Profile Analysis (2026)
Guest Profile Summary for Hull
- The typical guest profile for Airbnb in Hull consists of primarily domestic travelers (88%), often arriving from nearby England, typically belonging to the Post-2000s (Gen Z/Alpha) group (50%), primarily speaking English or French.
- Domestic travelers account for 88.2% of guests.
- Key international markets include United Kingdom (88.2%) and United States (2.8%).
- Top languages spoken are English (68.2%) followed by French (8.5%).
- A significant demographic segment is the Post-2000s (Gen Z/Alpha) group, representing 50% of guests.
Recommendations for Hosts
- Target domestic marketing efforts towards travelers from England and London.
- Tailor amenities and listing descriptions to appeal to the dominant Post-2000s (Gen Z/Alpha) demographic (e.g., highlight fast WiFi, smart home features, local guides).
- Highlight unique local experiences or amenities relevant to the primary guest profile.
- Consider seasonal promotions aligned with peak travel times for key origin markets.
Nearby Short-Term Rental Market Comparison
How does the Hull Airbnb market stack up against its neighbors? Compare key performance metrics like average monthly revenue, ADR, and occupancy rates in surrounding areas to understand the broader regional STR landscape.
| Market | Active Properties | Monthly Revenue | Daily Rate | Avg. Occupancy |
|---|---|---|---|---|
| Stamford Bridge | 11 | $4,828 | $418.84 | 39% |
| Grinton | 12 | $4,363 | $338.85 | 48% |
| Tollerton | 12 | $4,121 | $303.75 | 52% |
| Newholm-cum-Dunsley | 19 | $3,988 | $370.23 | 43% |
| Huntington | 19 | $3,823 | $233.48 | 53% |
| Huggate | 10 | $3,763 | $279.44 | 47% |
| Bishop Monkton | 14 | $3,719 | $310.92 | 46% |
| Burythorpe | 10 | $3,534 | $189.99 | 57% |
| Escrick | 12 | $3,496 | $327.05 | 41% |
| Aysgarth | 13 | $3,409 | $332.57 | 45% |