Gateshead Airbnb Market Analysis 2026: Short Term Rental Data & Vacation Rental Statistics in England, United Kingdom
Is Airbnb profitable in Gateshead in 2026? Explore comprehensive Airbnb analytics for Gateshead, England, United Kingdom to uncover income potential. This 2026 STR market report for Gateshead, based on AirROI data from February 2025 to January 2026, reveals key trends in the market of 251 active listings.
Whether you're considering an Airbnb investment in Gateshead, optimizing your existing vacation rental, or exploring rental arbitrage opportunities, understanding the Gateshead Airbnb data is crucial. Leveraging the low regulation environment is key to maximizing your short term rental income potential. Let's dive into the specifics.
Key Gateshead Airbnb Performance Metrics Overview
Monthly Airbnb Revenue Variations & Income Potential in Gateshead (2026)
Understanding the monthly revenue variations for Airbnb listings in Gateshead is key to maximizing your short term rental income potential. Seasonality significantly impacts earnings. Our analysis, based on data from the past 12 months, shows that the peak revenue month for STRs in Gateshead is typically July, while January often presents the lowest earnings, highlighting opportunities for strategic pricing adjustments during shoulder and low seasons. Explore the typical Airbnb income in Gateshead across different performance tiers:
- Best-in-class properties (Top 10%) achieve $4,009+ monthly, often utilizing dynamic pricing and superior guest experiences.
- Strong performing properties (Top 25%) earn $2,768 or more, indicating effective management and desirable locations/amenities.
- Typical properties (Median) generate around $1,544 per month, representing the average market performance.
- Entry-level properties (Bottom 25%) see earnings around $642, often with potential for optimization.
Average Monthly Airbnb Earnings Trend in Gateshead
Gateshead Airbnb Occupancy Rate Trends (2026)
Maximize your bookings by understanding the Gateshead STR occupancy trends. Seasonal demand shifts significantly influence how often properties are booked. Typically, Julysees the highest demand (peak season occupancy), while January experiences the lowest (low season). Effective strategies, like adjusting minimum stays or offering promotions, can boost occupancy during slower periods. Here's how different property tiers perform in Gateshead:
- Best-in-class properties (Top 10%) achieve 77%+ occupancy, indicating high desirability and potentially optimized availability.
- Strong performing properties (Top 25%) maintain 59% or higher occupancy, suggesting good market fit and guest satisfaction.
- Typical properties (Median) have an occupancy rate around 37%.
- Entry-level properties (Bottom 25%) average 17% occupancy, potentially facing higher vacancy.
Average Monthly Occupancy Rate Trend in Gateshead
Average Daily Rate (ADR) Airbnb Trends in Gateshead (2026)
Effective short term rental pricing strategy in Gateshead involves understanding monthly ADR fluctuations. The Average Daily Rate (ADR) for Airbnb in Gateshead typically peaks in August and dips lowest during March. Leveraging Airbnb dynamic pricing tools or strategies based on this seasonality can significantly boost revenue. Here's a look at the typical nightly rates achieved:
- Best-in-class properties (Top 10%) command rates of $260+ per night, often due to premium features or locations.
- Strong performing properties (Top 25%) achieve nightly rates of $188 or more.
- Typical properties (Median) charge around $139 per night.
- Entry-level properties (Bottom 25%) earn around $106 per night.
Average Daily Rate (ADR) Trend by Month in Gateshead
Get Live Gateshead Market Intelligence 👇

Explore Real-time Analytics
Airbnb Seasonality Analysis & Trends in Gateshead (2026)
Peak Season (July, August, October)
- Revenue averages $2,455 per month
- Occupancy rates average 47.6%
- Daily rates average $165
Shoulder Season
- Revenue averages $1,883 per month
- Occupancy maintains around 38.9%
- Daily rates hold near $160
Low Season (January, February, December)
- Revenue drops to average $1,556 per month
- Occupancy decreases to average 33.1%
- Daily rates adjust to average $152
Seasonality Insights for Gateshead
- The Airbnb seasonality in Gateshead shows highly seasonal trends requiring careful strategy. While the sections above show seasonal averages, it's also insightful to look at the extremes:
- During the high season, the absolute peak month showcases Gateshead's highest earning potential, with monthly revenues capable of climbing to $2,657, occupancy reaching a high of 49.9%, and ADRs peaking at $167.
- Conversely, the slowest single month of the year, typically falling within the low season, marks the market's lowest point. In this month, revenue might dip to $1,238, occupancy could drop to 26.1%, and ADRs may adjust down to $150.
- Understanding both the seasonal averages and these monthly peaks and troughs in revenue, occupancy, and ADR is crucial for maximizing your Airbnb profit potential in Gateshead.
Seasonal Strategies for Maximizing Profit
- Peak Season: Maximize revenue through premium pricing and potentially longer minimum stays. Ensure high availability.
- Low Season: Offer competitive pricing, special promotions (e.g., extended stay discounts), and flexible cancellation policies. Target off-season travelers like remote workers or budget-conscious guests.
- Shoulder Seasons: Implement dynamic pricing that balances peak and low rates. Target weekend travelers or specific events. Offer slightly more flexible terms than peak season.
- Regularly analyze your own performance against these Gateshead seasonality benchmarks and adjust your pricing and availability strategy accordingly.
Best Areas for Airbnb Investment in Gateshead (2026)
Exploring the top neighborhoods for short-term rentals in Gateshead? This section highlights key areas, outlining why they are attractive for hosts and guests, along with notable local attractions. Consider these locations based on your target guest profile and investment strategy.
| Neighborhood / Area | Why Host Here? (Target Guests & Appeal) | Key Attractions & Landmarks |
|---|---|---|
| Gateshead Quays | A vibrant area known for the iconic Sage Gateshead and BALTIC Centre for Contemporary Art. Perfect for tourists seeking culture and riverside views near Newcastle upon Tyne. | Sage Gateshead, BALTIC Centre for Contemporary Art, Gateshead Millennium Bridge, Quayside, The Angel of the North |
| Metrocentre | One of the UK's largest shopping centers, attracting shoppers and visitors from across the region. Ideal for short-term stays for retail therapy and entertainment. | Metrocentre Shopping Mall, Laser Quest, Bowling, Restaurants and cafes, Entertainment venues |
| Saltwell Park | A beautiful Victorian park with stunning gardens, a boating lake, and various recreational activities. Attracts families and nature lovers for its leisurely environment. | Saltwell Tower, Boating lake, Children's play area, Various gardens, Wildlife |
| Team Valley | A major industrial area that is home to numerous businesses, making it a convenient location for business travelers. | Businesses and offices, Retail outlets, Team Valley Trading Estate |
| Whickham | A suburb of Gateshead with a charming village atmosphere, appealing to families and those seeking a quieter stay while being close to the city. | Whickham Hermitage Community Garden, Local shops and cafes, Historic buildings, Parks |
| Low Fell | A popular residential area with easy access to Newcastle and local amenities, great for long-term stays. | Local shops and cafes, Parks, Schools and community centers |
| Eighton Banks | A quiet residential area suitable for families and visitors who want to escape the hustle and bustle, often sought after by those attending events in nearby venues. | Local parks, Hiking trails, Community events |
| Bensham | A diverse area with a strong community feel, home to various local amenities and appealing to those looking for cultural experiences in Gateshead. | Local shops, Community centers, Parks, Cultural events |
Understanding Airbnb License Requirements & STR Laws in Gateshead (2026)
While Gateshead, England, United Kingdom currently shows low STR regulations, specific Airbnb license requirements might still exist or change. Always verify the latest short term rental regulations and Airbnb license requirements directly with local government authorities for Gateshead to ensure full compliance before hosting.
(Source: AirROI data, 2026, based on 0% licensed listings)
Top Performing Airbnb Properties in Gateshead (2026)
Benchmark your potential! Explore examples of top-performing Airbnb properties in Gatesheadbased on Trailing Twelve Month (TTM) revenue. Analyze their characteristics, revenue, occupancy rate, and ADR to understand what drives success in this market.

3 Bed in Rowlands Gill (CN209)
Entire Place • 3 bedrooms

Newcastle & Durham 15 mins. Hot Tub Haven for 10
Entire Place • 5 bedrooms

moore park
Entire Place • 5 bedrooms
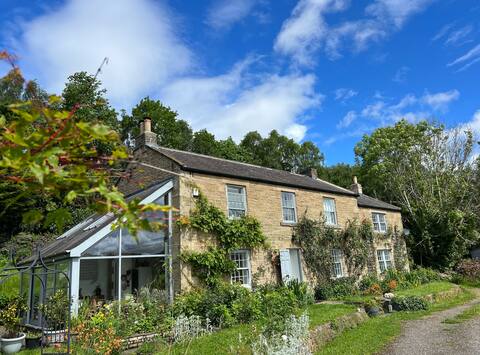
Stylish Farmhouse with Fantastic Views
Entire Place • 3 bedrooms
Chowdene Lodge Estate - 10 minutes from Newcastle.
Entire Place • 7 bedrooms

Exclusive House - 10 minutes from Newcastle
Entire Place • 4 bedrooms
Note: Performance varies based on location, size, amenities, seasonality, and management quality. Data reflects the past 12 months.
Top Performing Airbnb Hosts in Gateshead (2026)
Learn from the best! This table showcases top-performing Airbnb hosts in Gateshead based on the number of properties managed and estimated total revenue over the past year. Analyze their scale and performance metrics.
| Host Name | Properties | Grossing Revenue | Stay Reviews | Avg Rating |
|---|---|---|---|---|
| Sarah | 16 | $259,545 | 294 | 4.45/5.0 |
| Lois | 23 | $234,552 | 396 | 4.71/5.0 |
| Sacha | 4 | $169,884 | 221 | 4.93/5.0 |
| Shafiq | 5 | $168,086 | 101 | 4.49/5.0 |
| Louise | 7 | $158,958 | 175 | 4.77/5.0 |
| Derek | 3 | $139,275 | 110 | 4.97/5.0 |
| Luke Stays | 9 | $121,347 | 109 | 4.36/5.0 |
| Deborah | 4 | $112,542 | 434 | 4.95/5.0 |
| Cottages | 5 | $106,381 | 49 | 4.75/5.0 |
| Ryan-Vacant Nests | 4 | $101,989 | 89 | 4.62/5.0 |
Analyzing the strategies of top hosts, such as their property selection, pricing, and guest communication, can offer valuable lessons for optimizing your own Airbnb operations in Gateshead.
Dive Deeper: Advanced Gateshead STR Market Data (2026)
Ready to unlock more insights? AirROI provides access to advanced metrics and comprehensive Airbnb data for Gateshead. Explore detailed analytics beyond this report to refine your investment strategy, optimize pricing, and maximize your vacation rental profits.
Explore Advanced MetricsGateshead Short-Term Rental Market Composition (2026): Property & Room Types
Room Type Distribution
Property Type Distribution
Market Composition Insights for Gateshead
- The Gateshead Airbnb market composition is heavily skewed towards Entire Home/Apt listings, which make up 82.5% of the 251 active rentals. This indicates strong guest preference for privacy and space.
- Looking at the property type distribution in Gateshead, House properties are the most common (49%), reflecting the local real estate landscape.
- Houses represent a significant 49% portion, catering likely to families or larger groups.
- Smaller segments like hotel/boutique, unique stays, outdoor/unique, others (combined 5.2%) offer potential for unique stay experiences.
Gateshead Airbnb Room Capacity Analysis (2026): Bedroom Distribution
Distribution of Listings by Number of Bedrooms
Room Capacity Insights for Gateshead
- The dominant room capacity in Gateshead is 2 bedrooms listings, making up 34.7% of the market. This suggests a strong demand for properties suitable for couples or solo travelers.
- Together, 2 bedrooms and 3 bedrooms properties represent 59.0% of the active Airbnb listings in Gateshead, indicating a high concentration in these sizes.
- A significant 39.5% of listings offer 3+ bedrooms, catering to larger groups and families seeking more space in Gateshead.
Gateshead Vacation Rental Guest Capacity Trends (2026)
Distribution of Listings by Guest Capacity
Guest Capacity Insights for Gateshead
- The most common guest capacity trend in Gateshead vacation rentals is listings accommodating 4 guests (24.3%). This suggests the primary traveler segment is likely small families or groups.
- Properties designed for 4 guests and 6 guests dominate the Gateshead STR market, accounting for 39.8% of listings.
- 36.2% of properties accommodate 6+ guests, serving the market segment for larger families or group travel in Gateshead.
- On average, properties in Gateshead are equipped to host 4.4 guests.
Gateshead Airbnb Booking Patterns (2026): Available vs. Booked Days
Available Days Distribution
Booked Days Distribution
Booking Pattern Insights for Gateshead
- The most common availability pattern in Gateshead falls within the 271-366 days range, representing 49.8% of listings. This suggests many properties have significant open periods on their calendars.
- Approximately 82.5% of listings show high availability (181+ days open annually), indicating potential for increased bookings or specific owner usage patterns.
- For booked days, the 91-180 days range is most frequent in Gateshead (31.1%), reflecting common guest stay durations or potential owner blocking patterns.
- A notable 19.1% of properties secure long booking periods (181+ days booked per year), highlighting successful long-term rental strategies or significant owner usage.
Gateshead Airbnb Minimum Stay Requirements Analysis
Distribution of Listings by Minimum Night Requirement
1 Night
49 listings
19.5% of total
2 Nights
55 listings
21.9% of total
3 Nights
12 listings
4.8% of total
4-6 Nights
25 listings
10% of total
7-29 Nights
39 listings
15.5% of total
30+ Nights
71 listings
28.3% of total
Key Insights
- The most prevalent minimum stay requirement in Gateshead is 30+ Nights, adopted by 28.3% of listings. This highlights the market's preference for longer commitments.
- A significant segment (28.3%) caters to monthly stays (30+ nights) in Gateshead, pointing to opportunities in the extended-stay market.
Recommendations
- Align with the market by considering a 30+ Nights minimum stay, as 28.3% of Gateshead hosts use this setting.
- If feasible, allowing 1-night stays, especially midweek or during low season, could capture last-minute bookings, as only 19.5% currently do.
- Explore offering discounts for stays of 30+ nights to attract the 28.3% of the market seeking extended stays.
- Adjust minimum nights based on seasonality – potentially shorter during low season and longer during peak demand periods in Gateshead.
Gateshead Airbnb Cancellation Policy Trends Analysis (2026)
Limited
3 listings
1.2% of total
Super Strict 60 Days
8 listings
3.2% of total
Flexible
44 listings
17.6% of total
Moderate
73 listings
29.2% of total
Firm
54 listings
21.6% of total
Strict
68 listings
27.2% of total
Cancellation Policy Insights for Gateshead
- The prevailing Airbnb cancellation policy trend in Gateshead is Moderate, used by 29.2% of listings.
- There's a relatively balanced mix between guest-friendly (46.8%) and stricter (48.8%) policies, offering choices for different guest needs.
Recommendations for Hosts
- Consider adopting a Moderate policy to align with the 29.2% market standard in Gateshead.
- Regularly review your cancellation policy against competitors and market demand shifts in Gateshead.
Gateshead STR Booking Lead Time Analysis (2026)
Average Booking Lead Time by Month
Booking Lead Time Insights for Gateshead
- The overall average booking lead time for vacation rentals in Gateshead is 46 days.
- Guests book furthest in advance for stays during September (average 79 days), likely coinciding with peak travel demand or local events.
- The shortest booking windows occur for stays in February (average 22 days), indicating more last-minute travel plans during this time.
- Seasonally, Summer (54 days avg.) sees the longest lead times, while Winter (31 days avg.) has the shortest, reflecting typical travel planning cycles.
Recommendations for Hosts
- Use the overall average lead time (46 days) as a baseline for your pricing and availability strategy in Gateshead.
- For September stays, consider implementing length-of-stay discounts or slightly higher rates for bookings made less than 79 days out to capitalize on advance planning.
- Target marketing efforts for the Summer season well in advance (at least 54 days) to capture early planners.
- Monitor your own booking lead times against these Gateshead averages to identify opportunities for dynamic pricing adjustments.
Popular & Essential Airbnb Amenities in Gateshead (2026)
Amenity Prevalence
Amenity Insights for Gateshead
- Essential amenities in Gateshead that guests expect include: Wifi, Smoke alarm, Kitchen, Heating. Lacking these (any) could significantly impact bookings.
- Popular amenities like TV, Washer, Dishes and silverware are common but not universal. Offering these can provide a competitive edge.
Recommendations for Hosts
- Ensure your listing includes all essential amenities for Gateshead: Wifi, Smoke alarm, Kitchen, Heating.
- Prioritize adding missing essentials: Wifi, Smoke alarm, Kitchen, Heating.
- Consider adding popular differentiators like TV or Washer to increase appeal.
- Highlight unique or less common amenities you offer (e.g., hot tub, dedicated workspace, EV charger) in your listing description and photos.
- Regularly check competitor amenities in Gateshead to stay competitive.
Gateshead Airbnb Guest Demographics & Profile Analysis (2026)
Guest Profile Summary for Gateshead
- The typical guest profile for Airbnb in Gateshead consists of primarily domestic travelers (85%), often arriving from nearby England, typically belonging to the Post-2000s (Gen Z/Alpha) group (50%), primarily speaking English or French.
- Domestic travelers account for 84.8% of guests.
- Key international markets include United Kingdom (84.8%) and United States (3.9%).
- Top languages spoken are English (66.9%) followed by French (6.7%).
- A significant demographic segment is the Post-2000s (Gen Z/Alpha) group, representing 50% of guests.
Recommendations for Hosts
- Target domestic marketing efforts towards travelers from England and London.
- Tailor amenities and listing descriptions to appeal to the dominant Post-2000s (Gen Z/Alpha) demographic (e.g., highlight fast WiFi, smart home features, local guides).
- Highlight unique local experiences or amenities relevant to the primary guest profile.
- Consider seasonal promotions aligned with peak travel times for key origin markets.
Nearby Short-Term Rental Market Comparison
How does the Gateshead Airbnb market stack up against its neighbors? Compare key performance metrics like average monthly revenue, ADR, and occupancy rates in surrounding areas to understand the broader regional STR landscape.
| Market | Active Properties | Monthly Revenue | Daily Rate | Avg. Occupancy |
|---|---|---|---|---|
| Stamford Bridge | 11 | $4,828 | $418.84 | 39% |
| Cartmel Fell | 23 | $4,560 | $364.59 | 48% |
| Burneside | 10 | $4,526 | $331.60 | 54% |
| Grinton | 12 | $4,363 | $338.85 | 48% |
| Ellingham | 12 | $4,350 | $318.71 | 51% |
| Bowness-on-Windermere | 358 | $4,223 | $357.92 | 45% |
| High Newton by the Sea | 19 | $4,216 | $506.29 | 39% |
| Hayton | 16 | $4,173 | $258.03 | 57% |
| Tollerton | 12 | $4,121 | $303.75 | 52% |
| Holy Island | 14 | $4,102 | $326.39 | 58% |