Flookburgh Airbnb Market Analysis 2025: Short Term Rental Data & Vacation Rental Statistics in England, United Kingdom
Is Airbnb profitable in Flookburgh in 2025? Explore comprehensive Airbnb analytics for Flookburgh, England, United Kingdom to uncover income potential. This 2025 STR market report for Flookburgh, based on AirROI data from September 2024 to August 2025, reveals key trends in the niche market of 20 active listings.
Whether you're considering an Airbnb investment in Flookburgh, optimizing your existing vacation rental, or exploring rental arbitrage opportunities, understanding the Flookburgh Airbnb data is crucial. Leveraging the low regulation environment is key to maximizing your short term rental income potential. Let's dive into the specifics.
Key Flookburgh Airbnb Performance Metrics Overview
Monthly Airbnb Revenue Variations & Income Potential in Flookburgh (2025)
Understanding the monthly revenue variations for Airbnb listings in Flookburgh is key to maximizing your short term rental income potential. Seasonality significantly impacts earnings. Our analysis, based on data from the past 12 months, shows that the peak revenue month for STRs in Flookburgh is typically August, while November often presents the lowest earnings, highlighting opportunities for strategic pricing adjustments during shoulder and low seasons. Explore the typical Airbnb income in Flookburgh across different performance tiers:
- Best-in-class properties (Top 10%) achieve $3,694+ monthly, often utilizing dynamic pricing and superior guest experiences.
- Strong performing properties (Top 25%) earn $2,615 or more, indicating effective management and desirable locations/amenities.
- Typical properties (Median) generate around $1,804 per month, representing the average market performance.
- Entry-level properties (Bottom 25%) see earnings around $1,089, often with potential for optimization.
Average Monthly Airbnb Earnings Trend in Flookburgh
Flookburgh Airbnb Occupancy Rate Trends (2025)
Maximize your bookings by understanding the Flookburgh STR occupancy trends. Seasonal demand shifts significantly influence how often properties are booked. Typically, Augustsees the highest demand (peak season occupancy), while November experiences the lowest (low season). Effective strategies, like adjusting minimum stays or offering promotions, can boost occupancy during slower periods. Here's how different property tiers perform in Flookburgh:
- Best-in-class properties (Top 10%) achieve 76%+ occupancy, indicating high desirability and potentially optimized availability.
- Strong performing properties (Top 25%) maintain 63% or higher occupancy, suggesting good market fit and guest satisfaction.
- Typical properties (Median) have an occupancy rate around 38%.
- Entry-level properties (Bottom 25%) average 23% occupancy, potentially facing higher vacancy.
Average Monthly Occupancy Rate Trend in Flookburgh
Average Daily Rate (ADR) Airbnb Trends in Flookburgh (2025)
Effective short term rental pricing strategy in Flookburgh involves understanding monthly ADR fluctuations. The Average Daily Rate (ADR) for Airbnb in Flookburgh typically peaks in August and dips lowest during April. Leveraging Airbnb dynamic pricing tools or strategies based on this seasonality can significantly boost revenue. Here's a look at the typical nightly rates achieved:
- Best-in-class properties (Top 10%) command rates of $286+ per night, often due to premium features or locations.
- Strong performing properties (Top 25%) achieve nightly rates of $212 or more.
- Typical properties (Median) charge around $167 per night.
- Entry-level properties (Bottom 25%) earn around $130 per night.
Average Daily Rate (ADR) Trend by Month in Flookburgh
Get Live Flookburgh Market Intelligence 👇

Explore Real-time Analytics
Airbnb Seasonality Analysis & Trends in Flookburgh (2025)
Peak Season (August, January, February)
- Revenue averages $2,679 per month
- Occupancy rates average 52.6%
- Daily rates average $202
Shoulder Season
- Revenue averages $1,919 per month
- Occupancy maintains around 41.7%
- Daily rates hold near $194
Low Season (March, June, November)
- Revenue drops to average $1,583 per month
- Occupancy decreases to average 38.0%
- Daily rates adjust to average $194
Seasonality Insights for Flookburgh
- The Airbnb seasonality in Flookburgh shows highly seasonal trends requiring careful strategy. While the sections above show seasonal averages, it's also insightful to look at the extremes:
- During the high season, the absolute peak month showcases Flookburgh's highest earning potential, with monthly revenues capable of climbing to $3,517, occupancy reaching a high of 64.0%, and ADRs peaking at $209.
- Conversely, the slowest single month of the year, typically falling within the low season, marks the market's lowest point. In this month, revenue might dip to $1,314, occupancy could drop to 32.0%, and ADRs may adjust down to $177.
- Understanding both the seasonal averages and these monthly peaks and troughs in revenue, occupancy, and ADR is crucial for maximizing your Airbnb profit potential in Flookburgh.
Seasonal Strategies for Maximizing Profit
- Peak Season: Maximize revenue through premium pricing and potentially longer minimum stays. Ensure high availability.
- Low Season: Offer competitive pricing, special promotions (e.g., extended stay discounts), and flexible cancellation policies. Target off-season travelers like remote workers or budget-conscious guests.
- Shoulder Seasons: Implement dynamic pricing that balances peak and low rates. Target weekend travelers or specific events. Offer slightly more flexible terms than peak season.
- Regularly analyze your own performance against these Flookburgh seasonality benchmarks and adjust your pricing and availability strategy accordingly.
Best Areas for Airbnb Investment in Flookburgh (2025)
Exploring the top neighborhoods for short-term rentals in Flookburgh? This section highlights key areas, outlining why they are attractive for hosts and guests, along with notable local attractions. Consider these locations based on your target guest profile and investment strategy.
| Neighborhood / Area | Why Host Here? (Target Guests & Appeal) | Key Attractions & Landmarks |
|---|---|---|
| Flookburgh Village | Charming village atmosphere with local shops and pubs. Ideal for families looking for a peaceful retreat near the coast. | Cartmel Priory, Holker Hall, Flookburgh Fish & Chips, Local nature trails, Cumbrian countryside |
| Grange-over-Sands | Popular coastal town known for its lovely promenade and gardens. Attracts visitors looking for relaxation and leisure activities by the sea. | Grange Promenade, Ornamental Gardens, Local golf courses, Shopping in Grange town centre, Cumbrian Clock Tower |
| Cartmel | Historic village famous for its priory and charming streets, renowned for local food and fine dining, including the famous Sticky Toffee Pudding. | Cartmel Priory, L'Enclume restaurant, Local shops, Cartmel Racecourse, Scenic walks along the river |
| Lake Windermere | The largest lake in England, offering stunning views and a variety of outdoor activities such as boating and hiking, popular with tourists year-round. | Bowness-on-Windermere, Windermere Steamboat Museum, Boat trips on the lake, Outdoor adventure activities, Lake District National Park |
| Morecambe Bay | Coastal area with beautiful views and wildlife, a great spot for nature lovers and birdwatchers. Popular for its scenic walks and local seafood. | Morecambe Promenade, Local beaches, Wildlife watching, Fishing and boating activities, Coastal walks |
| Ulverston | Market town with a vibrant arts scene and historic buildings. Offers a mix of culture, shopping, and outdoor adventures in nearby areas. | Laurel and Hardy Museum, Ulverston Canal, Local markets, Nearby hiking trails, Ulverston Golf Club |
| Kendal | Market town with a rich history, offering shopping, dining, and access to the Lake District's hiking and outdoor activities. | Kendal Castle, Museum of Lakeland Life, Town Centre shops, Nearby hiking trails, River Kent |
| Windermere Town | Bustling town situated by Lake Windermere, providing great access to tourism opportunities and outdoor adventures, amidst beautiful scenery. | Windermere Jetty Museum, Boating activities, Local eateries and shops, Access to hiking trails, Stunning lake views |
Understanding Airbnb License Requirements & STR Laws in Flookburgh (2025)
While Flookburgh, England, United Kingdom currently shows low STR regulations, specific Airbnb license requirements might still exist or change. Always verify the latest short term rental regulations and Airbnb license requirements directly with local government authorities for Flookburgh to ensure full compliance before hosting.
(Source: AirROI data, 2025, finding no licensed listings among those analyzed)
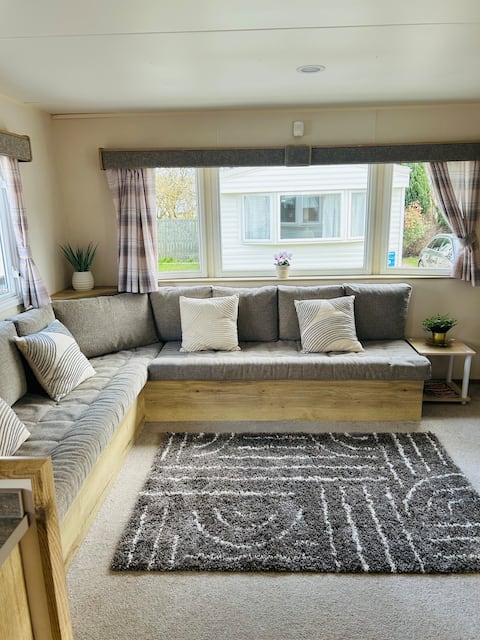
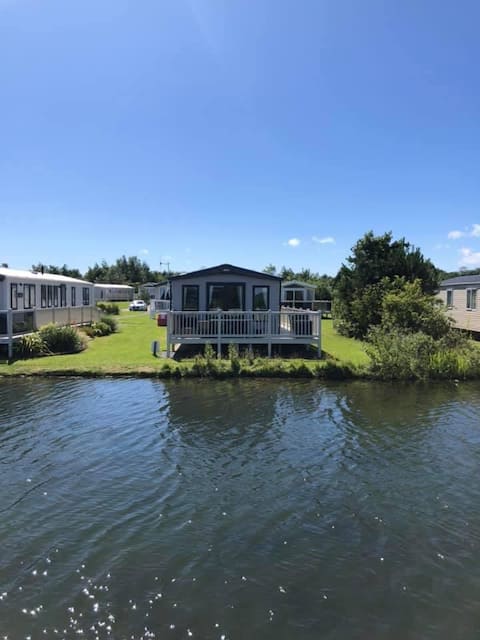
Top Performing Airbnb Properties in Flookburgh (2025)
Benchmark your potential! Explore examples of top-performing Airbnb properties in Flookburghbased on Trailing Twelve Month (TTM) revenue. Analyze their characteristics, revenue, occupancy rate, and ADR to understand what drives success in this market.

The Stopping Point- Stunning Cottage- Pet Friendly
Entire Place • 2 bedrooms

Haven hideaway
Entire Place • 2 bedrooms
Modern dog friendly holiday home in Flookburgh
Entire Place • 1 bedroom
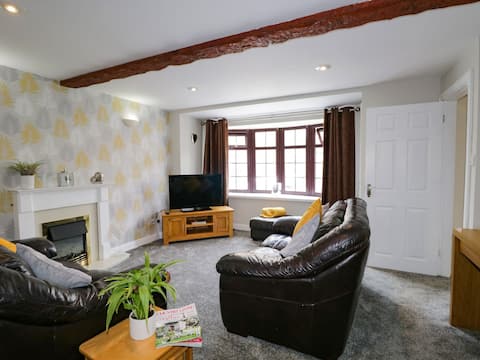
The Old Surgery
Entire Place • 3 bedrooms

Unique 3 bedroomed caravan ~Lake District~
Entire Place • 3 bedrooms
8 Guddlebeck, Flookburgh
Entire Place • 3 bedrooms
Note: Performance varies based on location, size, amenities, seasonality, and management quality. Data reflects the past 12 months.
Top Performing Airbnb Hosts in Flookburgh (2025)
Learn from the best! This table showcases top-performing Airbnb hosts in Flookburgh based on the number of properties managed and estimated total revenue over the past year. Analyze their scale and performance metrics.
| Host Name | Properties | Grossing Revenue | Stay Reviews | Avg Rating |
|---|---|---|---|---|
| Indre | 1 | $30,369 | 117 | 4.97/5.0 |
| Ashley | 1 | $29,071 | 21 | 4.67/5.0 |
| Kate | 1 | $24,775 | 56 | 4.63/5.0 |
| Paul | 1 | $22,862 | 167 | 4.71/5.0 |
| Samson | 1 | $21,230 | 38 | 4.84/5.0 |
| Carolyn | 1 | $20,173 | 10 | 5.00/5.0 |
| Michelle | 1 | $18,370 | 9 | 4.44/5.0 |
| Michael | 1 | $16,848 | 12 | 4.92/5.0 |
| Jeanette | 1 | $14,171 | 17 | 4.76/5.0 |
| Samantha | 1 | $13,644 | 2 | Not Rated |
Analyzing the strategies of top hosts, such as their property selection, pricing, and guest communication, can offer valuable lessons for optimizing your own Airbnb operations in Flookburgh.
Dive Deeper: Advanced Flookburgh STR Market Data (2025)
Ready to unlock more insights? AirROI provides access to advanced metrics and comprehensive Airbnb data for Flookburgh. Explore detailed analytics beyond this report to refine your investment strategy, optimize pricing, and maximize your vacation rental profits.
Explore Advanced MetricsFlookburgh Short-Term Rental Market Composition (2025): Property & Room Types
Room Type Distribution
Property Type Distribution
Market Composition Insights for Flookburgh
- The Flookburgh Airbnb market composition is heavily skewed towards Entire Home/Apt listings, which make up 100% of the 20 active rentals. This indicates strong guest preference for privacy and space.
- Looking at the property type distribution in Flookburgh, House properties are the most common (45%), reflecting the local real estate landscape.
- Houses represent a significant 45% portion, catering likely to families or larger groups.
Flookburgh Airbnb Room Capacity Analysis (2025): Bedroom Distribution
Distribution of Listings by Number of Bedrooms
Room Capacity Insights for Flookburgh
- The dominant room capacity in Flookburgh is 3 bedrooms listings, making up 50% of the market. This suggests a strong demand for properties suitable for families or small groups.
- Together, 3 bedrooms and 2 bedrooms properties represent 85.0% of the active Airbnb listings in Flookburgh, indicating a high concentration in these sizes.
- A significant 50.0% of listings offer 3+ bedrooms, catering to larger groups and families seeking more space in Flookburgh.
Flookburgh Vacation Rental Guest Capacity Trends (2025)
Distribution of Listings by Guest Capacity
Guest Capacity Insights for Flookburgh
- The most common guest capacity trend in Flookburgh vacation rentals is listings accommodating 6 guests (40%). This suggests the primary traveler segment is likely larger groups.
- Properties designed for 6 guests and 4 guests dominate the Flookburgh STR market, accounting for 60.0% of listings.
- 65.0% of properties accommodate 6+ guests, serving the market segment for larger families or group travel in Flookburgh.
- On average, properties in Flookburgh are equipped to host 5.6 guests.
Flookburgh Airbnb Booking Patterns (2025): Available vs. Booked Days
Available Days Distribution
Booked Days Distribution
Booking Pattern Insights for Flookburgh
- The most common availability pattern in Flookburgh falls within the 271-366 days range, representing 50% of listings. This suggests many properties have significant open periods on their calendars.
- Approximately 90.0% of listings show high availability (181+ days open annually), indicating potential for increased bookings or specific owner usage patterns.
- For booked days, the 91-180 days range is most frequent in Flookburgh (40%), reflecting common guest stay durations or potential owner blocking patterns.
- A notable 10.0% of properties secure long booking periods (181+ days booked per year), highlighting successful long-term rental strategies or significant owner usage.
Flookburgh Airbnb Minimum Stay Requirements Analysis
Distribution of Listings by Minimum Night Requirement
1 Night
5 listings
26.3% of total
2 Nights
4 listings
21.1% of total
3 Nights
4 listings
21.1% of total
4-6 Nights
1 listings
5.3% of total
30+ Nights
5 listings
26.3% of total
Key Insights
- The most prevalent minimum stay requirement in Flookburgh is 1 Night, adopted by 26.3% of listings. This highlights the market's preference for shorter, flexible bookings.
- A significant segment (26.3%) caters to monthly stays (30+ nights) in Flookburgh, pointing to opportunities in the extended-stay market.
Recommendations
- Align with the market by considering a 1 Night minimum stay, as 26.3% of Flookburgh hosts use this setting.
- If feasible, allowing 1-night stays, especially midweek or during low season, could capture last-minute bookings, as only 26.3% currently do.
- Explore offering discounts for stays of 30+ nights to attract the 26.3% of the market seeking extended stays.
- Adjust minimum nights based on seasonality – potentially shorter during low season and longer during peak demand periods in Flookburgh.
Flookburgh Airbnb Cancellation Policy Trends Analysis (2025)
Super Strict 60 Days
1 listings
5.6% of total
Flexible
6 listings
33.3% of total
Moderate
3 listings
16.7% of total
Firm
4 listings
22.2% of total
Strict
4 listings
22.2% of total
Cancellation Policy Insights for Flookburgh
- The prevailing Airbnb cancellation policy trend in Flookburgh is Flexible, used by 33.3% of listings.
- There's a relatively balanced mix between guest-friendly (50.0%) and stricter (44.4%) policies, offering choices for different guest needs.
Recommendations for Hosts
- Consider adopting a Flexible policy to align with the 33.3% market standard in Flookburgh.
- Regularly review your cancellation policy against competitors and market demand shifts in Flookburgh.
Flookburgh STR Booking Lead Time Analysis (2025)
Average Booking Lead Time by Month
Booking Lead Time Insights for Flookburgh
- The overall average booking lead time for vacation rentals in Flookburgh is 41 days.
- Guests book furthest in advance for stays during February (average 92 days), likely coinciding with peak travel demand or local events.
- The shortest booking windows occur for stays in September (average 27 days), indicating more last-minute travel plans during this time.
- Seasonally, Winter (58 days avg.) sees the longest lead times, while Fall (32 days avg.) has the shortest, reflecting typical travel planning cycles.
Recommendations for Hosts
- Use the overall average lead time (41 days) as a baseline for your pricing and availability strategy in Flookburgh.
- For February stays, consider implementing length-of-stay discounts or slightly higher rates for bookings made less than 92 days out to capitalize on advance planning.
- Target marketing efforts for the Winter season well in advance (at least 58 days) to capture early planners.
- Monitor your own booking lead times against these Flookburgh averages to identify opportunities for dynamic pricing adjustments.
Popular & Essential Airbnb Amenities in Flookburgh (2025)
Amenity Prevalence
Amenity Insights for Flookburgh
- Essential amenities in Flookburgh that guests expect include: TV, Kitchen, Smoke alarm. Lacking these (any) could significantly impact bookings.
- Popular amenities like Carbon monoxide alarm, Heating, Free parking on premises are common but not universal. Offering these can provide a competitive edge.
Recommendations for Hosts
- Ensure your listing includes all essential amenities for Flookburgh: TV, Kitchen, Smoke alarm.
- Prioritize adding missing essentials: Kitchen, Smoke alarm.
- Consider adding popular differentiators like Carbon monoxide alarm or Heating to increase appeal.
- Highlight unique or less common amenities you offer (e.g., hot tub, dedicated workspace, EV charger) in your listing description and photos.
- Regularly check competitor amenities in Flookburgh to stay competitive.
Flookburgh Airbnb Guest Demographics & Profile Analysis (2025)
Guest Profile Summary for Flookburgh
- The typical guest profile for Airbnb in Flookburgh consists of primarily domestic travelers (94%), often arriving from nearby England, typically belonging to the Post-2000s (Gen Z/Alpha) group (50%), primarily speaking English or German.
- Domestic travelers account for 94.3% of guests.
- Key international markets include United Kingdom (94.3%) and United States (1.9%).
- Top languages spoken are English (75.5%) followed by German (6.1%).
- A significant demographic segment is the Post-2000s (Gen Z/Alpha) group, representing 50% of guests.
Recommendations for Hosts
- Target domestic marketing efforts towards travelers from England and London.
- Tailor amenities and listing descriptions to appeal to the dominant Post-2000s (Gen Z/Alpha) demographic (e.g., highlight fast WiFi, smart home features, local guides).
- Highlight unique local experiences or amenities relevant to the primary guest profile.
- Consider seasonal promotions aligned with peak travel times for key origin markets.
Nearby Short-Term Rental Market Comparison
How does the Flookburgh Airbnb market stack up against its neighbors? Compare key performance metrics like average monthly revenue, ADR, and occupancy rates in surrounding areas to understand the broader regional STR landscape.
| Market | Active Properties | Monthly Revenue | Daily Rate | Avg. Occupancy |
|---|---|---|---|---|
| Bishop Monkton | 11 | $5,103 | $302.08 | 51% |
| Llanbedr Dyffryn Clwyd | 10 | $4,884 | $437.51 | 27% |
| Buttermere | 13 | $4,763 | $437.69 | 54% |
| Dalkeith | 10 | $4,575 | $466.79 | 56% |
| Grinton | 13 | $4,493 | $340.46 | 47% |
| High Newton by the Sea | 19 | $4,311 | $497.78 | 38% |
| City of Edinburgh | 4,572 | $4,302 | $286.62 | 58% |
| Ellingham | 12 | $4,251 | $270.46 | 62% |
| Kettlewell | 19 | $4,192 | $383.78 | 44% |
| Carlton | 10 | $4,036 | $372.31 | 43% |