Finsthwaite Airbnb Market Analysis 2026: Short Term Rental Data & Vacation Rental Statistics in England, United Kingdom
Is Airbnb profitable in Finsthwaite in 2026? Explore comprehensive Airbnb analytics for Finsthwaite, England, United Kingdom to uncover income potential. This 2026 STR market report for Finsthwaite, based on AirROI data from February 2025 to January 2026, reveals key trends in the niche market of 20 active listings.
Whether you're considering an Airbnb investment in Finsthwaite, optimizing your existing vacation rental, or exploring rental arbitrage opportunities, understanding the Finsthwaite Airbnb data is crucial. Leveraging the low regulation environment is key to maximizing your short term rental income potential. Let's dive into the specifics.
Key Finsthwaite Airbnb Performance Metrics Overview
Monthly Airbnb Revenue Variations & Income Potential in Finsthwaite (2026)
Understanding the monthly revenue variations for Airbnb listings in Finsthwaite is key to maximizing your short term rental income potential. Seasonality significantly impacts earnings. Our analysis, based on data from the past 12 months, shows that the peak revenue month for STRs in Finsthwaite is typically May, while January often presents the lowest earnings, highlighting opportunities for strategic pricing adjustments during shoulder and low seasons. Explore the typical Airbnb income in Finsthwaite across different performance tiers:
- Best-in-class properties (Top 10%) achieve $13,745+ monthly, often utilizing dynamic pricing and superior guest experiences.
- Strong performing properties (Top 25%) earn $7,237 or more, indicating effective management and desirable locations/amenities.
- Typical properties (Median) generate around $2,686 per month, representing the average market performance.
- Entry-level properties (Bottom 25%) see earnings around $1,281, often with potential for optimization.
Average Monthly Airbnb Earnings Trend in Finsthwaite
Finsthwaite Airbnb Occupancy Rate Trends (2026)
Maximize your bookings by understanding the Finsthwaite STR occupancy trends. Seasonal demand shifts significantly influence how often properties are booked. Typically, Augustsees the highest demand (peak season occupancy), while January experiences the lowest (low season). Effective strategies, like adjusting minimum stays or offering promotions, can boost occupancy during slower periods. Here's how different property tiers perform in Finsthwaite:
- Best-in-class properties (Top 10%) achieve 79%+ occupancy, indicating high desirability and potentially optimized availability.
- Strong performing properties (Top 25%) maintain 51% or higher occupancy, suggesting good market fit and guest satisfaction.
- Typical properties (Median) have an occupancy rate around 24%.
- Entry-level properties (Bottom 25%) average 13% occupancy, potentially facing higher vacancy.
Average Monthly Occupancy Rate Trend in Finsthwaite
Average Daily Rate (ADR) Airbnb Trends in Finsthwaite (2026)
Effective short term rental pricing strategy in Finsthwaite involves understanding monthly ADR fluctuations. The Average Daily Rate (ADR) for Airbnb in Finsthwaite typically peaks in July and dips lowest during March. Leveraging Airbnb dynamic pricing tools or strategies based on this seasonality can significantly boost revenue. Here's a look at the typical nightly rates achieved:
- Best-in-class properties (Top 10%) command rates of $621+ per night, often due to premium features or locations.
- Strong performing properties (Top 25%) achieve nightly rates of $548 or more.
- Typical properties (Median) charge around $383 per night.
- Entry-level properties (Bottom 25%) earn around $301 per night.
Average Daily Rate (ADR) Trend by Month in Finsthwaite
Get Live Finsthwaite Market Intelligence 👇

Explore Real-time Analytics
Airbnb Seasonality Analysis & Trends in Finsthwaite (2026)
Peak Season (May, April, August)
- Revenue averages $6,216 per month
- Occupancy rates average 41.3%
- Daily rates average $425
Shoulder Season
- Revenue averages $5,269 per month
- Occupancy maintains around 36.4%
- Daily rates hold near $417
Low Season (January, February, June)
- Revenue drops to average $4,008 per month
- Occupancy decreases to average 28.6%
- Daily rates adjust to average $402
Seasonality Insights for Finsthwaite
- The Airbnb seasonality in Finsthwaite shows moderate seasonality with distinct peak and low periods. While the sections above show seasonal averages, it's also insightful to look at the extremes:
- During the high season, the absolute peak month showcases Finsthwaite's highest earning potential, with monthly revenues capable of climbing to $6,563, occupancy reaching a high of 43.4%, and ADRs peaking at $457.
- Conversely, the slowest single month of the year, typically falling within the low season, marks the market's lowest point. In this month, revenue might dip to $3,366, occupancy could drop to 24.6%, and ADRs may adjust down to $370.
- Understanding both the seasonal averages and these monthly peaks and troughs in revenue, occupancy, and ADR is crucial for maximizing your Airbnb profit potential in Finsthwaite.
Seasonal Strategies for Maximizing Profit
- Peak Season: Maximize revenue through premium pricing and potentially longer minimum stays. Ensure high availability.
- Low Season: Offer competitive pricing, special promotions (e.g., extended stay discounts), and flexible cancellation policies. Target off-season travelers like remote workers or budget-conscious guests.
- Shoulder Seasons: Implement dynamic pricing that balances peak and low rates. Target weekend travelers or specific events. Offer slightly more flexible terms than peak season.
- Regularly analyze your own performance against these Finsthwaite seasonality benchmarks and adjust your pricing and availability strategy accordingly.
Best Areas for Airbnb Investment in Finsthwaite (2026)
Exploring the top neighborhoods for short-term rentals in Finsthwaite? This section highlights key areas, outlining why they are attractive for hosts and guests, along with notable local attractions. Consider these locations based on your target guest profile and investment strategy.
| Neighborhood / Area | Why Host Here? (Target Guests & Appeal) | Key Attractions & Landmarks |
|---|---|---|
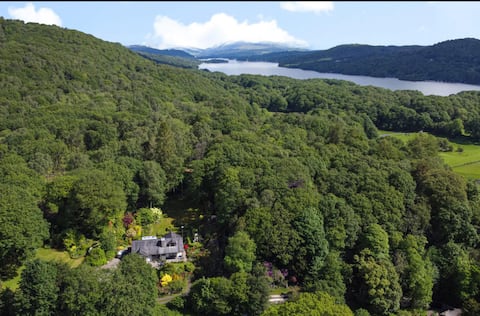
| Finsthwaite Village | A picturesque village located near Lake Windermere, ideal for visitors seeking rural charm and easy access to outdoor activities such as hiking and boating. | Lake Windermere, Finsthwaite's ancient church, Lakeside and Haverthwaite Railway, Walking trails, Wildlife watching |
| Grizedale Forest | A beautiful forest area that attracts nature lovers and adventure enthusiasts. The numerous trails and sculptures make it a fantastic spot for outdoor recreation. | Grizedale Forest Park, Cycle trails, Art installations, Sculpture trails, Wildlife spotting |
| Bowness-on-Windermere | A vibrant town on the shores of Lake Windermere, known for its shops, restaurants, and proximity to lake activities. Great for families and tourists. | Lake Windermere cruises, The World of Beatrix Potter, Bowness Bay, Restaurants and cafes, Shopping |
| Windermere | A neighboring town to Bowness, Windermere offers a mix of lake activities and access to hiking trails. It's a hub for tourists visiting the Lake District. | Windermere Lake Cruises, Orrest Head viewpoint, Hiking trails, Local shops, Pubs and restaurants |
| Coniston Water | Famous for its scenic beauty and watersports, this location is perfect for visitors wanting a peaceful yet active retreat. | Coniston Water, Boating and kayaking, The Old Man of Coniston, Ruskin Museum, Walking paths |
| Ambleside | A bustling market town that serves as a gateway to the Lake District, offering shops, restaurants, and access to hiking trails. | Stock Ghyll Force waterfall, Ambleside Pier, Lake District information centre, Local shops, Hiking trails |
| Ulverston | A historical market town with a rich history and cultural attractions. It's a short drive from Windermere, making it a great base. | Laurel and Hardy Museum, Ulverston Canal, Ford Park, Local festivals, Shopping |
| Kendal | Known as the Gateway to the Lake District, Kendal has historical significance and offers a range of attractions for visitors, including shops and eateries. | Kendal Castle, The Brewery Arts Centre, Shopping, Walking trails, Local market |
Understanding Airbnb License Requirements & STR Laws in Finsthwaite (2026)
While Finsthwaite, England, United Kingdom currently shows low STR regulations, specific Airbnb license requirements might still exist or change. Always verify the latest short term rental regulations and Airbnb license requirements directly with local government authorities for Finsthwaite to ensure full compliance before hosting.
(Source: AirROI data, 2026, based on 5% licensed listings)
Top Performing Airbnb Properties in Finsthwaite (2026)
Benchmark your potential! Explore examples of top-performing Airbnb properties in Finsthwaitebased on Trailing Twelve Month (TTM) revenue. Analyze their characteristics, revenue, occupancy rate, and ADR to understand what drives success in this market.
Lake stars garden bath private forest 5acres relax
Entire Place • 5 bedrooms
July Flowertree Barn - Near Lakeside Windermere
Entire Place • 4 bedrooms
3 Bed in Lakeside (94925)
Entire Place • 3 bedrooms
4 Bed in Finsthwaite (SZ438)
Entire Place • 4 bedrooms

2 Bed in Lakeside (94926)
Entire Place • 2 bedrooms

Riverside Retreat - Apartment with superb views
Entire Place • 2 bedrooms
Note: Performance varies based on location, size, amenities, seasonality, and management quality. Data reflects the past 12 months.
Top Performing Airbnb Hosts in Finsthwaite (2026)
Learn from the best! This table showcases top-performing Airbnb hosts in Finsthwaite based on the number of properties managed and estimated total revenue over the past year. Analyze their scale and performance metrics.
| Host Name | Properties | Grossing Revenue | Stay Reviews | Avg Rating |
|---|---|---|---|---|
| Joel | 1 | $209,095 | 40 | 4.98/5.0 |
| Holidaycottages.Co.Uk | 2 | $160,676 | 11 | 4.18/5.0 |
| Lucy | 1 | $110,675 | 23 | 5.00/5.0 |
| Holidaycottages.Co.Uk | 1 | $78,340 | 3 | 5.00/5.0 |
| Alison | 2 | $58,901 | 109 | 4.88/5.0 |
| Herdwick Cottages | 3 | $54,251 | 90 | 4.80/5.0 |
| Andrew | 1 | $48,505 | 17 | 4.88/5.0 |
| Michael | 1 | $32,080 | 75 | 4.80/5.0 |
| Sykes Holiday Cottages | 3 | $30,987 | 21 | 4.89/5.0 |
| Helena | 2 | $23,413 | 176 | 4.66/5.0 |
Analyzing the strategies of top hosts, such as their property selection, pricing, and guest communication, can offer valuable lessons for optimizing your own Airbnb operations in Finsthwaite.
Dive Deeper: Advanced Finsthwaite STR Market Data (2026)
Ready to unlock more insights? AirROI provides access to advanced metrics and comprehensive Airbnb data for Finsthwaite. Explore detailed analytics beyond this report to refine your investment strategy, optimize pricing, and maximize your vacation rental profits.
Explore Advanced MetricsFinsthwaite Short-Term Rental Market Composition (2026): Property & Room Types
Room Type Distribution
Property Type Distribution
Market Composition Insights for Finsthwaite
- The Finsthwaite Airbnb market composition is heavily skewed towards Entire Home/Apt listings, which make up 100% of the 20 active rentals. This indicates strong guest preference for privacy and space.
- Looking at the property type distribution in Finsthwaite, House properties are the most common (70%), reflecting the local real estate landscape.
- Houses represent a significant 70% portion, catering likely to families or larger groups.
Finsthwaite Airbnb Room Capacity Analysis (2026): Bedroom Distribution
Distribution of Listings by Number of Bedrooms
Room Capacity Insights for Finsthwaite
- The dominant room capacity in Finsthwaite is 2 bedrooms listings, making up 35% of the market. This suggests a strong demand for properties suitable for couples or solo travelers.
- Together, 2 bedrooms and 4 bedrooms properties represent 60.0% of the active Airbnb listings in Finsthwaite, indicating a high concentration in these sizes.
- A significant 50.0% of listings offer 3+ bedrooms, catering to larger groups and families seeking more space in Finsthwaite.
Finsthwaite Vacation Rental Guest Capacity Trends (2026)
Distribution of Listings by Guest Capacity
Guest Capacity Insights for Finsthwaite
- The most common guest capacity trend in Finsthwaite vacation rentals is listings accommodating 8+ guests (30%). This suggests the primary traveler segment is likely larger groups.
- Properties designed for 8+ guests and 4 guests dominate the Finsthwaite STR market, accounting for 60.0% of listings.
- 45.0% of properties accommodate 6+ guests, serving the market segment for larger families or group travel in Finsthwaite.
- On average, properties in Finsthwaite are equipped to host 5.2 guests.
Finsthwaite Airbnb Booking Patterns (2026): Available vs. Booked Days
Available Days Distribution
Booked Days Distribution
Booking Pattern Insights for Finsthwaite
- The most common availability pattern in Finsthwaite falls within the 271-366 days range, representing 60% of listings. This suggests many properties have significant open periods on their calendars.
- Approximately 90.0% of listings show high availability (181+ days open annually), indicating potential for increased bookings or specific owner usage patterns.
- For booked days, the 91-180 days range is most frequent in Finsthwaite (35%), reflecting common guest stay durations or potential owner blocking patterns.
- A notable 10.0% of properties secure long booking periods (181+ days booked per year), highlighting successful long-term rental strategies or significant owner usage.
Finsthwaite Airbnb Minimum Stay Requirements Analysis
Distribution of Listings by Minimum Night Requirement
1 Night
1 listings
5% of total
2 Nights
3 listings
15% of total
3 Nights
5 listings
25% of total
4-6 Nights
1 listings
5% of total
30+ Nights
10 listings
50% of total
Key Insights
- The most prevalent minimum stay requirement in Finsthwaite is 30+ Nights, adopted by 50% of listings. This highlights the market's preference for longer commitments.
- A significant segment (50%) caters to monthly stays (30+ nights) in Finsthwaite, pointing to opportunities in the extended-stay market.
Recommendations
- Align with the market by considering a 30+ Nights minimum stay, as 50% of Finsthwaite hosts use this setting.
- If feasible, allowing 1-night stays, especially midweek or during low season, could capture last-minute bookings, as only 5% currently do.
- Explore offering discounts for stays of 30+ nights to attract the 50% of the market seeking extended stays.
- Adjust minimum nights based on seasonality – potentially shorter during low season and longer during peak demand periods in Finsthwaite.
Finsthwaite Airbnb Cancellation Policy Trends Analysis (2026)
Super Strict 60 Days
11 listings
55% of total
Flexible
1 listings
5% of total
Moderate
2 listings
10% of total
Firm
6 listings
30% of total
Cancellation Policy Insights for Finsthwaite
- The prevailing Airbnb cancellation policy trend in Finsthwaite is Super Strict 60 Days, used by 55% of listings.
- There's a relatively balanced mix between guest-friendly (15.0%) and stricter (30.0%) policies, offering choices for different guest needs.
Recommendations for Hosts
- Consider adopting a Super Strict 60 Days policy to align with the 55% market standard in Finsthwaite.
- Regularly review your cancellation policy against competitors and market demand shifts in Finsthwaite.
Finsthwaite STR Booking Lead Time Analysis (2026)
Average Booking Lead Time by Month
Booking Lead Time Insights for Finsthwaite
- The overall average booking lead time for vacation rentals in Finsthwaite is 59 days.
- Guests book furthest in advance for stays during May (average 88 days), likely coinciding with peak travel demand or local events.
- The shortest booking windows occur for stays in November (average 30 days), indicating more last-minute travel plans during this time.
- Seasonally, Summer (64 days avg.) sees the longest lead times, while Winter (48 days avg.) has the shortest, reflecting typical travel planning cycles.
Recommendations for Hosts
- Use the overall average lead time (59 days) as a baseline for your pricing and availability strategy in Finsthwaite.
- For May stays, consider implementing length-of-stay discounts or slightly higher rates for bookings made less than 88 days out to capitalize on advance planning.
- Target marketing efforts for the Summer season well in advance (at least 64 days) to capture early planners.
- Monitor your own booking lead times against these Finsthwaite averages to identify opportunities for dynamic pricing adjustments.
Popular & Essential Airbnb Amenities in Finsthwaite (2026)
Amenity Prevalence
Amenity Insights for Finsthwaite
- Essential amenities in Finsthwaite that guests expect include: Kitchen, Smoke alarm, Dishes and silverware, Refrigerator, Heating, TV, Carbon monoxide alarm, Wifi. Lacking these (any) could significantly impact bookings.
- Popular amenities like Dishwasher, Hot water are common but not universal. Offering these can provide a competitive edge.
Recommendations for Hosts
- Ensure your listing includes all essential amenities for Finsthwaite: Kitchen, Smoke alarm, Dishes and silverware, Refrigerator, Heating, TV, Carbon monoxide alarm, Wifi.
- Prioritize adding missing essentials: Carbon monoxide alarm, Wifi.
- Consider adding popular differentiators like Dishwasher or Hot water to increase appeal.
- Highlight unique or less common amenities you offer (e.g., hot tub, dedicated workspace, EV charger) in your listing description and photos.
- Regularly check competitor amenities in Finsthwaite to stay competitive.
Finsthwaite Airbnb Guest Demographics & Profile Analysis (2026)
Guest Profile Summary for Finsthwaite
- The typical guest profile for Airbnb in Finsthwaite consists of primarily domestic travelers (90%), often arriving from nearby England, typically belonging to the Post-2000s (Gen Z/Alpha) group (50%), primarily speaking English or French.
- Domestic travelers account for 89.9% of guests.
- Key international markets include United Kingdom (89.9%) and Netherlands (2.2%).
- Top languages spoken are English (66.7%) followed by French (9.1%).
- A significant demographic segment is the Post-2000s (Gen Z/Alpha) group, representing 50% of guests.
Recommendations for Hosts
- Target domestic marketing efforts towards travelers from England and London.
- Tailor amenities and listing descriptions to appeal to the dominant Post-2000s (Gen Z/Alpha) demographic (e.g., highlight fast WiFi, smart home features, local guides).
- Highlight unique local experiences or amenities relevant to the primary guest profile.
- Consider seasonal promotions aligned with peak travel times for key origin markets.
Nearby Short-Term Rental Market Comparison
How does the Finsthwaite Airbnb market stack up against its neighbors? Compare key performance metrics like average monthly revenue, ADR, and occupancy rates in surrounding areas to understand the broader regional STR landscape.
| Market | Active Properties | Monthly Revenue | Daily Rate | Avg. Occupancy |
|---|---|---|---|---|
| Dalkeith | 10 | $5,775 | $478.16 | 55% |
| Buttermere | 14 | $4,802 | $415.13 | 49% |
| Llanbedr Dyffryn Clwyd | 10 | $4,746 | $463.17 | 38% |
| City of Edinburgh | 4,083 | $4,617 | $289.88 | 60% |
| Cartmel Fell | 23 | $4,560 | $364.59 | 48% |
| Burneside | 10 | $4,526 | $331.60 | 54% |
| Grinton | 12 | $4,363 | $338.85 | 48% |
| Ellingham | 12 | $4,350 | $318.71 | 51% |
| Bowness-on-Windermere | 358 | $4,223 | $357.92 | 45% |
| Rowen | 26 | $4,220 | $376.11 | 46% |