East Sussex Airbnb Market Analysis 2026: Short Term Rental Data & Vacation Rental Statistics in England, United Kingdom
Is Airbnb profitable in East Sussex in 2026? Explore comprehensive Airbnb analytics for East Sussex, England, United Kingdom to uncover income potential. This 2026 STR market report for East Sussex, based on AirROI data from February 2025 to January 2026, reveals key trends in the niche market of 102 active listings.
Whether you're considering an Airbnb investment in East Sussex, optimizing your existing vacation rental, or exploring rental arbitrage opportunities, understanding the East Sussex Airbnb data is crucial. Leveraging the low regulation environment is key to maximizing your short term rental income potential. Let's dive into the specifics.
Key East Sussex Airbnb Performance Metrics Overview
Monthly Airbnb Revenue Variations & Income Potential in East Sussex (2026)
Understanding the monthly revenue variations for Airbnb listings in East Sussex is key to maximizing your short term rental income potential. Seasonality significantly impacts earnings. Our analysis, based on data from the past 12 months, shows that the peak revenue month for STRs in East Sussex is typically August, while May often presents the lowest earnings, highlighting opportunities for strategic pricing adjustments during shoulder and low seasons. Explore the typical Airbnb income in East Sussex across different performance tiers:
- Best-in-class properties (Top 10%) achieve $5,145+ monthly, often utilizing dynamic pricing and superior guest experiences.
- Strong performing properties (Top 25%) earn $3,060 or more, indicating effective management and desirable locations/amenities.
- Typical properties (Median) generate around $1,847 per month, representing the average market performance.
- Entry-level properties (Bottom 25%) see earnings around $843, often with potential for optimization.
Average Monthly Airbnb Earnings Trend in East Sussex
East Sussex Airbnb Occupancy Rate Trends (2026)
Maximize your bookings by understanding the East Sussex STR occupancy trends. Seasonal demand shifts significantly influence how often properties are booked. Typically, Augustsees the highest demand (peak season occupancy), while May experiences the lowest (low season). Effective strategies, like adjusting minimum stays or offering promotions, can boost occupancy during slower periods. Here's how different property tiers perform in East Sussex:
- Best-in-class properties (Top 10%) achieve 67%+ occupancy, indicating high desirability and potentially optimized availability.
- Strong performing properties (Top 25%) maintain 54% or higher occupancy, suggesting good market fit and guest satisfaction.
- Typical properties (Median) have an occupancy rate around 36%.
- Entry-level properties (Bottom 25%) average 19% occupancy, potentially facing higher vacancy.
Average Monthly Occupancy Rate Trend in East Sussex
Average Daily Rate (ADR) Airbnb Trends in East Sussex (2026)
Effective short term rental pricing strategy in East Sussex involves understanding monthly ADR fluctuations. The Average Daily Rate (ADR) for Airbnb in East Sussex typically peaks in October and dips lowest during August. Leveraging Airbnb dynamic pricing tools or strategies based on this seasonality can significantly boost revenue. Here's a look at the typical nightly rates achieved:
- Best-in-class properties (Top 10%) command rates of $428+ per night, often due to premium features or locations.
- Strong performing properties (Top 25%) achieve nightly rates of $231 or more.
- Typical properties (Median) charge around $150 per night.
- Entry-level properties (Bottom 25%) earn around $104 per night.
Average Daily Rate (ADR) Trend by Month in East Sussex
Get Live East Sussex Market Intelligence 👇
Explore Real-time Analytics
Airbnb Seasonality Analysis & Trends in East Sussex (2026)
Peak Season (August, September, October)
- Revenue averages $3,018 per month
- Occupancy rates average 45.5%
- Daily rates average $200
Shoulder Season
- Revenue averages $2,072 per month
- Occupancy maintains around 33.7%
- Daily rates hold near $200
Low Season (February, March, April)
- Revenue drops to average $0 per month
- Occupancy decreases to average 0.0%
- Daily rates adjust to average $197
Seasonality Insights for East Sussex
- The Airbnb seasonality in East Sussex shows highly seasonal trends requiring careful strategy. While the sections above show seasonal averages, it's also insightful to look at the extremes:
- During the high season, the absolute peak month showcases East Sussex's highest earning potential, with monthly revenues capable of climbing to $3,275, occupancy reaching a high of 52.1%, and ADRs peaking at $207.
- Conversely, the slowest single month of the year, typically falling within the low season, marks the market's lowest point. In this month, revenue might dip to $0, occupancy could drop to 0.0%, and ADRs may adjust down to $193.
- Understanding both the seasonal averages and these monthly peaks and troughs in revenue, occupancy, and ADR is crucial for maximizing your Airbnb profit potential in East Sussex.
Seasonal Strategies for Maximizing Profit
- Peak Season: Maximize revenue through premium pricing and potentially longer minimum stays. Ensure high availability.
- Low Season: Offer competitive pricing, special promotions (e.g., extended stay discounts), and flexible cancellation policies. Target off-season travelers like remote workers or budget-conscious guests.
- Shoulder Seasons: Implement dynamic pricing that balances peak and low rates. Target weekend travelers or specific events. Offer slightly more flexible terms than peak season.
- Regularly analyze your own performance against these East Sussex seasonality benchmarks and adjust your pricing and availability strategy accordingly.
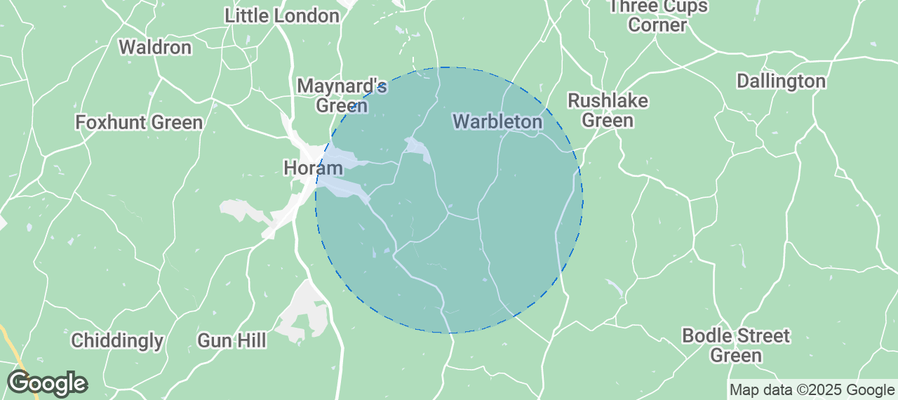
Best Areas for Airbnb Investment in East Sussex (2026)
Exploring the top neighborhoods for short-term rentals in East Sussex? This section highlights key areas, outlining why they are attractive for hosts and guests, along with notable local attractions. Consider these locations based on your target guest profile and investment strategy.
| Neighborhood / Area | Why Host Here? (Target Guests & Appeal) | Key Attractions & Landmarks |
|---|---|---|
| Brighton | Vibrant seaside city famous for its Pier, lively nightlife, and cultural attractions. A top destination for tourists looking for a beach vacation with plenty of entertainment options. | Brighton Pier, Royal Pavilion, British Airways i360, Brighton Beach, Lanes Shopping Area, Victoria Gardens |
| Eastbourne | A traditional seaside resort known for its beautiful coastline and Victorian architecture. Attracts visitors seeking a relaxing beach holiday combined with scenic views. | Eastbourne Pier, Beachy Head, Towner Art Gallery, Eastbourne Marina, Beachy Head Lighthouse, Devonshire Park Theatre |
| Hastings | A historic coastal town with a rich maritime history and vibrant arts scene. Popular with tourists interested in history and culture, along with its unique beaches. | Hastings Old Town, Battle of Hastings Site, Hastings Castle, Hastings Pier, Jerwood Gallery, Smugglers Adventure |
| Bexhill-on-Sea | Quieter seaside town known for its vintage charm and beautiful seafront. A great getaway for families and those seeking a calm beach experience. | Bexhill De La Warr Pavilion, Bexhill Beach, Egerton Park, Cooden Beach, Polly's Cafe, Bexhill Museum |
| Lewes | Historic town with picturesque architecture and the beautiful South Downs nearby. Popular with tourists who enjoy history, nature, and quaint shops. | Lewes Castle, Anne of Cleves House, South Downs National Park, Harveys Brewery, Cliffe High Street, Pells Pool |
| Newhaven | A coastal port town with historical importance and scenic views of the English Channel. Good for visitors looking for a less touristy experience. | Newhaven Fort, Tide Mills, Newhaven Harbour, Paradise Park, Fort Road Cemetery, Friends of Newhaven Fort |
| Seaford | Charming seaside town offering access to beautiful coastal walks and the Seven Sisters cliffs. Ideal for nature lovers and hikers. | Seven Sisters Country Park, Seaford Head, Seaford Beach, Peacehaven Golf Club, Telscombe Tye, Seaford Museum |
| Rye | A quaint historic town known for its cobbled streets, antique shops, and proximity to the coast. Attracts visitors looking for history and charm. | Rye Castle Museum, Ypres Tower, Mermaid Street, Camber Sands, The Landgate, Lydden Spout |
Understanding Airbnb License Requirements & STR Laws in East Sussex (2026)
While East Sussex, England, United Kingdom currently shows low STR regulations, specific Airbnb license requirements might still exist or change. Always verify the latest short term rental regulations and Airbnb license requirements directly with local government authorities for East Sussex to ensure full compliance before hosting.
(Source: AirROI data, 2026, finding no licensed listings among those analyzed)
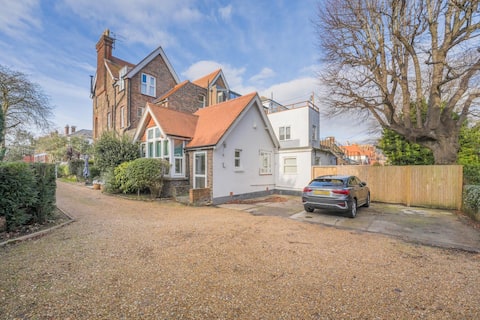
Top Performing Airbnb Properties in East Sussex (2026)
Benchmark your potential! Explore examples of top-performing Airbnb properties in East Sussexbased on Trailing Twelve Month (TTM) revenue. Analyze their characteristics, revenue, occupancy rate, and ADR to understand what drives success in this market.
2 Bed in Eastbourne (oc-b30385)
Entire Place • 2 bedrooms

4 Bed in Peasmarsh (oc-o30350)
Entire Place • 4 bedrooms

2 bedroom 2 bathroom cottage in central Rye
Entire Place • 2 bedrooms

5 Bed in Battle (oc-c31779)
Entire Place • 5 bedrooms

East Sussex Manor | Sleeps 12 | Hot Tub & Parking
Entire Place • 5 bedrooms
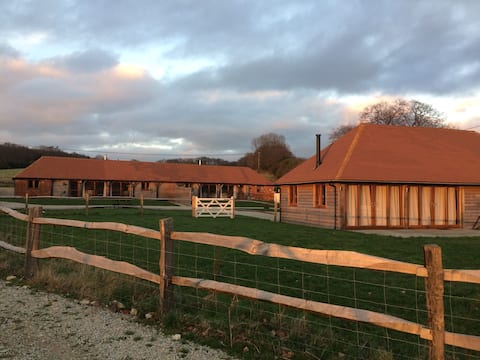
Escheatlands - 3 charming barns sleeps up to 14
Entire Place • 7 bedrooms
Note: Performance varies based on location, size, amenities, seasonality, and management quality. Data reflects the past 12 months.
Top Performing Airbnb Hosts in East Sussex (2026)
Learn from the best! This table showcases top-performing Airbnb hosts in East Sussex based on the number of properties managed and estimated total revenue over the past year. Analyze their scale and performance metrics.
| Host Name | Properties | Grossing Revenue | Stay Reviews | Avg Rating |
|---|---|---|---|---|
| Original Cottages Kent & Susse | 5 | $270,600 | 8 | 5.00/5.0 |
| Gwenael | 1 | $60,388 | 25 | 5.00/5.0 |
| Jo | 2 | $54,849 | 101 | 4.73/5.0 |
| Daisy | 2 | $46,932 | 10 | 3.90/5.0 |
| Adam | 2 | $44,796 | 16 | 4.74/5.0 |
| Jo | 2 | $44,045 | 17 | 4.56/5.0 |
| Fiona | 1 | $39,783 | 1 | Not Rated |
| Charlotte | 1 | $39,379 | 43 | 4.98/5.0 |
| Teena | 2 | $38,016 | 22 | 4.75/5.0 |
| Jane | 1 | $32,796 | 5 | 4.80/5.0 |
Analyzing the strategies of top hosts, such as their property selection, pricing, and guest communication, can offer valuable lessons for optimizing your own Airbnb operations in East Sussex.
Dive Deeper: Advanced East Sussex STR Market Data (2026)
Ready to unlock more insights? AirROI provides access to advanced metrics and comprehensive Airbnb data for East Sussex. Explore detailed analytics beyond this report to refine your investment strategy, optimize pricing, and maximize your vacation rental profits.
Explore Advanced MetricsEast Sussex Short-Term Rental Market Composition (2026): Property & Room Types
Room Type Distribution
Property Type Distribution
Market Composition Insights for East Sussex
- The East Sussex Airbnb market composition is heavily skewed towards Entire Home/Apt listings, which make up 84.3% of the 102 active rentals. This indicates strong guest preference for privacy and space.
- Looking at the property type distribution in East Sussex, Apartment/Condo properties are the most common (43.1%), reflecting the local real estate landscape.
- Houses represent a significant 32.4% portion, catering likely to families or larger groups.
- The presence of 9.8% Hotel/Boutique listings indicates integration with traditional hospitality.
- Smaller segments like unique stays (combined 2.9%) offer potential for unique stay experiences.
East Sussex Airbnb Room Capacity Analysis (2026): Bedroom Distribution
Distribution of Listings by Number of Bedrooms
Room Capacity Insights for East Sussex
- The dominant room capacity in East Sussex is 1 bedroom listings, making up 33.3% of the market. This suggests a strong demand for properties suitable for couples or solo travelers.
- Together, 1 bedroom and 2 bedrooms properties represent 64.7% of the active Airbnb listings in East Sussex, indicating a high concentration in these sizes.
East Sussex Vacation Rental Guest Capacity Trends (2026)
Distribution of Listings by Guest Capacity
Guest Capacity Insights for East Sussex
- The most common guest capacity trend in East Sussex vacation rentals is listings accommodating 2 guests (30.4%). This suggests the primary traveler segment is likely couples or solo travelers.
- Properties designed for 2 guests and 4 guests dominate the East Sussex STR market, accounting for 54.9% of listings.
- 18.6% of properties accommodate 6+ guests, serving the market segment for larger families or group travel in East Sussex.
- On average, properties in East Sussex are equipped to host 3.4 guests.
East Sussex Airbnb Booking Patterns (2026): Available vs. Booked Days
Available Days Distribution
Booked Days Distribution
Booking Pattern Insights for East Sussex
- The most common availability pattern in East Sussex falls within the 271-366 days range, representing 66.7% of listings. This suggests many properties have significant open periods on their calendars.
- Approximately 98.1% of listings show high availability (181+ days open annually), indicating potential for increased bookings or specific owner usage patterns.
- For booked days, the 31-90 days range is most frequent in East Sussex (38.2%), reflecting common guest stay durations or potential owner blocking patterns.
- A notable 2.0% of properties secure long booking periods (181+ days booked per year), highlighting successful long-term rental strategies or significant owner usage.
East Sussex Airbnb Minimum Stay Requirements Analysis
Distribution of Listings by Minimum Night Requirement
1 Night
28 listings
27.5% of total
2 Nights
33 listings
32.4% of total
3 Nights
5 listings
4.9% of total
4-6 Nights
2 listings
2% of total
7-29 Nights
2 listings
2% of total
30+ Nights
32 listings
31.4% of total
Key Insights
- The most prevalent minimum stay requirement in East Sussex is 2 Nights, adopted by 32.4% of listings. This highlights the market's preference for shorter, flexible bookings.
- A significant segment (31.4%) caters to monthly stays (30+ nights) in East Sussex, pointing to opportunities in the extended-stay market.
Recommendations
- Align with the market by considering a 2 Nights minimum stay, as 32.4% of East Sussex hosts use this setting.
- If feasible, allowing 1-night stays, especially midweek or during low season, could capture last-minute bookings, as only 27.5% currently do.
- Explore offering discounts for stays of 30+ nights to attract the 31.4% of the market seeking extended stays.
- Adjust minimum nights based on seasonality – potentially shorter during low season and longer during peak demand periods in East Sussex.
East Sussex Airbnb Cancellation Policy Trends Analysis (2026)
Super Strict 60 Days
12 listings
11.8% of total
Super Strict 30 Days
1 listings
1% of total
Limited
2 listings
2% of total
Flexible
29 listings
28.4% of total
Moderate
37 listings
36.3% of total
Firm
16 listings
15.7% of total
Strict
5 listings
4.9% of total
Cancellation Policy Insights for East Sussex
- The prevailing Airbnb cancellation policy trend in East Sussex is Moderate, used by 36.3% of listings.
- There's a relatively balanced mix between guest-friendly (64.7%) and stricter (20.6%) policies, offering choices for different guest needs.
- Strict cancellation policies are quite rare (4.9%), potentially making listings with this policy less competitive unless justified by high demand or property type.
Recommendations for Hosts
- Consider adopting a Moderate policy to align with the 36.3% market standard in East Sussex.
- Using a Strict policy might deter some guests, as only 4.9% of listings use it. Evaluate if potential revenue protection outweighs possible lower booking rates.
- Regularly review your cancellation policy against competitors and market demand shifts in East Sussex.
East Sussex STR Booking Lead Time Analysis (2026)
Average Booking Lead Time by Month
Booking Lead Time Insights for East Sussex
- The overall average booking lead time for vacation rentals in East Sussex is 22 days.
- Guests book furthest in advance for stays during September (average 30 days), likely coinciding with peak travel demand or local events.
- The shortest booking windows occur for stays in April (average 0 days), indicating more last-minute travel plans during this time.
- Seasonally, Fall (29 days avg.) sees the longest lead times, while Spring (1 days avg.) has the shortest, reflecting typical travel planning cycles.
Recommendations for Hosts
- Use the overall average lead time (22 days) as a baseline for your pricing and availability strategy in East Sussex.
- During April, focus on last-minute booking availability and promotions, as guests book with very short notice (0 days avg.).
- Target marketing efforts for the Fall season well in advance (at least 29 days) to capture early planners.
- Monitor your own booking lead times against these East Sussex averages to identify opportunities for dynamic pricing adjustments.
Popular & Essential Airbnb Amenities in East Sussex (2026)
Amenity Prevalence
Amenity Insights for East Sussex
- Essential amenities in East Sussex that guests expect include: Wifi. Lacking these (this) could significantly impact bookings.
- Popular amenities like Smoke alarm, Kitchen, TV are common but not universal. Offering these can provide a competitive edge.
Recommendations for Hosts
- Ensure your listing includes all essential amenities for East Sussex: Wifi.
- Prioritize adding missing essentials: Wifi.
- Consider adding popular differentiators like Smoke alarm or Kitchen to increase appeal.
- Highlight unique or less common amenities you offer (e.g., hot tub, dedicated workspace, EV charger) in your listing description and photos.
- Regularly check competitor amenities in East Sussex to stay competitive.
East Sussex Airbnb Guest Demographics & Profile Analysis (2026)
Guest Profile Summary for East Sussex
- The typical guest profile for Airbnb in East Sussex consists of primarily domestic travelers (80%), often arriving from nearby London, typically belonging to the Post-2000s (Gen Z/Alpha) group (50%), primarily speaking English or French.
- Domestic travelers account for 79.6% of guests.
- Key international markets include United Kingdom (79.6%) and Germany (3.8%).
- Top languages spoken are English (56%) followed by French (9.1%).
- A significant demographic segment is the Post-2000s (Gen Z/Alpha) group, representing 50% of guests.
Recommendations for Hosts
- Target domestic marketing efforts towards travelers from London and England.
- Tailor amenities and listing descriptions to appeal to the dominant Post-2000s (Gen Z/Alpha) demographic (e.g., highlight fast WiFi, smart home features, local guides).
- Highlight unique local experiences or amenities relevant to the primary guest profile.
- Consider seasonal promotions aligned with peak travel times for key origin markets.
Nearby Short-Term Rental Market Comparison
How does the East Sussex Airbnb market stack up against its neighbors? Compare key performance metrics like average monthly revenue, ADR, and occupancy rates in surrounding areas to understand the broader regional STR landscape.
| Market | Active Properties | Monthly Revenue | Daily Rate | Avg. Occupancy |
|---|---|---|---|---|
| Dorney | 11 | $7,510 | $743.63 | 39% |
| Wraysbury | 16 | $6,199 | $530.56 | 49% |
| City of Westminster | 1,424 | $6,053 | $515.72 | 50% |
| Old Windsor | 20 | $4,177 | $286.69 | 49% |
| Cookham | 20 | $4,138 | $347.79 | 47% |
| Bourne End | 10 | $4,086 | $496.86 | 46% |
| La Poterie-Cap-d'Antifer | 15 | $3,878 | $273.66 | 48% |
| City of London | 242 | $3,522 | $340.82 | 47% |
| Saint-Étienne-la-Thillaye | 23 | $3,486 | $390.94 | 35% |
| Roedean | 52 | $3,379 | $273.40 | 45% |