Breckland District Airbnb Market Analysis 2026: Short Term Rental Data & Vacation Rental Statistics in England, United Kingdom
Is Airbnb profitable in Breckland District in 2026? Explore comprehensive Airbnb analytics for Breckland District, England, United Kingdom to uncover income potential. This 2026 STR market report for Breckland District, based on AirROI data from February 2025 to January 2026, reveals key trends in the market of 397 active listings.
Whether you're considering an Airbnb investment in Breckland District, optimizing your existing vacation rental, or exploring rental arbitrage opportunities, understanding the Breckland District Airbnb data is crucial. Leveraging the low regulation environment is key to maximizing your short term rental income potential. Let's dive into the specifics.
Key Breckland District Airbnb Performance Metrics Overview
Monthly Airbnb Revenue Variations & Income Potential in Breckland District (2026)
Understanding the monthly revenue variations for Airbnb listings in Breckland District is key to maximizing your short term rental income potential. Seasonality significantly impacts earnings. Our analysis, based on data from the past 12 months, shows that the peak revenue month for STRs in Breckland District is typically August, while January often presents the lowest earnings, highlighting opportunities for strategic pricing adjustments during shoulder and low seasons. Explore the typical Airbnb income in Breckland District across different performance tiers:
- Best-in-class properties (Top 10%) achieve $5,667+ monthly, often utilizing dynamic pricing and superior guest experiences.
- Strong performing properties (Top 25%) earn $3,475 or more, indicating effective management and desirable locations/amenities.
- Typical properties (Median) generate around $2,052 per month, representing the average market performance.
- Entry-level properties (Bottom 25%) see earnings around $1,032, often with potential for optimization.
Average Monthly Airbnb Earnings Trend in Breckland District
Breckland District Airbnb Occupancy Rate Trends (2026)
Maximize your bookings by understanding the Breckland District STR occupancy trends. Seasonal demand shifts significantly influence how often properties are booked. Typically, Augustsees the highest demand (peak season occupancy), while January experiences the lowest (low season). Effective strategies, like adjusting minimum stays or offering promotions, can boost occupancy during slower periods. Here's how different property tiers perform in Breckland District:
- Best-in-class properties (Top 10%) achieve 80%+ occupancy, indicating high desirability and potentially optimized availability.
- Strong performing properties (Top 25%) maintain 63% or higher occupancy, suggesting good market fit and guest satisfaction.
- Typical properties (Median) have an occupancy rate around 41%.
- Entry-level properties (Bottom 25%) average 21% occupancy, potentially facing higher vacancy.
Average Monthly Occupancy Rate Trend in Breckland District
Average Daily Rate (ADR) Airbnb Trends in Breckland District (2026)
Effective short term rental pricing strategy in Breckland District involves understanding monthly ADR fluctuations. The Average Daily Rate (ADR) for Airbnb in Breckland District typically peaks in August and dips lowest during March. Leveraging Airbnb dynamic pricing tools or strategies based on this seasonality can significantly boost revenue. Here's a look at the typical nightly rates achieved:
- Best-in-class properties (Top 10%) command rates of $412+ per night, often due to premium features or locations.
- Strong performing properties (Top 25%) achieve nightly rates of $232 or more.
- Typical properties (Median) charge around $163 per night.
- Entry-level properties (Bottom 25%) earn around $118 per night.
Average Daily Rate (ADR) Trend by Month in Breckland District
Get Live Breckland District Market Intelligence 👇

Explore Real-time Analytics
Airbnb Seasonality Analysis & Trends in Breckland District (2026)
Peak Season (August, July, June)
- Revenue averages $3,794 per month
- Occupancy rates average 51.2%
- Daily rates average $243
Shoulder Season
- Revenue averages $2,943 per month
- Occupancy maintains around 43.0%
- Daily rates hold near $233
Low Season (January, February, March)
- Revenue drops to average $2,347 per month
- Occupancy decreases to average 35.8%
- Daily rates adjust to average $218
Seasonality Insights for Breckland District
- The Airbnb seasonality in Breckland District shows highly seasonal trends requiring careful strategy. While the sections above show seasonal averages, it's also insightful to look at the extremes:
- During the high season, the absolute peak month showcases Breckland District's highest earning potential, with monthly revenues capable of climbing to $4,280, occupancy reaching a high of 57.7%, and ADRs peaking at $244.
- Conversely, the slowest single month of the year, typically falling within the low season, marks the market's lowest point. In this month, revenue might dip to $2,057, occupancy could drop to 27.6%, and ADRs may adjust down to $212.
- Understanding both the seasonal averages and these monthly peaks and troughs in revenue, occupancy, and ADR is crucial for maximizing your Airbnb profit potential in Breckland District.
Seasonal Strategies for Maximizing Profit
- Peak Season: Maximize revenue through premium pricing and potentially longer minimum stays. Ensure high availability.
- Low Season: Offer competitive pricing, special promotions (e.g., extended stay discounts), and flexible cancellation policies. Target off-season travelers like remote workers or budget-conscious guests.
- Shoulder Seasons: Implement dynamic pricing that balances peak and low rates. Target weekend travelers or specific events. Offer slightly more flexible terms than peak season.
- Regularly analyze your own performance against these Breckland District seasonality benchmarks and adjust your pricing and availability strategy accordingly.
Best Areas for Airbnb Investment in Breckland District (2026)
Exploring the top neighborhoods for short-term rentals in Breckland District? This section highlights key areas, outlining why they are attractive for hosts and guests, along with notable local attractions. Consider these locations based on your target guest profile and investment strategy.
| Neighborhood / Area | Why Host Here? (Target Guests & Appeal) | Key Attractions & Landmarks |
|---|---|---|
| Thetford | Historical market town with an abundance of cultural heritage and access to Thetford Forest. Attractive for families and nature enthusiasts from both the UK and abroad. | Thetford Forest, Ancient House Museum, Charles Burrell Museum, Thetford Priory, Thetford's Ancient Abbey |
| Attleborough | A growing market town that offers a quaint and appealing atmosphere with close proximity to Norwich and good transport links. Ideal for guests seeking a rural retreat with urban convenience. | Attleborough Heritage Centre, Norfolk Snowsports Club, East Harling, Breckland Leisure Centre, Local parks and countryside |
| Dereham | A vibrant town in the heart of Norfolk with a thriving community spirit and rich history. Attracts families and visitors looking for an authentic experience and good local amenities. | Dereham Windmill, Church of St Nicholas, Dereham Market, Raynham Hall, Local shops and eateries |
| Swaffham | A market town known for its antique shops and charming marketplace, Swaffham appeals to visitors interested in history and local culture. Its proximity to attractions makes it a good investment. | Swaffham Museum, Castle Acre Priory, Springfields Outlet Shopping, Market Place, Theatre Royal |
| Watton | A small market town with a friendly atmosphere and beautiful surrounding countryside, ideal for outdoor enthusiasts and those looking for a peaceful getaway. | Watton Clock Tower, Thompson Water, Local walking trails, Watton Sports Centre, St Mary's Church |
| Fakenham | A historic market town that offers a variety of local shops and is close to attractions like the North Norfolk coast. Ideal for families and beach-goers. | Fakenham Racecourse, Muckleburgh Collection, Local farmers market, St. Peter and St. Paul Church, North Norfolk Railway |
| North Elmham | A small village that shows the charm of the English countryside, perfect for tourists seeking tranquility and nature with easy access to larger towns. | North Elmham Cathedral Ruins, Countryside walks, Local pubs and shops, Bishop's Meadow, Nearby historical sites |
| Brandon | A town on the edge of the Thetford Forest, appealing to outdoor enthusiasts and families with excellent biking and hiking trails nearby, great for Airbnb hosting. | Brandon Country Park, Thetford Forest, Brandon Heritage Centre, Local shops and cafes, Biking and hiking routes |
Understanding Airbnb License Requirements & STR Laws in Breckland District (2026)
While Breckland District, England, United Kingdom currently shows low STR regulations, specific Airbnb license requirements might still exist or change. Always verify the latest short term rental regulations and Airbnb license requirements directly with local government authorities for Breckland District to ensure full compliance before hosting.
(Source: AirROI data, 2026, finding no licensed listings among those analyzed)
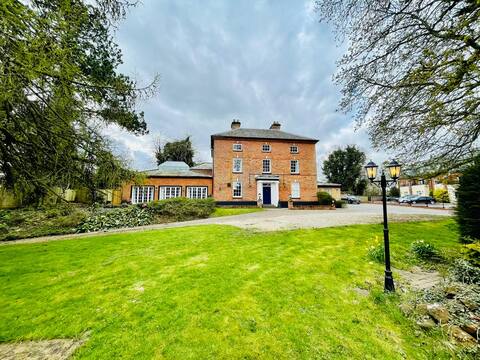
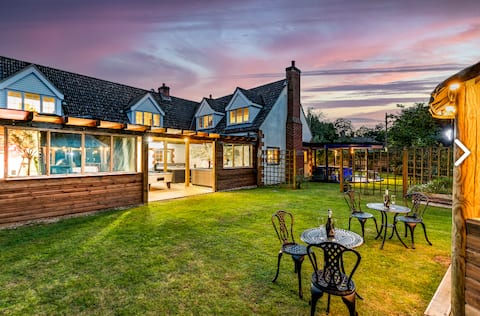
Top Performing Airbnb Properties in Breckland District (2026)
Benchmark your potential! Explore examples of top-performing Airbnb properties in Breckland Districtbased on Trailing Twelve Month (TTM) revenue. Analyze their characteristics, revenue, occupancy rate, and ADR to understand what drives success in this market.
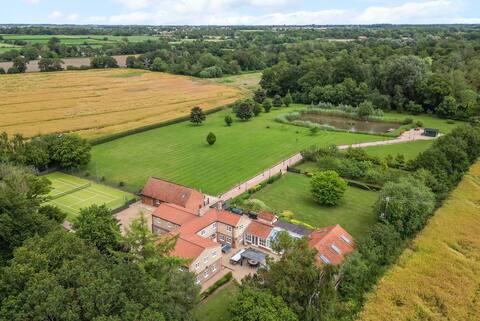
Cottage in Norfolk sleeps 23 - private pool, fishing lake, hot tub ref 99008SC
Entire Place • 7 bedrooms

Stunning Oakleigh House for special gatherings
Entire Place • 10 bedrooms
Lydney House Hotel Swaffham Market Town
Private Room • 11 bedrooms
Norfolk Hen & Stag Retreat sleeps up to 20
Entire Place • 5 bedrooms

4 Bed in Mattishall (oc-2367)
Entire Place • 6 bedrooms

Ashtree Barns, Luxury Retreat, 3 Acres + Hot Tub
Entire Place • 6 bedrooms
Note: Performance varies based on location, size, amenities, seasonality, and management quality. Data reflects the past 12 months.
Top Performing Airbnb Hosts in Breckland District (2026)
Learn from the best! This table showcases top-performing Airbnb hosts in Breckland District based on the number of properties managed and estimated total revenue over the past year. Analyze their scale and performance metrics.
| Host Name | Properties | Grossing Revenue | Stay Reviews | Avg Rating |
|---|---|---|---|---|
| Cottages | 51 | $1,537,462 | 573 | 4.76/5.0 |
| Norfolk Cottages | 8 | $473,300 | 52 | 4.79/5.0 |
| 2cHolidays | 1 | $345,665 | 17 | 4.94/5.0 |
| Gregory | 1 | $313,134 | 32 | 5.00/5.0 |
| Norfolk Holiday Rentals | 1 | $266,840 | 58 | 4.90/5.0 |
| Stephen | 1 | $210,742 | 48 | 4.94/5.0 |
| Melanie | 5 | $198,631 | 814 | 4.92/5.0 |
| Hoseasons | 5 | $183,739 | 145 | 4.82/5.0 |
| Jade Danielle | 1 | $175,107 | 27 | 5.00/5.0 |
| Alan | 2 | $169,157 | 384 | 4.98/5.0 |
Analyzing the strategies of top hosts, such as their property selection, pricing, and guest communication, can offer valuable lessons for optimizing your own Airbnb operations in Breckland District.
Dive Deeper: Advanced Breckland District STR Market Data (2026)
Ready to unlock more insights? AirROI provides access to advanced metrics and comprehensive Airbnb data for Breckland District. Explore detailed analytics beyond this report to refine your investment strategy, optimize pricing, and maximize your vacation rental profits.
Explore Advanced MetricsBreckland District Short-Term Rental Market Composition (2026): Property & Room Types
Room Type Distribution
Property Type Distribution
Market Composition Insights for Breckland District
- The Breckland District Airbnb market composition is heavily skewed towards Entire Home/Apt listings, which make up 86.9% of the 397 active rentals. This indicates strong guest preference for privacy and space.
- Looking at the property type distribution in Breckland District, House properties are the most common (55.7%), reflecting the local real estate landscape.
- Houses represent a significant 55.7% portion, catering likely to families or larger groups.
- The presence of 11.1% Hotel/Boutique listings indicates integration with traditional hospitality.
Breckland District Airbnb Room Capacity Analysis (2026): Bedroom Distribution
Distribution of Listings by Number of Bedrooms
Room Capacity Insights for Breckland District
- The dominant room capacity in Breckland District is 1 bedroom listings, making up 41.1% of the market. This suggests a strong demand for properties suitable for couples or solo travelers.
- Together, 1 bedroom and 2 bedrooms properties represent 66.0% of the active Airbnb listings in Breckland District, indicating a high concentration in these sizes.
- A significant 24.4% of listings offer 3+ bedrooms, catering to larger groups and families seeking more space in Breckland District.
Breckland District Vacation Rental Guest Capacity Trends (2026)
Distribution of Listings by Guest Capacity
Guest Capacity Insights for Breckland District
- The most common guest capacity trend in Breckland District vacation rentals is listings accommodating 2 guests (33%). This suggests the primary traveler segment is likely couples or solo travelers.
- Properties designed for 2 guests and 4 guests dominate the Breckland District STR market, accounting for 55.9% of listings.
- 25.2% of properties accommodate 6+ guests, serving the market segment for larger families or group travel in Breckland District.
- On average, properties in Breckland District are equipped to host 3.8 guests.
Breckland District Airbnb Booking Patterns (2026): Available vs. Booked Days
Available Days Distribution
Booked Days Distribution
Booking Pattern Insights for Breckland District
- The most common availability pattern in Breckland District falls within the 271-366 days range, representing 41.6% of listings. This suggests many properties have significant open periods on their calendars.
- Approximately 73.6% of listings show high availability (181+ days open annually), indicating potential for increased bookings or specific owner usage patterns.
- For booked days, the 91-180 days range is most frequent in Breckland District (31%), reflecting common guest stay durations or potential owner blocking patterns.
- A notable 27.9% of properties secure long booking periods (181+ days booked per year), highlighting successful long-term rental strategies or significant owner usage.
Breckland District Airbnb Minimum Stay Requirements Analysis
Distribution of Listings by Minimum Night Requirement
1 Night
139 listings
35% of total
2 Nights
105 listings
26.4% of total
3 Nights
33 listings
8.3% of total
4-6 Nights
10 listings
2.5% of total
7-29 Nights
4 listings
1% of total
30+ Nights
106 listings
26.7% of total
Key Insights
- The most prevalent minimum stay requirement in Breckland District is 1 Night, adopted by 35% of listings. This highlights the market's preference for shorter, flexible bookings.
- A strong majority (61.4%) of the Breckland District Airbnb data shows acceptance of very short stays (1-2 nights), indicating a dynamic, high-turnover market.
- A significant segment (26.7%) caters to monthly stays (30+ nights) in Breckland District, pointing to opportunities in the extended-stay market.
Recommendations
- Align with the market by considering a 1 Night minimum stay, as 35% of Breckland District hosts use this setting.
- Explore offering discounts for stays of 30+ nights to attract the 26.7% of the market seeking extended stays.
- Adjust minimum nights based on seasonality – potentially shorter during low season and longer during peak demand periods in Breckland District.
Breckland District Airbnb Cancellation Policy Trends Analysis (2026)
Super Strict 30 Days
5 listings
1.3% of total
Limited
5 listings
1.3% of total
Refundable
4 listings
1% of total
Non-refundable
4 listings
1% of total
Super Strict 60 Days
80 listings
20.2% of total
Flexible
83 listings
21% of total
Moderate
99 listings
25% of total
Firm
88 listings
22.2% of total
Strict
28 listings
7.1% of total
Cancellation Policy Insights for Breckland District
- The prevailing Airbnb cancellation policy trend in Breckland District is Moderate, used by 25% of listings.
- There's a relatively balanced mix between guest-friendly (46.0%) and stricter (29.3%) policies, offering choices for different guest needs.
- Strict cancellation policies are quite rare (7.1%), potentially making listings with this policy less competitive unless justified by high demand or property type.
Recommendations for Hosts
- Consider adopting a Moderate policy to align with the 25% market standard in Breckland District.
- Using a Strict policy might deter some guests, as only 7.1% of listings use it. Evaluate if potential revenue protection outweighs possible lower booking rates.
- Regularly review your cancellation policy against competitors and market demand shifts in Breckland District.
Breckland District STR Booking Lead Time Analysis (2026)
Average Booking Lead Time by Month
Booking Lead Time Insights for Breckland District
- The overall average booking lead time for vacation rentals in Breckland District is 60 days.
- Guests book furthest in advance for stays during August (average 80 days), likely coinciding with peak travel demand or local events.
- The shortest booking windows occur for stays in March (average 40 days), indicating more last-minute travel plans during this time.
- Seasonally, Summer (72 days avg.) sees the longest lead times, while Winter (54 days avg.) has the shortest, reflecting typical travel planning cycles.
Recommendations for Hosts
- Use the overall average lead time (60 days) as a baseline for your pricing and availability strategy in Breckland District.
- For August stays, consider implementing length-of-stay discounts or slightly higher rates for bookings made less than 80 days out to capitalize on advance planning.
- Target marketing efforts for the Summer season well in advance (at least 72 days) to capture early planners.
- Monitor your own booking lead times against these Breckland District averages to identify opportunities for dynamic pricing adjustments.
Popular & Essential Airbnb Amenities in Breckland District (2026)
Amenity Prevalence
Amenity Insights for Breckland District
- Essential amenities in Breckland District that guests expect include: Smoke alarm. Lacking these (this) could significantly impact bookings.
- Popular amenities like Free parking on premises, Wifi, Heating are common but not universal. Offering these can provide a competitive edge.
- Warning: Wifi is not universally provided but is considered essential globally. Ensure reliable Wifi is offered.
Recommendations for Hosts
- Ensure your listing includes all essential amenities for Breckland District: Smoke alarm.
- Prioritize adding missing essentials: Smoke alarm.
- Consider adding popular differentiators like Free parking on premises or Wifi to increase appeal.
- Highlight unique or less common amenities you offer (e.g., hot tub, dedicated workspace, EV charger) in your listing description and photos.
- Regularly check competitor amenities in Breckland District to stay competitive.
Breckland District Airbnb Guest Demographics & Profile Analysis (2026)
Guest Profile Summary for Breckland District
- The typical guest profile for Airbnb in Breckland District consists of primarily domestic travelers (95%), often arriving from nearby England, typically belonging to the Post-2000s (Gen Z/Alpha) group (50%), primarily speaking English or French.
- Domestic travelers account for 94.7% of guests.
- Key international markets include United Kingdom (94.7%) and United States (1.3%).
- Top languages spoken are English (75.2%) followed by French (6.5%).
- A significant demographic segment is the Post-2000s (Gen Z/Alpha) group, representing 50% of guests.
Recommendations for Hosts
- Target domestic marketing efforts towards travelers from England and London.
- Tailor amenities and listing descriptions to appeal to the dominant Post-2000s (Gen Z/Alpha) demographic (e.g., highlight fast WiFi, smart home features, local guides).
- Highlight unique local experiences or amenities relevant to the primary guest profile.
- Consider seasonal promotions aligned with peak travel times for key origin markets.
Nearby Short-Term Rental Market Comparison
How does the Breckland District Airbnb market stack up against its neighbors? Compare key performance metrics like average monthly revenue, ADR, and occupancy rates in surrounding areas to understand the broader regional STR landscape.
| Market | Active Properties | Monthly Revenue | Daily Rate | Avg. Occupancy |
|---|---|---|---|---|
| Dorney | 11 | $7,510 | $743.63 | 39% |
| Wraysbury | 16 | $6,199 | $530.56 | 49% |
| City of Westminster | 1,424 | $6,053 | $515.72 | 50% |
| Stamford Bridge | 11 | $4,828 | $418.84 | 39% |
| Old Windsor | 20 | $4,177 | $286.69 | 49% |
| Cookham | 20 | $4,138 | $347.79 | 47% |
| Bourne End | 10 | $4,086 | $496.86 | 46% |
| Huggate | 10 | $3,763 | $279.44 | 47% |
| City of London | 242 | $3,522 | $340.82 | 47% |
| South Cave | 10 | $3,165 | $196.68 | 54% |