Bath Airbnb Market Analysis 2026: Short Term Rental Data & Vacation Rental Statistics in England, United Kingdom
Is Airbnb profitable in Bath in 2026? Explore comprehensive Airbnb analytics for Bath, England, United Kingdom to uncover income potential. This 2026 STR market report for Bath, based on AirROI data from February 2025 to January 2026, reveals key trends in the bustling market of 1,081 active listings.
Whether you're considering an Airbnb investment in Bath, optimizing your existing vacation rental, or exploring rental arbitrage opportunities, understanding the Bath Airbnb data is crucial. Leveraging the low regulation environment is key to maximizing your short term rental income potential. Let's dive into the specifics.
Key Bath Airbnb Performance Metrics Overview
Monthly Airbnb Revenue Variations & Income Potential in Bath (2026)
Understanding the monthly revenue variations for Airbnb listings in Bath is key to maximizing your short term rental income potential. Seasonality significantly impacts earnings. Our analysis, based on data from the past 12 months, shows that the peak revenue month for STRs in Bath is typically July, while January often presents the lowest earnings, highlighting opportunities for strategic pricing adjustments during shoulder and low seasons. Explore the typical Airbnb income in Bath across different performance tiers:
- Best-in-class properties (Top 10%) achieve $7,927+ monthly, often utilizing dynamic pricing and superior guest experiences.
- Strong performing properties (Top 25%) earn $5,259 or more, indicating effective management and desirable locations/amenities.
- Typical properties (Median) generate around $3,331 per month, representing the average market performance.
- Entry-level properties (Bottom 25%) see earnings around $1,910, often with potential for optimization.
Average Monthly Airbnb Earnings Trend in Bath
Bath Airbnb Occupancy Rate Trends (2026)
Maximize your bookings by understanding the Bath STR occupancy trends. Seasonal demand shifts significantly influence how often properties are booked. Typically, Julysees the highest demand (peak season occupancy), while January experiences the lowest (low season). Effective strategies, like adjusting minimum stays or offering promotions, can boost occupancy during slower periods. Here's how different property tiers perform in Bath:
- Best-in-class properties (Top 10%) achieve 86%+ occupancy, indicating high desirability and potentially optimized availability.
- Strong performing properties (Top 25%) maintain 74% or higher occupancy, suggesting good market fit and guest satisfaction.
- Typical properties (Median) have an occupancy rate around 54%.
- Entry-level properties (Bottom 25%) average 31% occupancy, potentially facing higher vacancy.
Average Monthly Occupancy Rate Trend in Bath
Average Daily Rate (ADR) Airbnb Trends in Bath (2026)
Effective short term rental pricing strategy in Bath involves understanding monthly ADR fluctuations. The Average Daily Rate (ADR) for Airbnb in Bath typically peaks in July and dips lowest during February. Leveraging Airbnb dynamic pricing tools or strategies based on this seasonality can significantly boost revenue. Here's a look at the typical nightly rates achieved:
- Best-in-class properties (Top 10%) command rates of $481+ per night, often due to premium features or locations.
- Strong performing properties (Top 25%) achieve nightly rates of $314 or more.
- Typical properties (Median) charge around $213 per night.
- Entry-level properties (Bottom 25%) earn around $146 per night.
Average Daily Rate (ADR) Trend by Month in Bath
Get Live Bath Market Intelligence 👇

Explore Real-time Analytics
Airbnb Seasonality Analysis & Trends in Bath (2026)
Peak Season (July, August, December)
- Revenue averages $5,085 per month
- Occupancy rates average 59.1%
- Daily rates average $290
Shoulder Season
- Revenue averages $4,243 per month
- Occupancy maintains around 53.6%
- Daily rates hold near $276
Low Season (January, February, March)
- Revenue drops to average $3,026 per month
- Occupancy decreases to average 42.9%
- Daily rates adjust to average $256
Seasonality Insights for Bath
- The Airbnb seasonality in Bath shows moderate seasonality with distinct peak and low periods. While the sections above show seasonal averages, it's also insightful to look at the extremes:
- During the high season, the absolute peak month showcases Bath's highest earning potential, with monthly revenues capable of climbing to $5,398, occupancy reaching a high of 61.6%, and ADRs peaking at $295.
- Conversely, the slowest single month of the year, typically falling within the low season, marks the market's lowest point. In this month, revenue might dip to $2,697, occupancy could drop to 36.5%, and ADRs may adjust down to $253.
- Understanding both the seasonal averages and these monthly peaks and troughs in revenue, occupancy, and ADR is crucial for maximizing your Airbnb profit potential in Bath.
Seasonal Strategies for Maximizing Profit
- Peak Season: Maximize revenue through premium pricing and potentially longer minimum stays. Ensure high availability.
- Low Season: Offer competitive pricing, special promotions (e.g., extended stay discounts), and flexible cancellation policies. Target off-season travelers like remote workers or budget-conscious guests.
- Shoulder Seasons: Implement dynamic pricing that balances peak and low rates. Target weekend travelers or specific events. Offer slightly more flexible terms than peak season.
- Regularly analyze your own performance against these Bath seasonality benchmarks and adjust your pricing and availability strategy accordingly.
Best Areas for Airbnb Investment in Bath (2026)
Exploring the top neighborhoods for short-term rentals in Bath? This section highlights key areas, outlining why they are attractive for hosts and guests, along with notable local attractions. Consider these locations based on your target guest profile and investment strategy.
| Neighborhood / Area | Why Host Here? (Target Guests & Appeal) | Key Attractions & Landmarks |
|---|---|---|
| Central Bath | The heart of the city, Central Bath is known for its stunning architecture and rich history. It attracts tourists seeking to explore the Roman Baths, Bath Abbey, and various shops and restaurants. | Roman Baths, Bath Abbey, Pulteney Bridge, The Circus, Royal Crescent, Thermae Bath Spa |
| Southgate | A modern shopping area with a mix of high-street brands and eateries, Southgate appeals to visitors looking for a contemporary experience close to Bath's historical sites. | SouthGate Bath shopping centre, Burton Street, The Gallery, Bath's Museum of Bath at Work, The Forum |
| Lansdown | An affluent residential area with beautiful Georgian architecture, Lansdown is ideal for guests seeking a tranquil environment within easy reach of Bath's attractions. | Lansdown Cemetery, Bath Racecourse, Beckford Tower, Royal Victoria Park |
| Walcot | Known for its artistic community, Walcot attracts creative individuals and visitors wanting a bohemian vibe. It offers charming cafes and boutique shops. | Walcot Street, The Holburne Museum, Bizarre Bath Tours, Arts Workshops |
| Bath Riverside | This area features new developments and scenic views along the River Avon, appealing to modern travelers who enjoy waterfront relaxation and dining. | Bath Spa University, Pulteney Weir, River Avon walks, The Bathwick Estate |
| Weston | Located slightly outside the city center, Weston offers a quieter, more residential feel with access to parks and green spaces, perfect for families and longer stays. | Weston All Saints Church, Botany Bay, Royal Victoria Park, The Approach Golf Club |
| Oldfield Park | This vibrant area is popular with students and young professionals, making it ideal for budget travelers looking for affordable accommodation close to the university and city. | Oldfield Park Railway Station, University of Bath, The Oldfield Park Tavern |
| Midford | A picturesque village on the outskirts of Bath, Midford offers a unique rural charm while still being close to the city, attracting nature lovers and those seeking a peaceful retreat. | Midford Castle, The Two Tunnels Greenway, Local countryside walks |
Understanding Airbnb License Requirements & STR Laws in Bath (2026)
While Bath, England, United Kingdom currently shows low STR regulations, specific Airbnb license requirements might still exist or change. Always verify the latest short term rental regulations and Airbnb license requirements directly with local government authorities for Bath to ensure full compliance before hosting.
(Source: AirROI data, 2026, based on 0% licensed listings)
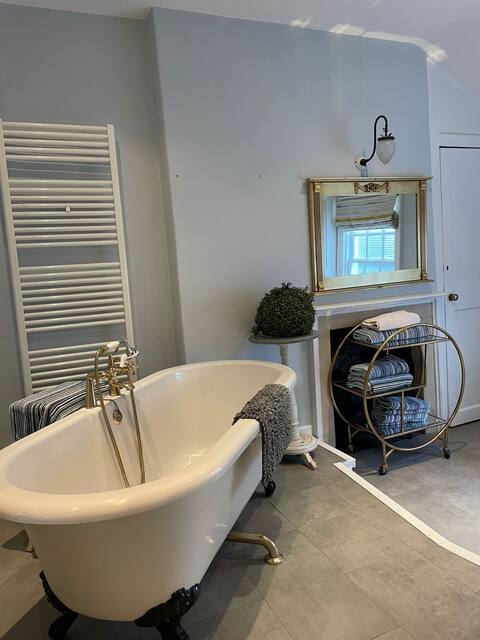
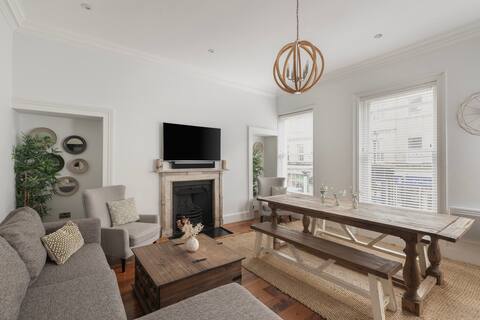
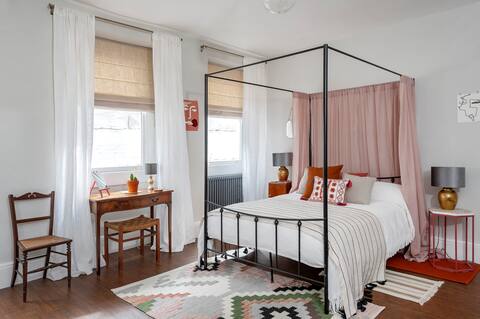
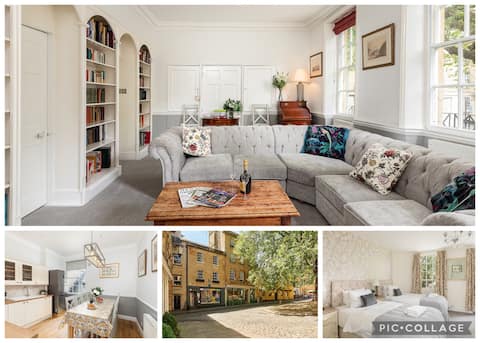
Top Performing Airbnb Properties in Bath (2026)
Benchmark your potential! Explore examples of top-performing Airbnb properties in Bathbased on Trailing Twelve Month (TTM) revenue. Analyze their characteristics, revenue, occupancy rate, and ADR to understand what drives success in this market.
Beautiful Townhouse-In the very heart of the city
Entire Place • 5 bedrooms
Stunning 5 bed Luxury Home - Pulteney Bridge, Bath
Entire Place • 5 bedrooms
Contemporary Townhouse & Studio Bath
Entire Place • 5 bedrooms

Vineyards Townhouse
Entire Place • 6 bedrooms
City Centre Georgian house-Roman Baths-2 min walk
Entire Place • 6 bedrooms
Broad Street House
Entire Place • 4 bedrooms
Note: Performance varies based on location, size, amenities, seasonality, and management quality. Data reflects the past 12 months.
Top Performing Airbnb Hosts in Bath (2026)
Learn from the best! This table showcases top-performing Airbnb hosts in Bath based on the number of properties managed and estimated total revenue over the past year. Analyze their scale and performance metrics.
| Host Name | Properties | Grossing Revenue | Stay Reviews | Avg Rating |
|---|---|---|---|---|
| Dan & Katie | 14 | $1,630,307 | 1795 | 4.84/5.0 |
| Bath Holiday Rentals | 47 | $1,377,591 | 2812 | 4.81/5.0 |
| Rococo Of Bath | 14 | $1,132,150 | 2350 | 4.92/5.0 |
| Rococo Of Bath | 13 | $834,264 | 1965 | 4.94/5.0 |
| Dan | 18 | $826,673 | 3019 | 4.82/5.0 |
| Melissa | 12 | $803,181 | 3261 | 4.83/5.0 |
| Christopher | 13 | $688,836 | 1727 | 4.81/5.0 |
| James | 15 | $648,464 | 486 | 4.58/5.0 |
| Georges | 8 | $596,598 | 615 | 4.85/5.0 |
| Sam | 10 | $558,497 | 754 | 4.81/5.0 |
Analyzing the strategies of top hosts, such as their property selection, pricing, and guest communication, can offer valuable lessons for optimizing your own Airbnb operations in Bath.
Dive Deeper: Advanced Bath STR Market Data (2026)
Ready to unlock more insights? AirROI provides access to advanced metrics and comprehensive Airbnb data for Bath. Explore detailed analytics beyond this report to refine your investment strategy, optimize pricing, and maximize your vacation rental profits.
Explore Advanced MetricsBath Short-Term Rental Market Composition (2026): Property & Room Types
Room Type Distribution
Property Type Distribution
Market Composition Insights for Bath
- The Bath Airbnb market composition is heavily skewed towards Entire Home/Apt listings, which make up 83.1% of the 1,081 active rentals. This indicates strong guest preference for privacy and space.
- Looking at the property type distribution in Bath, Apartment/Condo properties are the most common (52.1%), reflecting the local real estate landscape.
- Houses represent a significant 36.4% portion, catering likely to families or larger groups.
- The presence of 5.5% Hotel/Boutique listings indicates integration with traditional hospitality.
- Smaller segments like others, outdoor/unique, unique stays (combined 6.1%) offer potential for unique stay experiences.
Bath Airbnb Room Capacity Analysis (2026): Bedroom Distribution
Distribution of Listings by Number of Bedrooms
Room Capacity Insights for Bath
- The dominant room capacity in Bath is 1 bedroom listings, making up 38.8% of the market. This suggests a strong demand for properties suitable for couples or solo travelers.
- Together, 1 bedroom and 2 bedrooms properties represent 65.8% of the active Airbnb listings in Bath, indicating a high concentration in these sizes.
- A significant 20.3% of listings offer 3+ bedrooms, catering to larger groups and families seeking more space in Bath.
Bath Vacation Rental Guest Capacity Trends (2026)
Distribution of Listings by Guest Capacity
Guest Capacity Insights for Bath
- The most common guest capacity trend in Bath vacation rentals is listings accommodating 2 guests (27.3%). This suggests the primary traveler segment is likely couples or solo travelers.
- Properties designed for 2 guests and 4 guests dominate the Bath STR market, accounting for 53.1% of listings.
- 23.3% of properties accommodate 6+ guests, serving the market segment for larger families or group travel in Bath.
- On average, properties in Bath are equipped to host 3.7 guests.
Bath Airbnb Booking Patterns (2026): Available vs. Booked Days
Available Days Distribution
Booked Days Distribution
Booking Pattern Insights for Bath
- The most common availability pattern in Bath falls within the 91-180 days range, representing 32.7% of listings. This suggests many properties have significant open periods on their calendars.
- Approximately 53.7% of listings show high availability (181+ days open annually), indicating potential for increased bookings or specific owner usage patterns.
- For booked days, the 181-270 days range is most frequent in Bath (32.2%), reflecting common guest stay durations or potential owner blocking patterns.
- A notable 47.6% of properties secure long booking periods (181+ days booked per year), highlighting successful long-term rental strategies or significant owner usage.
Bath Airbnb Minimum Stay Requirements Analysis
Distribution of Listings by Minimum Night Requirement
1 Night
284 listings
26.3% of total
2 Nights
354 listings
32.8% of total
3 Nights
19 listings
1.8% of total
4-6 Nights
10 listings
0.9% of total
7-29 Nights
22 listings
2% of total
30+ Nights
391 listings
36.2% of total
Key Insights
- The most prevalent minimum stay requirement in Bath is 30+ Nights, adopted by 36.2% of listings. This highlights the market's preference for longer commitments.
- A significant segment (36.2%) caters to monthly stays (30+ nights) in Bath, pointing to opportunities in the extended-stay market.
Recommendations
- Align with the market by considering a 30+ Nights minimum stay, as 36.2% of Bath hosts use this setting.
- If feasible, allowing 1-night stays, especially midweek or during low season, could capture last-minute bookings, as only 26.3% currently do.
- Explore offering discounts for stays of 30+ nights to attract the 36.2% of the market seeking extended stays.
- Adjust minimum nights based on seasonality – potentially shorter during low season and longer during peak demand periods in Bath.
Bath Airbnb Cancellation Policy Trends Analysis (2026)
Limited
18 listings
1.7% of total
Super Strict 60 Days
68 listings
6.3% of total
Super Strict 30 Days
9 listings
0.8% of total
Refundable
2 listings
0.2% of total
Flexible
118 listings
10.9% of total
Moderate
376 listings
34.9% of total
Firm
370 listings
34.3% of total
Strict
117 listings
10.9% of total
Cancellation Policy Insights for Bath
- The prevailing Airbnb cancellation policy trend in Bath is Moderate, used by 34.9% of listings.
- There's a relatively balanced mix between guest-friendly (45.8%) and stricter (45.2%) policies, offering choices for different guest needs.
Recommendations for Hosts
- Consider adopting a Moderate policy to align with the 34.9% market standard in Bath.
- Using a Strict policy might deter some guests, as only 10.9% of listings use it. Evaluate if potential revenue protection outweighs possible lower booking rates.
- Regularly review your cancellation policy against competitors and market demand shifts in Bath.
Bath STR Booking Lead Time Analysis (2026)
Average Booking Lead Time by Month
Booking Lead Time Insights for Bath
- The overall average booking lead time for vacation rentals in Bath is 65 days.
- Guests book furthest in advance for stays during September (average 84 days), likely coinciding with peak travel demand or local events.
- The shortest booking windows occur for stays in February (average 41 days), indicating more last-minute travel plans during this time.
- Seasonally, Summer (74 days avg.) sees the longest lead times, while Winter (56 days avg.) has the shortest, reflecting typical travel planning cycles.
Recommendations for Hosts
- Use the overall average lead time (65 days) as a baseline for your pricing and availability strategy in Bath.
- For September stays, consider implementing length-of-stay discounts or slightly higher rates for bookings made less than 84 days out to capitalize on advance planning.
- Target marketing efforts for the Summer season well in advance (at least 74 days) to capture early planners.
- Monitor your own booking lead times against these Bath averages to identify opportunities for dynamic pricing adjustments.
Popular & Essential Airbnb Amenities in Bath (2026)
Amenity Prevalence
Amenity Insights for Bath
- Essential amenities in Bath that guests expect include: Wifi, Heating. Lacking these (any) could significantly impact bookings.
- Popular amenities like Smoke alarm, TV, Hot water are common but not universal. Offering these can provide a competitive edge.
Recommendations for Hosts
- Ensure your listing includes all essential amenities for Bath: Wifi, Heating.
- Prioritize adding missing essentials: Wifi, Heating.
- Consider adding popular differentiators like Smoke alarm or TV to increase appeal.
- Highlight unique or less common amenities you offer (e.g., hot tub, dedicated workspace, EV charger) in your listing description and photos.
- Regularly check competitor amenities in Bath to stay competitive.
Bath Airbnb Guest Demographics & Profile Analysis (2026)
Guest Profile Summary for Bath
- The typical guest profile for Airbnb in Bath consists of primarily domestic travelers (69%), often arriving from nearby England, typically belonging to the Post-2000s (Gen Z/Alpha) group (50%), primarily speaking English or French.
- Domestic travelers account for 69.1% of guests.
- Key international markets include United Kingdom (69.1%) and United States (12.2%).
- Top languages spoken are English (61.9%) followed by French (9.9%).
- A significant demographic segment is the Post-2000s (Gen Z/Alpha) group, representing 50% of guests.
Recommendations for Hosts
- Target domestic marketing efforts towards travelers from England and London.
- Tailor amenities and listing descriptions to appeal to the dominant Post-2000s (Gen Z/Alpha) demographic (e.g., highlight fast WiFi, smart home features, local guides).
- Highlight unique local experiences or amenities relevant to the primary guest profile.
- Consider seasonal promotions aligned with peak travel times for key origin markets.
Nearby Short-Term Rental Market Comparison
How does the Bath Airbnb market stack up against its neighbors? Compare key performance metrics like average monthly revenue, ADR, and occupancy rates in surrounding areas to understand the broader regional STR landscape.
| Market | Active Properties | Monthly Revenue | Daily Rate | Avg. Occupancy |
|---|---|---|---|---|
| Chew Magna | 13 | $7,041 | $430.65 | 44% |
| Englishcombe | 15 | $6,734 | $511.35 | 53% |
| Lambourn | 11 | $6,499 | $723.41 | 31% |
| East Knoyle | 10 | $6,300 | $407.06 | 44% |
| Long Sutton | 18 | $6,029 | $383.58 | 46% |
| Withington | 10 | $5,690 | $499.79 | 44% |
| Ashley | 13 | $5,497 | $364.68 | 54% |
| Bont-dolgadfan | 10 | $5,458 | $293.24 | 58% |
| Freshford | 12 | $5,333 | $317.81 | 58% |
| Grosmont | 11 | $5,211 | $459.67 | 55% |