Baltonsborough Airbnb Market Analysis 2026: Short Term Rental Data & Vacation Rental Statistics in England, United Kingdom
Is Airbnb profitable in Baltonsborough in 2026? Explore comprehensive Airbnb analytics for Baltonsborough, England, United Kingdom to uncover income potential. This 2026 STR market report for Baltonsborough, based on AirROI data from February 2025 to January 2026, reveals key trends in the niche market of 20 active listings.
Whether you're considering an Airbnb investment in Baltonsborough, optimizing your existing vacation rental, or exploring rental arbitrage opportunities, understanding the Baltonsborough Airbnb data is crucial. Leveraging the low regulation environment is key to maximizing your short term rental income potential. Let's dive into the specifics.
Key Baltonsborough Airbnb Performance Metrics Overview
Monthly Airbnb Revenue Variations & Income Potential in Baltonsborough (2026)
Understanding the monthly revenue variations for Airbnb listings in Baltonsborough is key to maximizing your short term rental income potential. Seasonality significantly impacts earnings. Our analysis, based on data from the past 12 months, shows that the peak revenue month for STRs in Baltonsborough is typically August, while February often presents the lowest earnings, highlighting opportunities for strategic pricing adjustments during shoulder and low seasons. Explore the typical Airbnb income in Baltonsborough across different performance tiers:
- Best-in-class properties (Top 10%) achieve $13,601+ monthly, often utilizing dynamic pricing and superior guest experiences.
- Strong performing properties (Top 25%) earn $4,451 or more, indicating effective management and desirable locations/amenities.
- Typical properties (Median) generate around $2,301 per month, representing the average market performance.
- Entry-level properties (Bottom 25%) see earnings around $1,282, often with potential for optimization.
Average Monthly Airbnb Earnings Trend in Baltonsborough
Baltonsborough Airbnb Occupancy Rate Trends (2026)
Maximize your bookings by understanding the Baltonsborough STR occupancy trends. Seasonal demand shifts significantly influence how often properties are booked. Typically, Augustsees the highest demand (peak season occupancy), while March experiences the lowest (low season). Effective strategies, like adjusting minimum stays or offering promotions, can boost occupancy during slower periods. Here's how different property tiers perform in Baltonsborough:
- Best-in-class properties (Top 10%) achieve 77%+ occupancy, indicating high desirability and potentially optimized availability.
- Strong performing properties (Top 25%) maintain 59% or higher occupancy, suggesting good market fit and guest satisfaction.
- Typical properties (Median) have an occupancy rate around 39%.
- Entry-level properties (Bottom 25%) average 23% occupancy, potentially facing higher vacancy.
Average Monthly Occupancy Rate Trend in Baltonsborough
Average Daily Rate (ADR) Airbnb Trends in Baltonsborough (2026)
Effective short term rental pricing strategy in Baltonsborough involves understanding monthly ADR fluctuations. The Average Daily Rate (ADR) for Airbnb in Baltonsborough typically peaks in December and dips lowest during March. Leveraging Airbnb dynamic pricing tools or strategies based on this seasonality can significantly boost revenue. Here's a look at the typical nightly rates achieved:
- Best-in-class properties (Top 10%) command rates of $1,077+ per night, often due to premium features or locations.
- Strong performing properties (Top 25%) achieve nightly rates of $264 or more.
- Typical properties (Median) charge around $175 per night.
- Entry-level properties (Bottom 25%) earn around $124 per night.
Average Daily Rate (ADR) Trend by Month in Baltonsborough
Get Live Baltonsborough Market Intelligence 👇

Explore Real-time Analytics
Airbnb Seasonality Analysis & Trends in Baltonsborough (2026)
Peak Season (August, September, October)
- Revenue averages $5,885 per month
- Occupancy rates average 48.6%
- Daily rates average $321
Shoulder Season
- Revenue averages $4,391 per month
- Occupancy maintains around 41.9%
- Daily rates hold near $333
Low Season (February, March, April)
- Revenue drops to average $2,490 per month
- Occupancy decreases to average 36.3%
- Daily rates adjust to average $299
Seasonality Insights for Baltonsborough
- The Airbnb seasonality in Baltonsborough shows highly seasonal trends requiring careful strategy. While the sections above show seasonal averages, it's also insightful to look at the extremes:
- During the high season, the absolute peak month showcases Baltonsborough's highest earning potential, with monthly revenues capable of climbing to $6,754, occupancy reaching a high of 61.3%, and ADRs peaking at $381.
- Conversely, the slowest single month of the year, typically falling within the low season, marks the market's lowest point. In this month, revenue might dip to $1,970, occupancy could drop to 30.0%, and ADRs may adjust down to $293.
- Understanding both the seasonal averages and these monthly peaks and troughs in revenue, occupancy, and ADR is crucial for maximizing your Airbnb profit potential in Baltonsborough.
Seasonal Strategies for Maximizing Profit
- Peak Season: Maximize revenue through premium pricing and potentially longer minimum stays. Ensure high availability.
- Low Season: Offer competitive pricing, special promotions (e.g., extended stay discounts), and flexible cancellation policies. Target off-season travelers like remote workers or budget-conscious guests.
- Shoulder Seasons: Implement dynamic pricing that balances peak and low rates. Target weekend travelers or specific events. Offer slightly more flexible terms than peak season.
- Regularly analyze your own performance against these Baltonsborough seasonality benchmarks and adjust your pricing and availability strategy accordingly.
Best Areas for Airbnb Investment in Baltonsborough (2026)
Exploring the top neighborhoods for short-term rentals in Baltonsborough? This section highlights key areas, outlining why they are attractive for hosts and guests, along with notable local attractions. Consider these locations based on your target guest profile and investment strategy.
| Neighborhood / Area | Why Host Here? (Target Guests & Appeal) | Key Attractions & Landmarks |
|---|---|---|
| Glastonbury | Famous for its festival and mystical heritage, attracting visitors seeking music, spirituality, and history. | Glastonbury Tor, Chalice Well, Glastonbury Abbey, Glastonbury Festival, St. Michael's Tower, The White Spring |
| Street | Home to Clarks Village and a variety of shops, appealing to shoppers and tourists alike. | Clarks Village, Street Heritage Centre, Strode Theatre, Strode College, The Shoe Museum |
| Bridgwater | A historic town with rich maritime history, ideal for travelers exploring Somerset and the West Country. | Bridgwater Docks, Bridgwater Arts Centre, Church of St. Mary, Museum of Somerset, The Blake Museum |
| Yeovil | A bustling market town with great transport links, attractive to tourists and business travelers. | Yeovil Town Centre, The Octagon Theatre, Yeovil Country Park, Houndstone, The Haynes International Motor Museum |
| Wells | The smallest city in England known for its stunning cathedral and historic sites, attracting heritage tourism. | Wells Cathedral, The Bishop's Palace, Wells Market Place, Vicars' Hall, Wells and Mendip Museum |
| Frome | A vibrant market town known for its independent shops and arts scene, popular with young creatives and tourists. | Frome Independent Market, Frome Museum, The Merlin Theatre, Catherine Hill, Frome's Historic Town Centre |
| Mendip Hills | An Area of Outstanding Natural Beauty, perfect for outdoor enthusiasts and nature lovers visiting Somerset. | Cheddar Gorge, Ebbor Gorge, Wookey Hole Caves, Sawn Hill, The Somerset Cider Brandy Company |
| Somerton | An ancient market town with a rich history, appealing for those interested in England's medieval past. | Somerton Town Hall, The Buttercross, St. Michael's Church, Somerton Museum, Gubernatorial Gardens |
Understanding Airbnb License Requirements & STR Laws in Baltonsborough (2026)
While Baltonsborough, England, United Kingdom currently shows low STR regulations, specific Airbnb license requirements might still exist or change. Always verify the latest short term rental regulations and Airbnb license requirements directly with local government authorities for Baltonsborough to ensure full compliance before hosting.
(Source: AirROI data, 2026, finding no licensed listings among those analyzed)
Top Performing Airbnb Properties in Baltonsborough (2026)
Benchmark your potential! Explore examples of top-performing Airbnb properties in Baltonsboroughbased on Trailing Twelve Month (TTM) revenue. Analyze their characteristics, revenue, occupancy rate, and ADR to understand what drives success in this market.

Beautiful Country Manor Estate
Entire Place • 7 bedrooms
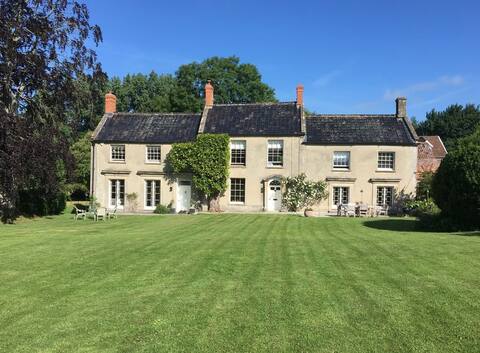
Beautiful country house near Glastonbury, Somerset
Entire Place • 8 bedrooms
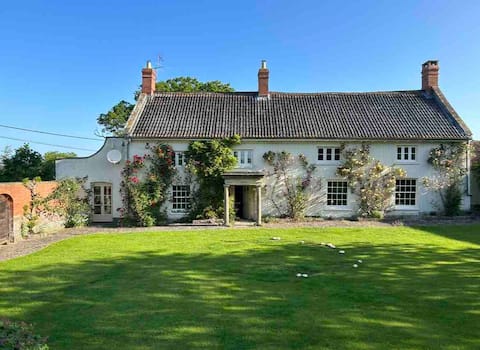
Magnificent Somerset Country Manor House
Entire Place • 6 bedrooms
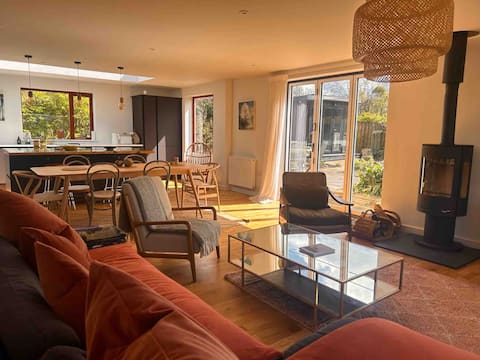
Orchard End
Entire Place • 3 bedrooms

Private cottage full of character near Glastonbury
Entire Place • 3 bedrooms

The Cottage at Brook Farm with EV charger
Entire Place • 3 bedrooms
Note: Performance varies based on location, size, amenities, seasonality, and management quality. Data reflects the past 12 months.
Top Performing Airbnb Hosts in Baltonsborough (2026)
Learn from the best! This table showcases top-performing Airbnb hosts in Baltonsborough based on the number of properties managed and estimated total revenue over the past year. Analyze their scale and performance metrics.
| Host Name | Properties | Grossing Revenue | Stay Reviews | Avg Rating |
|---|---|---|---|---|
| Lydia | 5 | $321,713 | 46 | 4.98/5.0 |
| Amanda | 1 | $166,304 | 90 | 4.99/5.0 |
| Donna | 1 | $43,489 | 29 | 4.90/5.0 |
| Simon | 1 | $43,300 | 183 | 4.96/5.0 |
| Claire | 1 | $42,511 | 52 | 4.88/5.0 |
| Jonathan | 1 | $34,803 | 132 | 4.96/5.0 |
| Libby | 1 | $24,518 | 277 | 4.77/5.0 |
| Michael | 1 | $22,595 | 144 | 4.94/5.0 |
| Claire | 1 | $21,134 | 148 | 4.93/5.0 |
| Grace | 1 | $15,779 | 82 | 4.99/5.0 |
Analyzing the strategies of top hosts, such as their property selection, pricing, and guest communication, can offer valuable lessons for optimizing your own Airbnb operations in Baltonsborough.
Dive Deeper: Advanced Baltonsborough STR Market Data (2026)
Ready to unlock more insights? AirROI provides access to advanced metrics and comprehensive Airbnb data for Baltonsborough. Explore detailed analytics beyond this report to refine your investment strategy, optimize pricing, and maximize your vacation rental profits.
Explore Advanced MetricsBaltonsborough Short-Term Rental Market Composition (2026): Property & Room Types
Room Type Distribution
Property Type Distribution
Market Composition Insights for Baltonsborough
- The Baltonsborough Airbnb market composition is heavily skewed towards Entire Home/Apt listings, which make up 95% of the 20 active rentals. This indicates strong guest preference for privacy and space.
- Looking at the property type distribution in Baltonsborough, House properties are the most common (40%), reflecting the local real estate landscape.
- Houses represent a significant 40% portion, catering likely to families or larger groups.
Baltonsborough Airbnb Room Capacity Analysis (2026): Bedroom Distribution
Distribution of Listings by Number of Bedrooms
Room Capacity Insights for Baltonsborough
- The dominant room capacity in Baltonsborough is 1 bedroom listings, making up 25% of the market. This suggests a strong demand for properties suitable for couples or solo travelers.
- Together, 1 bedroom and 3 bedrooms properties represent 50.0% of the active Airbnb listings in Baltonsborough, indicating a high concentration in these sizes.
- A significant 40.0% of listings offer 3+ bedrooms, catering to larger groups and families seeking more space in Baltonsborough.
Baltonsborough Vacation Rental Guest Capacity Trends (2026)
Distribution of Listings by Guest Capacity
Guest Capacity Insights for Baltonsborough
- The most common guest capacity trend in Baltonsborough vacation rentals is listings accommodating 6 guests (25%). This suggests the primary traveler segment is likely larger groups.
- Properties designed for 6 guests and 4 guests dominate the Baltonsborough STR market, accounting for 45.0% of listings.
- 40.0% of properties accommodate 6+ guests, serving the market segment for larger families or group travel in Baltonsborough.
- On average, properties in Baltonsborough are equipped to host 4.5 guests.
Baltonsborough Airbnb Booking Patterns (2026): Available vs. Booked Days
Available Days Distribution
Booked Days Distribution
Booking Pattern Insights for Baltonsborough
- The most common availability pattern in Baltonsborough falls within the 271-366 days range, representing 40% of listings. This suggests many properties have significant open periods on their calendars.
- Approximately 80.0% of listings show high availability (181+ days open annually), indicating potential for increased bookings or specific owner usage patterns.
- For booked days, the 91-180 days range is most frequent in Baltonsborough (40%), reflecting common guest stay durations or potential owner blocking patterns.
- A notable 20.0% of properties secure long booking periods (181+ days booked per year), highlighting successful long-term rental strategies or significant owner usage.
Baltonsborough Airbnb Minimum Stay Requirements Analysis
Distribution of Listings by Minimum Night Requirement
1 Night
5 listings
25% of total
2 Nights
11 listings
55% of total
30+ Nights
4 listings
20% of total
Key Insights
- The most prevalent minimum stay requirement in Baltonsborough is 2 Nights, adopted by 55% of listings. This highlights the market's preference for shorter, flexible bookings.
- A strong majority (80.0%) of the Baltonsborough Airbnb data shows acceptance of very short stays (1-2 nights), indicating a dynamic, high-turnover market.
- A significant segment (20%) caters to monthly stays (30+ nights) in Baltonsborough, pointing to opportunities in the extended-stay market.
Recommendations
- Align with the market by considering a 2 Nights minimum stay, as 55% of Baltonsborough hosts use this setting.
- If feasible, allowing 1-night stays, especially midweek or during low season, could capture last-minute bookings, as only 25% currently do.
- Explore offering discounts for stays of 30+ nights to attract the 20% of the market seeking extended stays.
- Adjust minimum nights based on seasonality – potentially shorter during low season and longer during peak demand periods in Baltonsborough.
Baltonsborough Airbnb Cancellation Policy Trends Analysis (2026)
Super Strict 60 Days
1 listings
5% of total
Flexible
1 listings
5% of total
Moderate
6 listings
30% of total
Firm
3 listings
15% of total
Strict
9 listings
45% of total
Cancellation Policy Insights for Baltonsborough
- The prevailing Airbnb cancellation policy trend in Baltonsborough is Strict, used by 45% of listings.
- A majority (60.0%) of hosts in Baltonsborough utilize Firm or Strict policies, indicating a market where hosts prioritize booking security.
Recommendations for Hosts
- Consider adopting a Strict policy to align with the 45% market standard in Baltonsborough.
- With 45% using Strict terms, this is a viable option in Baltonsborough, particularly for high-value properties or during peak demand periods.
- Regularly review your cancellation policy against competitors and market demand shifts in Baltonsborough.
Baltonsborough STR Booking Lead Time Analysis (2026)
Average Booking Lead Time by Month
Booking Lead Time Insights for Baltonsborough
- The overall average booking lead time for vacation rentals in Baltonsborough is 65 days.
- Guests book furthest in advance for stays during June (average 92 days), likely coinciding with peak travel demand or local events.
- The shortest booking windows occur for stays in February (average 42 days), indicating more last-minute travel plans during this time.
- Seasonally, Summer (72 days avg.) sees the longest lead times, while Winter (53 days avg.) has the shortest, reflecting typical travel planning cycles.
Recommendations for Hosts
- Use the overall average lead time (65 days) as a baseline for your pricing and availability strategy in Baltonsborough.
- For June stays, consider implementing length-of-stay discounts or slightly higher rates for bookings made less than 92 days out to capitalize on advance planning.
- Target marketing efforts for the Summer season well in advance (at least 72 days) to capture early planners.
- Monitor your own booking lead times against these Baltonsborough averages to identify opportunities for dynamic pricing adjustments.
Popular & Essential Airbnb Amenities in Baltonsborough (2026)
Amenity Prevalence
Amenity Insights for Baltonsborough
- Essential amenities in Baltonsborough that guests expect include: Free parking on premises. Lacking these (this) could significantly impact bookings.
- Popular amenities like Heating, TV, Cooking basics are common but not universal. Offering these can provide a competitive edge.
- Warning: Wifi is not universally provided but is considered essential globally. Ensure reliable Wifi is offered.
Recommendations for Hosts
- Ensure your listing includes all essential amenities for Baltonsborough: Free parking on premises.
- Consider adding popular differentiators like Heating or TV to increase appeal.
- Highlight unique or less common amenities you offer (e.g., hot tub, dedicated workspace, EV charger) in your listing description and photos.
- Regularly check competitor amenities in Baltonsborough to stay competitive.
Baltonsborough Airbnb Guest Demographics & Profile Analysis (2026)
Guest Profile Summary for Baltonsborough
- The typical guest profile for Airbnb in Baltonsborough consists of primarily domestic travelers (88%), often arriving from nearby England, typically belonging to the Post-2000s (Gen Z/Alpha) group (50%), primarily speaking English or French.
- Domestic travelers account for 88.0% of guests.
- Key international markets include United Kingdom (88%) and United States (3.8%).
- Top languages spoken are English (71.8%) followed by French (9.9%).
- A significant demographic segment is the Post-2000s (Gen Z/Alpha) group, representing 50% of guests.
Recommendations for Hosts
- Target domestic marketing efforts towards travelers from England and London.
- Tailor amenities and listing descriptions to appeal to the dominant Post-2000s (Gen Z/Alpha) demographic (e.g., highlight fast WiFi, smart home features, local guides).
- Highlight unique local experiences or amenities relevant to the primary guest profile.
- Consider seasonal promotions aligned with peak travel times for key origin markets.
Nearby Short-Term Rental Market Comparison
How does the Baltonsborough Airbnb market stack up against its neighbors? Compare key performance metrics like average monthly revenue, ADR, and occupancy rates in surrounding areas to understand the broader regional STR landscape.
| Market | Active Properties | Monthly Revenue | Daily Rate | Avg. Occupancy |
|---|---|---|---|---|
| Chew Magna | 13 | $7,041 | $430.65 | 44% |
| Englishcombe | 15 | $6,734 | $511.35 | 53% |
| Lambourn | 11 | $6,499 | $723.41 | 31% |
| East Knoyle | 10 | $6,300 | $407.06 | 44% |
| Long Sutton | 18 | $6,029 | $383.58 | 46% |
| Withington | 10 | $5,690 | $499.79 | 44% |
| Ashley | 13 | $5,497 | $364.68 | 54% |
| Bont-dolgadfan | 10 | $5,458 | $293.24 | 58% |
| Freshford | 12 | $5,333 | $317.81 | 58% |
| Grosmont | 11 | $5,211 | $459.67 | 55% |