Ashford Airbnb Market Analysis 2026: Short Term Rental Data & Vacation Rental Statistics in England, United Kingdom
Is Airbnb profitable in Ashford in 2026? Explore comprehensive Airbnb analytics for Ashford, England, United Kingdom to uncover income potential. This 2026 STR market report for Ashford, based on AirROI data from February 2025 to January 2026, reveals key trends in the market of 438 active listings.
Whether you're considering an Airbnb investment in Ashford, optimizing your existing vacation rental, or exploring rental arbitrage opportunities, understanding the Ashford Airbnb data is crucial. Leveraging the low regulation environment is key to maximizing your short term rental income potential. Let's dive into the specifics.
Key Ashford Airbnb Performance Metrics Overview
Monthly Airbnb Revenue Variations & Income Potential in Ashford (2026)
Understanding the monthly revenue variations for Airbnb listings in Ashford is key to maximizing your short term rental income potential. Seasonality significantly impacts earnings. Our analysis, based on data from the past 12 months, shows that the peak revenue month for STRs in Ashford is typically August, while January often presents the lowest earnings, highlighting opportunities for strategic pricing adjustments during shoulder and low seasons. Explore the typical Airbnb income in Ashford across different performance tiers:
- Best-in-class properties (Top 10%) achieve $6,152+ monthly, often utilizing dynamic pricing and superior guest experiences.
- Strong performing properties (Top 25%) earn $3,756 or more, indicating effective management and desirable locations/amenities.
- Typical properties (Median) generate around $2,260 per month, representing the average market performance.
- Entry-level properties (Bottom 25%) see earnings around $1,094, often with potential for optimization.
Average Monthly Airbnb Earnings Trend in Ashford
Ashford Airbnb Occupancy Rate Trends (2026)
Maximize your bookings by understanding the Ashford STR occupancy trends. Seasonal demand shifts significantly influence how often properties are booked. Typically, Augustsees the highest demand (peak season occupancy), while January experiences the lowest (low season). Effective strategies, like adjusting minimum stays or offering promotions, can boost occupancy during slower periods. Here's how different property tiers perform in Ashford:
- Best-in-class properties (Top 10%) achieve 82%+ occupancy, indicating high desirability and potentially optimized availability.
- Strong performing properties (Top 25%) maintain 64% or higher occupancy, suggesting good market fit and guest satisfaction.
- Typical properties (Median) have an occupancy rate around 42%.
- Entry-level properties (Bottom 25%) average 21% occupancy, potentially facing higher vacancy.
Average Monthly Occupancy Rate Trend in Ashford
Average Daily Rate (ADR) Airbnb Trends in Ashford (2026)
Effective short term rental pricing strategy in Ashford involves understanding monthly ADR fluctuations. The Average Daily Rate (ADR) for Airbnb in Ashford typically peaks in July and dips lowest during March. Leveraging Airbnb dynamic pricing tools or strategies based on this seasonality can significantly boost revenue. Here's a look at the typical nightly rates achieved:
- Best-in-class properties (Top 10%) command rates of $449+ per night, often due to premium features or locations.
- Strong performing properties (Top 25%) achieve nightly rates of $249 or more.
- Typical properties (Median) charge around $168 per night.
- Entry-level properties (Bottom 25%) earn around $127 per night.
Average Daily Rate (ADR) Trend by Month in Ashford
Get Live Ashford Market Intelligence 👇

Explore Real-time Analytics
Airbnb Seasonality Analysis & Trends in Ashford (2026)
Peak Season (August, July, September)
- Revenue averages $4,242 per month
- Occupancy rates average 54.1%
- Daily rates average $263
Shoulder Season
- Revenue averages $3,108 per month
- Occupancy maintains around 42.6%
- Daily rates hold near $250
Low Season (January, February, March)
- Revenue drops to average $2,321 per month
- Occupancy decreases to average 35.5%
- Daily rates adjust to average $235
Seasonality Insights for Ashford
- The Airbnb seasonality in Ashford shows highly seasonal trends requiring careful strategy. While the sections above show seasonal averages, it's also insightful to look at the extremes:
- During the high season, the absolute peak month showcases Ashford's highest earning potential, with monthly revenues capable of climbing to $4,661, occupancy reaching a high of 57.7%, and ADRs peaking at $265.
- Conversely, the slowest single month of the year, typically falling within the low season, marks the market's lowest point. In this month, revenue might dip to $2,054, occupancy could drop to 27.4%, and ADRs may adjust down to $226.
- Understanding both the seasonal averages and these monthly peaks and troughs in revenue, occupancy, and ADR is crucial for maximizing your Airbnb profit potential in Ashford.
Seasonal Strategies for Maximizing Profit
- Peak Season: Maximize revenue through premium pricing and potentially longer minimum stays. Ensure high availability.
- Low Season: Offer competitive pricing, special promotions (e.g., extended stay discounts), and flexible cancellation policies. Target off-season travelers like remote workers or budget-conscious guests.
- Shoulder Seasons: Implement dynamic pricing that balances peak and low rates. Target weekend travelers or specific events. Offer slightly more flexible terms than peak season.
- Regularly analyze your own performance against these Ashford seasonality benchmarks and adjust your pricing and availability strategy accordingly.
Best Areas for Airbnb Investment in Ashford (2026)
Exploring the top neighborhoods for short-term rentals in Ashford? This section highlights key areas, outlining why they are attractive for hosts and guests, along with notable local attractions. Consider these locations based on your target guest profile and investment strategy.
| Neighborhood / Area | Why Host Here? (Target Guests & Appeal) | Key Attractions & Landmarks |
|---|---|---|
| Ashford Town Centre | The heart of Ashford, offering a variety of shops, dining, and nightlife options. Close to Ashford International train station with connections to London and Europe, making it ideal for business and leisure travelers. | Ashford Designer Outlet, Godinton House and Gardens, St Mary the Virgin Church, Ashford Museum, Victoria Park |
| Willesborough | A residential area with a family-friendly atmosphere. It's near the Ashford Common and offers green spaces, making it attractive for visitors looking for a quieter stay while still being close to the town centre. | Willesborough Windmill, Conningbrook Lake, Ashford Golf Club |
| Repton Park | A modern neighbourhood with excellent amenities including parks and family facilities. Popular for its community vibe and proximity to the town's services and schools, suitable for longer stays. | Repton Park, Local parks and playgrounds |
| Kingsnorth | A suburban area with a mix of residential properties and open spaces. It provides a peaceful setting while being accessible to nearby attractions and the town centre, appealing to families and business travelers alike. | Kingsnorth Village, Local nature spots |
| Godmersham | A quaint village close to Ashford known for its picturesque landscapes and historical buildings. Ideal for guests seeking a rural retreat while being a short drive from the town amenities. | Godmersham Park, St Lawrence Church, Scenic walking trails |
| Highworth | A small town nearby Ashford with its charming historical architecture and local shops. Offers a unique experience compared to urban settings, providing a peaceful escape for visitors. | Highworth Water Tower, Local markets, Historical sites |
| Kennington | A suburb of Ashford that combines convenience and tranquility. It's close to Ashford's main attractions and offers a suburban experience with local shops and parks. | Kennington Park, Local eateries and shops |
| Charing | A picturesque village that provides a charming countryside experience. Popular among those looking for a serene environment while still being able to access Ashford easily. | Charing Church, Local walks, Village charm |
Understanding Airbnb License Requirements & STR Laws in Ashford (2026)
While Ashford, England, United Kingdom currently shows low STR regulations, specific Airbnb license requirements might still exist or change. Always verify the latest short term rental regulations and Airbnb license requirements directly with local government authorities for Ashford to ensure full compliance before hosting.
(Source: AirROI data, 2026, based on 1% licensed listings)
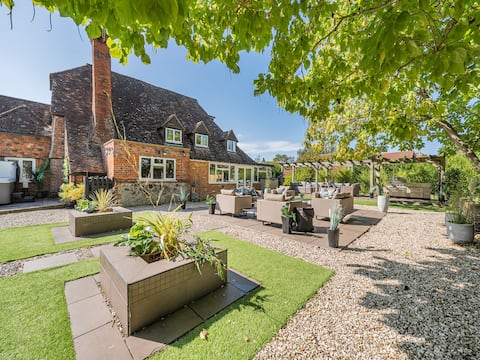
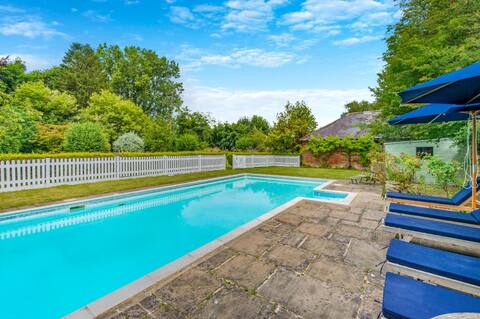
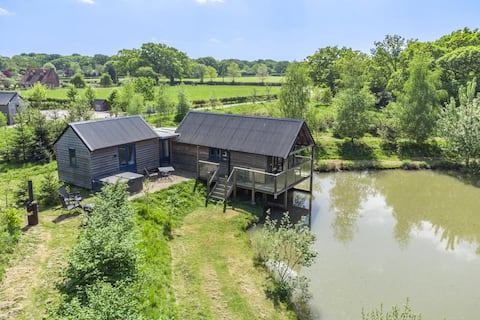
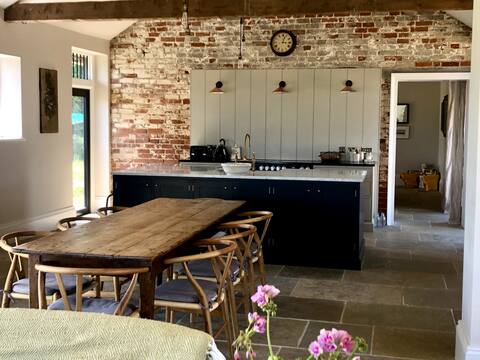
Top Performing Airbnb Properties in Ashford (2026)
Benchmark your potential! Explore examples of top-performing Airbnb properties in Ashfordbased on Trailing Twelve Month (TTM) revenue. Analyze their characteristics, revenue, occupancy rate, and ADR to understand what drives success in this market.
Yew Tree Farm
Entire Place • 5 bedrooms
6 Bed in Appledore (oc-t27531)
Entire Place • 6 bedrooms

The Hideaway at Southfield Barn
Entire Place • 4 bedrooms
1 Bed in Biddenden (oc-cb670)
Entire Place • 1 bedroom
Beautiful 4 Bedroom Pet Friendly Georgian Stables
Entire Place • 4 bedrooms

Farmhouse Fabulous rural location
Entire Place • 9 bedrooms
Note: Performance varies based on location, size, amenities, seasonality, and management quality. Data reflects the past 12 months.
Top Performing Airbnb Hosts in Ashford (2026)
Learn from the best! This table showcases top-performing Airbnb hosts in Ashford based on the number of properties managed and estimated total revenue over the past year. Analyze their scale and performance metrics.
| Host Name | Properties | Grossing Revenue | Stay Reviews | Avg Rating |
|---|---|---|---|---|
| Cottages | 28 | $1,576,949 | 388 | 4.84/5.0 |
| Original Cottages Kent & Susse | 25 | $1,524,125 | 142 | 4.76/5.0 |
| George | 7 | $381,887 | 143 | 4.74/5.0 |
| Sammy | 1 | $289,401 | 14 | 5.00/5.0 |
| My Property Host | 13 | $287,689 | 317 | 4.52/5.0 |
| Tony | 4 | $239,887 | 79 | 4.92/5.0 |
| Jacqueline | 7 | $187,725 | 594 | 4.87/5.0 |
| Andrew | 3 | $186,218 | 370 | 4.96/5.0 |
| Patricia | 1 | $135,788 | 72 | 5.00/5.0 |
| Bloom Stays | 10 | $129,793 | 201 | 4.86/5.0 |
Analyzing the strategies of top hosts, such as their property selection, pricing, and guest communication, can offer valuable lessons for optimizing your own Airbnb operations in Ashford.
Dive Deeper: Advanced Ashford STR Market Data (2026)
Ready to unlock more insights? AirROI provides access to advanced metrics and comprehensive Airbnb data for Ashford. Explore detailed analytics beyond this report to refine your investment strategy, optimize pricing, and maximize your vacation rental profits.
Explore Advanced MetricsAshford Short-Term Rental Market Composition (2026): Property & Room Types
Room Type Distribution
Property Type Distribution
Market Composition Insights for Ashford
- The Ashford Airbnb market composition is heavily skewed towards Entire Home/Apt listings, which make up 90.6% of the 438 active rentals. This indicates strong guest preference for privacy and space.
- Looking at the property type distribution in Ashford, House properties are the most common (55.9%), reflecting the local real estate landscape.
- Houses represent a significant 55.9% portion, catering likely to families or larger groups.
- The presence of 9.6% Hotel/Boutique listings indicates integration with traditional hospitality.
Ashford Airbnb Room Capacity Analysis (2026): Bedroom Distribution
Distribution of Listings by Number of Bedrooms
Room Capacity Insights for Ashford
- The dominant room capacity in Ashford is 1 bedroom listings, making up 40.2% of the market. This suggests a strong demand for properties suitable for couples or solo travelers.
- Together, 1 bedroom and 2 bedrooms properties represent 68.1% of the active Airbnb listings in Ashford, indicating a high concentration in these sizes.
- A significant 22.9% of listings offer 3+ bedrooms, catering to larger groups and families seeking more space in Ashford.
Ashford Vacation Rental Guest Capacity Trends (2026)
Distribution of Listings by Guest Capacity
Guest Capacity Insights for Ashford
- The most common guest capacity trend in Ashford vacation rentals is listings accommodating 2 guests (31.3%). This suggests the primary traveler segment is likely couples or solo travelers.
- Properties designed for 2 guests and 4 guests dominate the Ashford STR market, accounting for 58.2% of listings.
- 24.0% of properties accommodate 6+ guests, serving the market segment for larger families or group travel in Ashford.
- On average, properties in Ashford are equipped to host 3.8 guests.
Ashford Airbnb Booking Patterns (2026): Available vs. Booked Days
Available Days Distribution
Booked Days Distribution
Booking Pattern Insights for Ashford
- The most common availability pattern in Ashford falls within the 271-366 days range, representing 41.1% of listings. This suggests many properties have significant open periods on their calendars.
- Approximately 75.6% of listings show high availability (181+ days open annually), indicating potential for increased bookings or specific owner usage patterns.
- For booked days, the 91-180 days range is most frequent in Ashford (34.2%), reflecting common guest stay durations or potential owner blocking patterns.
- A notable 25.8% of properties secure long booking periods (181+ days booked per year), highlighting successful long-term rental strategies or significant owner usage.
Ashford Airbnb Minimum Stay Requirements Analysis
Distribution of Listings by Minimum Night Requirement
1 Night
105 listings
24% of total
2 Nights
157 listings
35.8% of total
3 Nights
26 listings
5.9% of total
4-6 Nights
3 listings
0.7% of total
7-29 Nights
6 listings
1.4% of total
30+ Nights
141 listings
32.2% of total
Key Insights
- The most prevalent minimum stay requirement in Ashford is 2 Nights, adopted by 35.8% of listings. This highlights the market's preference for shorter, flexible bookings.
- A significant segment (32.2%) caters to monthly stays (30+ nights) in Ashford, pointing to opportunities in the extended-stay market.
Recommendations
- Align with the market by considering a 2 Nights minimum stay, as 35.8% of Ashford hosts use this setting.
- If feasible, allowing 1-night stays, especially midweek or during low season, could capture last-minute bookings, as only 24% currently do.
- Explore offering discounts for stays of 30+ nights to attract the 32.2% of the market seeking extended stays.
- Adjust minimum nights based on seasonality – potentially shorter during low season and longer during peak demand periods in Ashford.
Ashford Airbnb Cancellation Policy Trends Analysis (2026)
Non-refundable
1 listings
0.2% of total
Refundable
2 listings
0.5% of total
Super Strict 60 Days
65 listings
14.9% of total
Super Strict 30 Days
15 listings
3.4% of total
Limited
1 listings
0.2% of total
Flexible
97 listings
22.2% of total
Moderate
113 listings
25.9% of total
Firm
110 listings
25.2% of total
Strict
33 listings
7.6% of total
Cancellation Policy Insights for Ashford
- The prevailing Airbnb cancellation policy trend in Ashford is Moderate, used by 25.9% of listings.
- There's a relatively balanced mix between guest-friendly (48.1%) and stricter (32.8%) policies, offering choices for different guest needs.
- Strict cancellation policies are quite rare (7.6%), potentially making listings with this policy less competitive unless justified by high demand or property type.
Recommendations for Hosts
- Consider adopting a Moderate policy to align with the 25.9% market standard in Ashford.
- Using a Strict policy might deter some guests, as only 7.6% of listings use it. Evaluate if potential revenue protection outweighs possible lower booking rates.
- Regularly review your cancellation policy against competitors and market demand shifts in Ashford.
Ashford STR Booking Lead Time Analysis (2026)
Average Booking Lead Time by Month
Booking Lead Time Insights for Ashford
- The overall average booking lead time for vacation rentals in Ashford is 58 days.
- Guests book furthest in advance for stays during August (average 76 days), likely coinciding with peak travel demand or local events.
- The shortest booking windows occur for stays in February (average 35 days), indicating more last-minute travel plans during this time.
- Seasonally, Summer (71 days avg.) sees the longest lead times, while Winter (50 days avg.) has the shortest, reflecting typical travel planning cycles.
Recommendations for Hosts
- Use the overall average lead time (58 days) as a baseline for your pricing and availability strategy in Ashford.
- For August stays, consider implementing length-of-stay discounts or slightly higher rates for bookings made less than 76 days out to capitalize on advance planning.
- Target marketing efforts for the Summer season well in advance (at least 71 days) to capture early planners.
- Monitor your own booking lead times against these Ashford averages to identify opportunities for dynamic pricing adjustments.
Popular & Essential Airbnb Amenities in Ashford (2026)
Amenity Prevalence
Amenity Insights for Ashford
- Essential amenities in Ashford that guests expect include: Smoke alarm. Lacking these (this) could significantly impact bookings.
- Popular amenities like Heating, Wifi, Kitchen are common but not universal. Offering these can provide a competitive edge.
- Warning: Wifi is not universally provided but is considered essential globally. Ensure reliable Wifi is offered.
Recommendations for Hosts
- Ensure your listing includes all essential amenities for Ashford: Smoke alarm.
- Prioritize adding missing essentials: Smoke alarm.
- Consider adding popular differentiators like Heating or Wifi to increase appeal.
- Highlight unique or less common amenities you offer (e.g., hot tub, dedicated workspace, EV charger) in your listing description and photos.
- Regularly check competitor amenities in Ashford to stay competitive.
Ashford Airbnb Guest Demographics & Profile Analysis (2026)
Guest Profile Summary for Ashford
- The typical guest profile for Airbnb in Ashford consists of primarily domestic travelers (84%), often arriving from nearby England, typically belonging to the Post-2000s (Gen Z/Alpha) group (50%), primarily speaking English or French.
- Domestic travelers account for 84.4% of guests.
- Key international markets include United Kingdom (84.4%) and Netherlands (2.6%).
- Top languages spoken are English (62.2%) followed by French (11.1%).
- A significant demographic segment is the Post-2000s (Gen Z/Alpha) group, representing 50% of guests.
Recommendations for Hosts
- Target domestic marketing efforts towards travelers from England and London.
- Tailor amenities and listing descriptions to appeal to the dominant Post-2000s (Gen Z/Alpha) demographic (e.g., highlight fast WiFi, smart home features, local guides).
- Highlight unique local experiences or amenities relevant to the primary guest profile.
- Consider seasonal promotions aligned with peak travel times for key origin markets.
Nearby Short-Term Rental Market Comparison
How does the Ashford Airbnb market stack up against its neighbors? Compare key performance metrics like average monthly revenue, ADR, and occupancy rates in surrounding areas to understand the broader regional STR landscape.
| Market | Active Properties | Monthly Revenue | Daily Rate | Avg. Occupancy |
|---|---|---|---|---|
| Dorney | 11 | $7,510 | $743.63 | 39% |
| Wraysbury | 16 | $6,199 | $530.56 | 49% |
| City of Westminster | 1,424 | $6,053 | $515.72 | 50% |
| Old Windsor | 20 | $4,177 | $286.69 | 49% |
| Cookham | 20 | $4,138 | $347.79 | 47% |
| Bourne End | 10 | $4,086 | $496.86 | 46% |
| City of London | 242 | $3,522 | $340.82 | 47% |
| Roedean | 52 | $3,379 | $273.40 | 45% |
| Marlow | 47 | $3,134 | $215.87 | 57% |
| Hambleden | 16 | $3,126 | $272.31 | 39% |