Palmela Airbnb Market Analysis 2026: Short Term Rental Data & Vacation Rental Statistics in Setúbal, Portugal
Is Airbnb profitable in Palmela in 2026? Explore comprehensive Airbnb analytics for Palmela, Setúbal, Portugal to uncover income potential. This 2026 STR market report for Palmela, based on AirROI data from February 2025 to January 2026, reveals key trends in the niche market of 176 active listings.
Whether you're considering an Airbnb investment in Palmela, optimizing your existing vacation rental, or exploring rental arbitrage opportunities, understanding the Palmela Airbnb data is crucial. Navigating the high regulation landscape is key to maximizing your short term rental income potential. Let's dive into the specifics.
Key Palmela Airbnb Performance Metrics Overview
Monthly Airbnb Revenue Variations & Income Potential in Palmela (2026)
Understanding the monthly revenue variations for Airbnb listings in Palmela is key to maximizing your short term rental income potential. Seasonality significantly impacts earnings. Our analysis, based on data from the past 12 months, shows that the peak revenue month for STRs in Palmela is typically August, while January often presents the lowest earnings, highlighting opportunities for strategic pricing adjustments during shoulder and low seasons. Explore the typical Airbnb income in Palmela across different performance tiers:
- Best-in-class properties (Top 10%) achieve $5,373+ monthly, often utilizing dynamic pricing and superior guest experiences.
- Strong performing properties (Top 25%) earn $2,494 or more, indicating effective management and desirable locations/amenities.
- Typical properties (Median) generate around $1,210 per month, representing the average market performance.
- Entry-level properties (Bottom 25%) see earnings around $574, often with potential for optimization.
Average Monthly Airbnb Earnings Trend in Palmela
Palmela Airbnb Occupancy Rate Trends (2026)
Maximize your bookings by understanding the Palmela STR occupancy trends. Seasonal demand shifts significantly influence how often properties are booked. Typically, Augustsees the highest demand (peak season occupancy), while January experiences the lowest (low season). Effective strategies, like adjusting minimum stays or offering promotions, can boost occupancy during slower periods. Here's how different property tiers perform in Palmela:
- Best-in-class properties (Top 10%) achieve 70%+ occupancy, indicating high desirability and potentially optimized availability.
- Strong performing properties (Top 25%) maintain 50% or higher occupancy, suggesting good market fit and guest satisfaction.
- Typical properties (Median) have an occupancy rate around 30%.
- Entry-level properties (Bottom 25%) average 13% occupancy, potentially facing higher vacancy.
Average Monthly Occupancy Rate Trend in Palmela
Average Daily Rate (ADR) Airbnb Trends in Palmela (2026)
Effective short term rental pricing strategy in Palmela involves understanding monthly ADR fluctuations. The Average Daily Rate (ADR) for Airbnb in Palmela typically peaks in August and dips lowest during February. Leveraging Airbnb dynamic pricing tools or strategies based on this seasonality can significantly boost revenue. Here's a look at the typical nightly rates achieved:
- Best-in-class properties (Top 10%) command rates of $465+ per night, often due to premium features or locations.
- Strong performing properties (Top 25%) achieve nightly rates of $267 or more.
- Typical properties (Median) charge around $128 per night.
- Entry-level properties (Bottom 25%) earn around $86 per night.
Average Daily Rate (ADR) Trend by Month in Palmela
Get Live Palmela Market Intelligence 👇

Explore Real-time Analytics
Airbnb Seasonality Analysis & Trends in Palmela (2026)
Peak Season (August, July, September)
- Revenue averages $3,894 per month
- Occupancy rates average 47.7%
- Daily rates average $261
Shoulder Season
- Revenue averages $1,936 per month
- Occupancy maintains around 31.8%
- Daily rates hold near $228
Low Season (January, February, March)
- Revenue drops to average $1,022 per month
- Occupancy decreases to average 23.3%
- Daily rates adjust to average $216
Seasonality Insights for Palmela
- The Airbnb seasonality in Palmela shows highly seasonal trends requiring careful strategy. While the sections above show seasonal averages, it's also insightful to look at the extremes:
- During the high season, the absolute peak month showcases Palmela's highest earning potential, with monthly revenues capable of climbing to $4,722, occupancy reaching a high of 54.6%, and ADRs peaking at $267.
- Conversely, the slowest single month of the year, typically falling within the low season, marks the market's lowest point. In this month, revenue might dip to $952, occupancy could drop to 16.4%, and ADRs may adjust down to $207.
- Understanding both the seasonal averages and these monthly peaks and troughs in revenue, occupancy, and ADR is crucial for maximizing your Airbnb profit potential in Palmela.
Seasonal Strategies for Maximizing Profit
- Peak Season: Maximize revenue through premium pricing and potentially longer minimum stays. Ensure high availability.
- Low Season: Offer competitive pricing, special promotions (e.g., extended stay discounts), and flexible cancellation policies. Target off-season travelers like remote workers or budget-conscious guests.
- Shoulder Seasons: Implement dynamic pricing that balances peak and low rates. Target weekend travelers or specific events. Offer slightly more flexible terms than peak season.
- Regularly analyze your own performance against these Palmela seasonality benchmarks and adjust your pricing and availability strategy accordingly.
Best Areas for Airbnb Investment in Palmela (2026)
Exploring the top neighborhoods for short-term rentals in Palmela? This section highlights key areas, outlining why they are attractive for hosts and guests, along with notable local attractions. Consider these locations based on your target guest profile and investment strategy.
| Neighborhood / Area | Why Host Here? (Target Guests & Appeal) | Key Attractions & Landmarks |
|---|---|---|
| Palmela Castle | Historic castle offering panoramic views and rich cultural heritage. Attracts tourists interested in history and architecture, as well as those looking for scenic spots for relaxation. | Palmela Castle, Convento de Nossa Senhora da Graça, Palácio dos Aguiar |
| Lisbon Wine Region | Famous for its vineyards and wine production; ideal for wine lovers and those seeking a rural escape. Perfect for hosting wine tours and tastings. | Quinta do Kabrito, Adega José Maria da Fonseca, Wine cellars of Setúbal |
| Arrábida Natural Park | Stunning natural park with beautiful landscapes, beaches, and hiking trails. Great for nature enthusiasts and outdoor activities. | Praia dos Galápos, Praia da Figueirinha, Pico do Formoso, Hiking trails |
| Troia Peninsula | Known for its beautiful beaches and golf courses, popular among tourists for summer vacations and nature activities. | Troia Beach, Troia Golf, Roman ruins of Troia |
| Setúbal City | A vibrant city known for its seafood, culture, and proximity to nature. Appeals to both tourists and locals looking for a lively atmosphere. | Livramento Market, Setúbal's waterfront, São Filipe Castle |
| Sesimbra | Charming coastal town with beautiful beaches and a picturesque marina. Ideal for those seeking a relaxing beach getaway. | Sesimbra Castle, Praia da California, Marine Reserve |
| Cabo Espichel | Dramatic cliffs and stunning views over the Atlantic Ocean, rich in natural beauty and an important pilgrimage site. | Cabo Espichel Sanctuary, Lighthouse, Ocean views |
| Palmela Village | A quaint village atmosphere with traditional Portuguese architecture and local experiences. Attracts visitors interested in experiencing authentic Portugal. | Church of Santa Maria, Local artisan shops, Scenic viewpoints |
Understanding Airbnb License Requirements & STR Laws in Palmela (2026)
Yes, Palmela, Setúbal, Portugal enforces high STR regulations. Obtaining a license and ensuring compliance is almost certainly required according to current 2026 STR laws. Always verify the latest short term rental regulations and Airbnb license requirements directly with local government authorities for Palmela to ensure full compliance before hosting.
(Source: AirROI data, 2026, based on 80% licensed listings)
Top Performing Airbnb Properties in Palmela (2026)
Benchmark your potential! Explore examples of top-performing Airbnb properties in Palmelabased on Trailing Twelve Month (TTM) revenue. Analyze their characteristics, revenue, occupancy rate, and ADR to understand what drives success in this market.

Charming Villa w/pool & Soccer field @30min Lisbon
Entire Place • 10 bedrooms
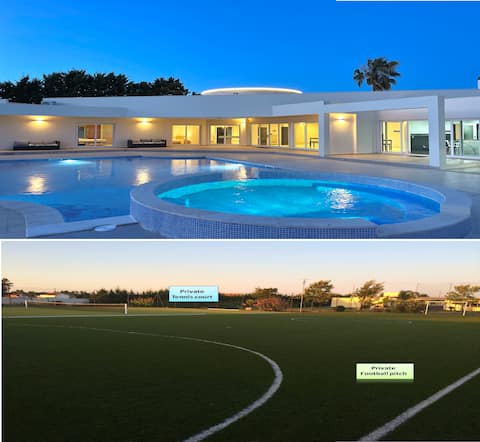
@luxvillaspt - Football pitch+tennis+2 pools+Chef
Entire Place • 8 bedrooms

Lovely Farm with Pool @30min Lisbon and beaches
Entire Place • 9 bedrooms
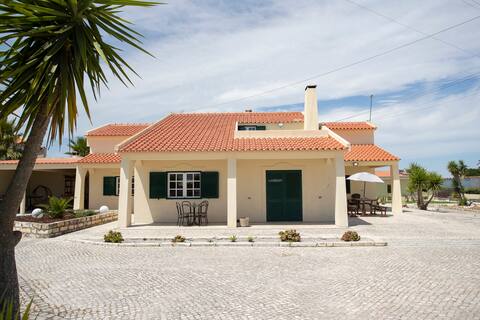
Vacation home with pool, 50 minutes from Lisbon
Entire Place • 9 bedrooms

Vacation home with pool in Palmela
Entire Place • 9 bedrooms

Portuguese Luxury Villa
Entire Place • 7 bedrooms
Note: Performance varies based on location, size, amenities, seasonality, and management quality. Data reflects the past 12 months.
Top Performing Airbnb Hosts in Palmela (2026)
Learn from the best! This table showcases top-performing Airbnb hosts in Palmela based on the number of properties managed and estimated total revenue over the past year. Analyze their scale and performance metrics.
| Host Name | Properties | Grossing Revenue | Stay Reviews | Avg Rating |
|---|---|---|---|---|
| Carlos & Vânia | 2 | $315,412 | 245 | 4.91/5.0 |
| Paulo | 1 | $194,368 | 7 | 4.86/5.0 |
| Susana | 2 | $173,567 | 60 | 4.72/5.0 |
| Holidu | 4 | $110,003 | 55 | 4.86/5.0 |
| BnBird Homes Lda | 13 | $97,531 | 56 | 4.87/5.0 |
| Luís | 1 | $71,851 | 7 | 5.00/5.0 |
| GuestReady | 1 | $69,652 | 36 | 4.81/5.0 |
| Annemie | 1 | $67,601 | 237 | 4.89/5.0 |
| Joao | 1 | $65,754 | 37 | 4.95/5.0 |
| Julieta | 1 | $64,221 | 37 | 4.81/5.0 |
Analyzing the strategies of top hosts, such as their property selection, pricing, and guest communication, can offer valuable lessons for optimizing your own Airbnb operations in Palmela.
Dive Deeper: Advanced Palmela STR Market Data (2026)
Ready to unlock more insights? AirROI provides access to advanced metrics and comprehensive Airbnb data for Palmela. Explore detailed analytics beyond this report to refine your investment strategy, optimize pricing, and maximize your vacation rental profits.
Explore Advanced MetricsPalmela Short-Term Rental Market Composition (2026): Property & Room Types
Room Type Distribution
Property Type Distribution
Market Composition Insights for Palmela
- The Palmela Airbnb market composition is heavily skewed towards Entire Home/Apt listings, which make up 77.8% of the 176 active rentals. This indicates strong guest preference for privacy and space.
- Looking at the property type distribution in Palmela, House properties are the most common (64.8%), reflecting the local real estate landscape.
- Houses represent a significant 64.8% portion, catering likely to families or larger groups.
- The presence of 14.2% Hotel/Boutique listings indicates integration with traditional hospitality.
- Smaller segments like others, unique stays (combined 2.8%) offer potential for unique stay experiences.
Palmela Airbnb Room Capacity Analysis (2026): Bedroom Distribution
Distribution of Listings by Number of Bedrooms
Room Capacity Insights for Palmela
- The dominant room capacity in Palmela is 1 bedroom listings, making up 33.5% of the market. This suggests a strong demand for properties suitable for couples or solo travelers.
- Together, 1 bedroom and 2 bedrooms properties represent 56.2% of the active Airbnb listings in Palmela, indicating a high concentration in these sizes.
- A significant 37.5% of listings offer 3+ bedrooms, catering to larger groups and families seeking more space in Palmela.
Palmela Vacation Rental Guest Capacity Trends (2026)
Distribution of Listings by Guest Capacity
Guest Capacity Insights for Palmela
- The most common guest capacity trend in Palmela vacation rentals is listings accommodating 8+ guests (23.9%). This suggests the primary traveler segment is likely larger groups.
- Properties designed for 8+ guests and 4 guests dominate the Palmela STR market, accounting for 45.5% of listings.
- 38.7% of properties accommodate 6+ guests, serving the market segment for larger families or group travel in Palmela.
- On average, properties in Palmela are equipped to host 4.6 guests.
Palmela Airbnb Booking Patterns (2026): Available vs. Booked Days
Available Days Distribution
Booked Days Distribution
Booking Pattern Insights for Palmela
- The most common availability pattern in Palmela falls within the 271-366 days range, representing 68.8% of listings. This suggests many properties have significant open periods on their calendars.
- Approximately 91.0% of listings show high availability (181+ days open annually), indicating potential for increased bookings or specific owner usage patterns.
- For booked days, the 31-90 days range is most frequent in Palmela (38.6%), reflecting common guest stay durations or potential owner blocking patterns.
- A notable 9.1% of properties secure long booking periods (181+ days booked per year), highlighting successful long-term rental strategies or significant owner usage.
Palmela Airbnb Minimum Stay Requirements Analysis
Distribution of Listings by Minimum Night Requirement
1 Night
27 listings
15.3% of total
2 Nights
25 listings
14.2% of total
3 Nights
10 listings
5.7% of total
4-6 Nights
29 listings
16.5% of total
7-29 Nights
4 listings
2.3% of total
30+ Nights
81 listings
46% of total
Key Insights
- The most prevalent minimum stay requirement in Palmela is 30+ Nights, adopted by 46% of listings. This highlights the market's preference for longer commitments.
- A significant segment (46%) caters to monthly stays (30+ nights) in Palmela, pointing to opportunities in the extended-stay market.
Recommendations
- Align with the market by considering a 30+ Nights minimum stay, as 46% of Palmela hosts use this setting.
- If feasible, allowing 1-night stays, especially midweek or during low season, could capture last-minute bookings, as only 15.3% currently do.
- Explore offering discounts for stays of 30+ nights to attract the 46% of the market seeking extended stays.
- Adjust minimum nights based on seasonality – potentially shorter during low season and longer during peak demand periods in Palmela.
Palmela Airbnb Cancellation Policy Trends Analysis (2026)
Limited
4 listings
2.3% of total
Super Strict 60 Days
4 listings
2.3% of total
Flexible
30 listings
17% of total
Moderate
57 listings
32.4% of total
Firm
52 listings
29.5% of total
Strict
29 listings
16.5% of total
Cancellation Policy Insights for Palmela
- The prevailing Airbnb cancellation policy trend in Palmela is Moderate, used by 32.4% of listings.
- There's a relatively balanced mix between guest-friendly (49.4%) and stricter (46.0%) policies, offering choices for different guest needs.
Recommendations for Hosts
- Consider adopting a Moderate policy to align with the 32.4% market standard in Palmela.
- Regularly review your cancellation policy against competitors and market demand shifts in Palmela.
Palmela STR Booking Lead Time Analysis (2026)
Average Booking Lead Time by Month
Booking Lead Time Insights for Palmela
- The overall average booking lead time for vacation rentals in Palmela is 61 days.
- Guests book furthest in advance for stays during August (average 78 days), likely coinciding with peak travel demand or local events.
- The shortest booking windows occur for stays in February (average 22 days), indicating more last-minute travel plans during this time.
- Seasonally, Summer (72 days avg.) sees the longest lead times, while Winter (38 days avg.) has the shortest, reflecting typical travel planning cycles.
Recommendations for Hosts
- Use the overall average lead time (61 days) as a baseline for your pricing and availability strategy in Palmela.
- For August stays, consider implementing length-of-stay discounts or slightly higher rates for bookings made less than 78 days out to capitalize on advance planning.
- Target marketing efforts for the Summer season well in advance (at least 72 days) to capture early planners.
- Monitor your own booking lead times against these Palmela averages to identify opportunities for dynamic pricing adjustments.
Popular & Essential Airbnb Amenities in Palmela (2026)
Amenity Prevalence
Amenity Insights for Palmela
- Essential amenities in Palmela that guests expect include: Wifi. Lacking these (this) could significantly impact bookings.
- Popular amenities like TV, Dishes and silverware, First aid kit are common but not universal. Offering these can provide a competitive edge.
Recommendations for Hosts
- Ensure your listing includes all essential amenities for Palmela: Wifi.
- Prioritize adding missing essentials: Wifi.
- Consider adding popular differentiators like TV or Dishes and silverware to increase appeal.
- Highlight unique or less common amenities you offer (e.g., hot tub, dedicated workspace, EV charger) in your listing description and photos.
- Regularly check competitor amenities in Palmela to stay competitive.
Palmela Airbnb Guest Demographics & Profile Analysis (2026)
Guest Profile Summary for Palmela
- The typical guest profile for Airbnb in Palmela consists of predominantly international visitors (79%), with top international origins including France, typically belonging to the Post-2000s (Gen Z/Alpha) group (50%), primarily speaking English or French.
- Domestic travelers account for 20.7% of guests.
- Key international markets include Portugal (20.7%) and France (16.8%).
- Top languages spoken are English (38.3%) followed by French (15%).
- A significant demographic segment is the Post-2000s (Gen Z/Alpha) group, representing 50% of guests.
Recommendations for Hosts
- Focus marketing internationally, particularly towards travelers from France.
- Tailor amenities and listing descriptions to appeal to the dominant Post-2000s (Gen Z/Alpha) demographic (e.g., highlight fast WiFi, smart home features, local guides).
- Highlight unique local experiences or amenities relevant to the primary guest profile.
- Consider seasonal promotions aligned with peak travel times for key origin markets.
Nearby Short-Term Rental Market Comparison
How does the Palmela Airbnb market stack up against its neighbors? Compare key performance metrics like average monthly revenue, ADR, and occupancy rates in surrounding areas to understand the broader regional STR landscape.
| Market | Active Properties | Monthly Revenue | Daily Rate | Avg. Occupancy |
|---|---|---|---|---|
| Comporta | 111 | $3,719 | $422.92 | 41% |
| Vale da Telha | 12 | $3,225 | $355.35 | 50% |
| Alcácer do Sal | 19 | $3,194 | $386.93 | 32% |
| Guia | 35 | $3,127 | $514.12 | 47% |
| Ferreira do Alentejo | 13 | $3,006 | $280.31 | 39% |
| Albufeira | 5,117 | $2,938 | $295.76 | 47% |
| Reguengo Grande | 13 | $2,843 | $319.66 | 40% |
| Lagoa e Carvoeiro | 1,055 | $2,735 | $258.75 | 50% |
| Olhos de Água | 31 | $2,685 | $326.36 | 49% |
| Grândola | 333 | $2,617 | $425.67 | 34% |