Alcobaça Airbnb Market Analysis 2026: Short Term Rental Data & Vacation Rental Statistics in Leiria, Portugal
Is Airbnb profitable in Alcobaça in 2026? Explore comprehensive Airbnb analytics for Alcobaça, Leiria, Portugal to uncover income potential. This 2026 STR market report for Alcobaça, based on AirROI data from February 2025 to January 2026, reveals key trends in the market of 457 active listings.
Whether you're considering an Airbnb investment in Alcobaça, optimizing your existing vacation rental, or exploring rental arbitrage opportunities, understanding the Alcobaça Airbnb data is crucial. Navigating the high regulation landscape is key to maximizing your short term rental income potential. Let's dive into the specifics.
Key Alcobaça Airbnb Performance Metrics Overview
Monthly Airbnb Revenue Variations & Income Potential in Alcobaça (2026)
Understanding the monthly revenue variations for Airbnb listings in Alcobaça is key to maximizing your short term rental income potential. Seasonality significantly impacts earnings. Our analysis, based on data from the past 12 months, shows that the peak revenue month for STRs in Alcobaça is typically August, while January often presents the lowest earnings, highlighting opportunities for strategic pricing adjustments during shoulder and low seasons. Explore the typical Airbnb income in Alcobaça across different performance tiers:
- Best-in-class properties (Top 10%) achieve $3,191+ monthly, often utilizing dynamic pricing and superior guest experiences.
- Strong performing properties (Top 25%) earn $2,008 or more, indicating effective management and desirable locations/amenities.
- Typical properties (Median) generate around $1,174 per month, representing the average market performance.
- Entry-level properties (Bottom 25%) see earnings around $598, often with potential for optimization.
Average Monthly Airbnb Earnings Trend in Alcobaça
Alcobaça Airbnb Occupancy Rate Trends (2026)
Maximize your bookings by understanding the Alcobaça STR occupancy trends. Seasonal demand shifts significantly influence how often properties are booked. Typically, Augustsees the highest demand (peak season occupancy), while January experiences the lowest (low season). Effective strategies, like adjusting minimum stays or offering promotions, can boost occupancy during slower periods. Here's how different property tiers perform in Alcobaça:
- Best-in-class properties (Top 10%) achieve 73%+ occupancy, indicating high desirability and potentially optimized availability.
- Strong performing properties (Top 25%) maintain 52% or higher occupancy, suggesting good market fit and guest satisfaction.
- Typical properties (Median) have an occupancy rate around 32%.
- Entry-level properties (Bottom 25%) average 17% occupancy, potentially facing higher vacancy.
Average Monthly Occupancy Rate Trend in Alcobaça
Average Daily Rate (ADR) Airbnb Trends in Alcobaça (2026)
Effective short term rental pricing strategy in Alcobaça involves understanding monthly ADR fluctuations. The Average Daily Rate (ADR) for Airbnb in Alcobaça typically peaks in August and dips lowest during February. Leveraging Airbnb dynamic pricing tools or strategies based on this seasonality can significantly boost revenue. Here's a look at the typical nightly rates achieved:
- Best-in-class properties (Top 10%) command rates of $242+ per night, often due to premium features or locations.
- Strong performing properties (Top 25%) achieve nightly rates of $168 or more.
- Typical properties (Median) charge around $117 per night.
- Entry-level properties (Bottom 25%) earn around $87 per night.
Average Daily Rate (ADR) Trend by Month in Alcobaça
Get Live Alcobaça Market Intelligence 👇

Explore Real-time Analytics
Airbnb Seasonality Analysis & Trends in Alcobaça (2026)
Peak Season (August, July, September)
- Revenue averages $2,938 per month
- Occupancy rates average 57.9%
- Daily rates average $163
Shoulder Season
- Revenue averages $1,258 per month
- Occupancy maintains around 31.9%
- Daily rates hold near $142
Low Season (January, February, November)
- Revenue drops to average $764 per month
- Occupancy decreases to average 23.5%
- Daily rates adjust to average $141
Seasonality Insights for Alcobaça
- The Airbnb seasonality in Alcobaça shows highly seasonal trends requiring careful strategy. While the sections above show seasonal averages, it's also insightful to look at the extremes:
- During the high season, the absolute peak month showcases Alcobaça's highest earning potential, with monthly revenues capable of climbing to $3,856, occupancy reaching a high of 72.4%, and ADRs peaking at $167.
- Conversely, the slowest single month of the year, typically falling within the low season, marks the market's lowest point. In this month, revenue might dip to $665, occupancy could drop to 17.3%, and ADRs may adjust down to $131.
- Understanding both the seasonal averages and these monthly peaks and troughs in revenue, occupancy, and ADR is crucial for maximizing your Airbnb profit potential in Alcobaça.
Seasonal Strategies for Maximizing Profit
- Peak Season: Maximize revenue through premium pricing and potentially longer minimum stays. Ensure high availability.
- Low Season: Offer competitive pricing, special promotions (e.g., extended stay discounts), and flexible cancellation policies. Target off-season travelers like remote workers or budget-conscious guests.
- Shoulder Seasons: Implement dynamic pricing that balances peak and low rates. Target weekend travelers or specific events. Offer slightly more flexible terms than peak season.
- Regularly analyze your own performance against these Alcobaça seasonality benchmarks and adjust your pricing and availability strategy accordingly.
Best Areas for Airbnb Investment in Alcobaça (2026)
Exploring the top neighborhoods for short-term rentals in Alcobaça? This section highlights key areas, outlining why they are attractive for hosts and guests, along with notable local attractions. Consider these locations based on your target guest profile and investment strategy.
| Neighborhood / Area | Why Host Here? (Target Guests & Appeal) | Key Attractions & Landmarks |
|---|---|---|
| Alcobaça Monastery | A UNESCO World Heritage Site and a masterpiece of Gothic architecture, attracting history lovers and tourists interested in culture and heritage. | Alcobaça Monastery, Cloister of the Blessed, Museu de Alcobaça, Alcobaça Castle, Igreja do Mnisterio, Alcobaça Regional Museum |
| Nazare Beach | Famous for its giant waves and beautiful sandy beach, Nazaré attracts surfers and tourists looking for sun and sea activities. | Praia do Norte, Nazaré Lighthouse, Estátua da Lúcia, Museum of Nazare, Miradouro do Suberco, Nazaré Church |
| Batalha | Home to the Batalha Monastery, this town offers a blend of history and natural beauty, perfect for culture and nature enthusiasts. | Batalha Monastery, Battle of Aljubarrota Interpretive Centre, São Jorge Church, Batalha Forest, Leiria Castle |
| Obidos | A picturesque medieval town surrounded by walls, known for its charming streets and cultural festivals, ideal for visitors looking for an authentic Portuguese experience. | Obidos Castle, Museu Municipal de Óbidos, Igreja de Santa Maria, Obidos Lagoon, Obidos International Chocolate Festival |
| Bodiosa Forest | A natural haven near Alcobaça, perfect for ecotourism and outdoor activities like hiking, cycling, and enjoying nature. | Forest Trails, Picnic Areas, Wildlife Watching, Nature Photography, Eco-Tourism Activities |
| Caldas da Rainha | Known for its thermal springs and ceramics, this vibrant town offers history, art, and wellness, attracting tourists seeking relaxation and culture. | Thermal Hospital, Ceramic Museum, Dom Carlos I Park, Caldas da Rainha Market, Queen's Garden |
| Vale do Figuera | A serene valley with beautiful landscapes, ideal for visitors looking to escape the city and enjoy rural tourism. | Countryside Trails, Local Vineyards, Traditional Festivals, Birdwatching, Olive Oil Tours |
| Sao Martinho do Porto | A charming coastal village with a beautiful bay, perfect for families and tourists looking for a relaxing beach getaway. | Sao Martinho Beach, The Bay of São Martinho, Clifftop Walks, Local Seafood Restaurants, Water Sports Activities |
Understanding Airbnb License Requirements & STR Laws in Alcobaça (2026)
Yes, Alcobaça, Leiria, Portugal enforces high STR regulations. Obtaining a license and ensuring compliance is almost certainly required according to current 2026 STR laws. Always verify the latest short term rental regulations and Airbnb license requirements directly with local government authorities for Alcobaça to ensure full compliance before hosting.
(Source: AirROI data, 2026, based on 83% licensed listings)
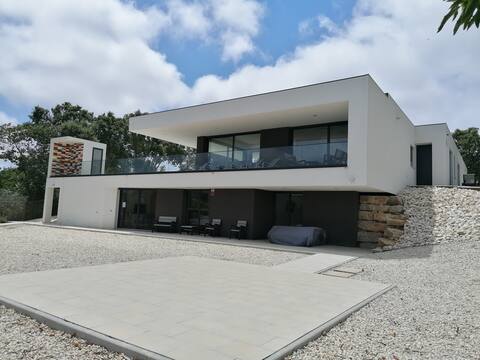
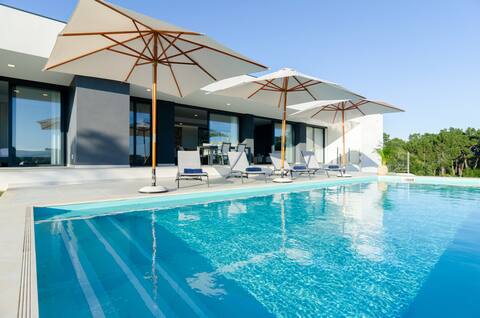
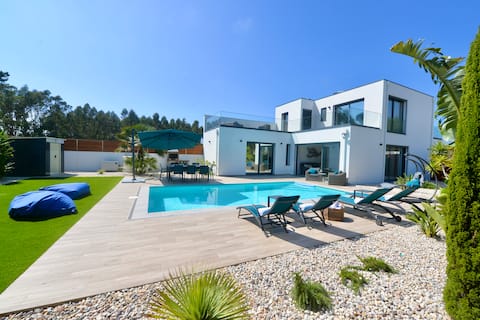
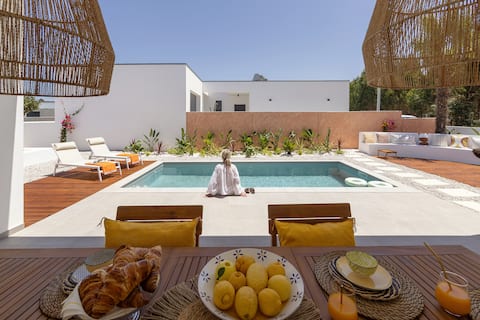
Top Performing Airbnb Properties in Alcobaça (2026)
Benchmark your potential! Explore examples of top-performing Airbnb properties in Alcobaçabased on Trailing Twelve Month (TTM) revenue. Analyze their characteristics, revenue, occupancy rate, and ADR to understand what drives success in this market.
Villa Casa Tranquilespiral Alcobaca - Nazaré
Entire Place • 5 bedrooms
Villa Sobreiro - Idyllic Countryside w Heated Pool
Entire Place • 3 bedrooms

Luxury Villa, Ocean View, Heated Pool,Kid-Friendly
Entire Place • 4 bedrooms
Villa Serena - Exquisite villa with private pool
Entire Place • 3 bedrooms

Luxury Villa, Ocean & Valley View, Heated Pool
Entire Place • 4 bedrooms
Villa 6 Silver Coast - Pool & Garden
Entire Place • 3 bedrooms
Note: Performance varies based on location, size, amenities, seasonality, and management quality. Data reflects the past 12 months.
Top Performing Airbnb Hosts in Alcobaça (2026)
Learn from the best! This table showcases top-performing Airbnb hosts in Alcobaça based on the number of properties managed and estimated total revenue over the past year. Analyze their scale and performance metrics.
| Host Name | Properties | Grossing Revenue | Stay Reviews | Avg Rating |
|---|---|---|---|---|
| Laura Nowak | 25 | $214,893 | 306 | 4.63/5.0 |
| Rental Retreats | 13 | $199,930 | 225 | 4.56/5.0 |
| Dorien | 3 | $193,243 | 61 | 4.86/5.0 |
| SCH Silver Coast Hospitality | 12 | $185,019 | 33 | 4.58/5.0 |
| Feathers Houses | 4 | $141,654 | 147 | 4.80/5.0 |
| Josee | 1 | $90,531 | 38 | 4.95/5.0 |
| Maria | 5 | $87,252 | 137 | 4.69/5.0 |
| Manuel | 6 | $84,901 | 128 | 4.84/5.0 |
| Casas Da Gralha | 8 | $80,422 | 821 | 4.88/5.0 |
| Silver Prop | 1 | $74,000 | 48 | 4.90/5.0 |
Analyzing the strategies of top hosts, such as their property selection, pricing, and guest communication, can offer valuable lessons for optimizing your own Airbnb operations in Alcobaça.
Dive Deeper: Advanced Alcobaça STR Market Data (2026)
Ready to unlock more insights? AirROI provides access to advanced metrics and comprehensive Airbnb data for Alcobaça. Explore detailed analytics beyond this report to refine your investment strategy, optimize pricing, and maximize your vacation rental profits.
Explore Advanced MetricsAlcobaça Short-Term Rental Market Composition (2026): Property & Room Types
Room Type Distribution
Property Type Distribution
Market Composition Insights for Alcobaça
- The Alcobaça Airbnb market composition is heavily skewed towards Entire Home/Apt listings, which make up 92.8% of the 457 active rentals. This indicates strong guest preference for privacy and space.
- Looking at the property type distribution in Alcobaça, House properties are the most common (51.6%), reflecting the local real estate landscape.
- Houses represent a significant 51.6% portion, catering likely to families or larger groups.
- Smaller segments like hotel/boutique, outdoor/unique, others, unique stays (combined 10.6%) offer potential for unique stay experiences.
Alcobaça Airbnb Room Capacity Analysis (2026): Bedroom Distribution
Distribution of Listings by Number of Bedrooms
Room Capacity Insights for Alcobaça
- The dominant room capacity in Alcobaça is 2 bedrooms listings, making up 35.4% of the market. This suggests a strong demand for properties suitable for couples or solo travelers.
- Together, 2 bedrooms and 3 bedrooms properties represent 59.3% of the active Airbnb listings in Alcobaça, indicating a high concentration in these sizes.
- A significant 35.1% of listings offer 3+ bedrooms, catering to larger groups and families seeking more space in Alcobaça.
Alcobaça Vacation Rental Guest Capacity Trends (2026)
Distribution of Listings by Guest Capacity
Guest Capacity Insights for Alcobaça
- The most common guest capacity trend in Alcobaça vacation rentals is listings accommodating 4 guests (25.8%). This suggests the primary traveler segment is likely small families or groups.
- Properties designed for 4 guests and 6 guests dominate the Alcobaça STR market, accounting for 44.4% of listings.
- 38.8% of properties accommodate 6+ guests, serving the market segment for larger families or group travel in Alcobaça.
- On average, properties in Alcobaça are equipped to host 4.8 guests.
Alcobaça Airbnb Booking Patterns (2026): Available vs. Booked Days
Available Days Distribution
Booked Days Distribution
Booking Pattern Insights for Alcobaça
- The most common availability pattern in Alcobaça falls within the 271-366 days range, representing 58.2% of listings. This suggests many properties have significant open periods on their calendars.
- Approximately 90.8% of listings show high availability (181+ days open annually), indicating potential for increased bookings or specific owner usage patterns.
- For booked days, the 91-180 days range is most frequent in Alcobaça (34.8%), reflecting common guest stay durations or potential owner blocking patterns.
- A notable 9.4% of properties secure long booking periods (181+ days booked per year), highlighting successful long-term rental strategies or significant owner usage.
Alcobaça Airbnb Minimum Stay Requirements Analysis
Distribution of Listings by Minimum Night Requirement
1 Night
36 listings
7.9% of total
2 Nights
57 listings
12.5% of total
3 Nights
40 listings
8.8% of total
4-6 Nights
104 listings
22.8% of total
7-29 Nights
26 listings
5.7% of total
30+ Nights
194 listings
42.5% of total
Key Insights
- The most prevalent minimum stay requirement in Alcobaça is 30+ Nights, adopted by 42.5% of listings. This highlights the market's preference for longer commitments.
- A significant segment (42.5%) caters to monthly stays (30+ nights) in Alcobaça, pointing to opportunities in the extended-stay market.
Recommendations
- Align with the market by considering a 30+ Nights minimum stay, as 42.5% of Alcobaça hosts use this setting.
- If feasible, allowing 1-night stays, especially midweek or during low season, could capture last-minute bookings, as only 7.9% currently do.
- Explore offering discounts for stays of 30+ nights to attract the 42.5% of the market seeking extended stays.
- Adjust minimum nights based on seasonality – potentially shorter during low season and longer during peak demand periods in Alcobaça.
Alcobaça Airbnb Cancellation Policy Trends Analysis (2026)
Super Strict 30 Days
36 listings
7.9% of total
Super Strict 60 Days
17 listings
3.7% of total
Limited
4 listings
0.9% of total
Flexible
67 listings
14.7% of total
Moderate
97 listings
21.3% of total
Firm
168 listings
36.8% of total
Strict
67 listings
14.7% of total
Cancellation Policy Insights for Alcobaça
- The prevailing Airbnb cancellation policy trend in Alcobaça is Firm, used by 36.8% of listings.
- A majority (51.5%) of hosts in Alcobaça utilize Firm or Strict policies, indicating a market where hosts prioritize booking security.
Recommendations for Hosts
- Consider adopting a Firm policy to align with the 36.8% market standard in Alcobaça.
- Using a Strict policy might deter some guests, as only 14.7% of listings use it. Evaluate if potential revenue protection outweighs possible lower booking rates.
- Regularly review your cancellation policy against competitors and market demand shifts in Alcobaça.
Alcobaça STR Booking Lead Time Analysis (2026)
Average Booking Lead Time by Month
Booking Lead Time Insights for Alcobaça
- The overall average booking lead time for vacation rentals in Alcobaça is 69 days.
- Guests book furthest in advance for stays during August (average 121 days), likely coinciding with peak travel demand or local events.
- The shortest booking windows occur for stays in February (average 32 days), indicating more last-minute travel plans during this time.
- Seasonally, Summer (92 days avg.) sees the longest lead times, while Winter (46 days avg.) has the shortest, reflecting typical travel planning cycles.
Recommendations for Hosts
- Use the overall average lead time (69 days) as a baseline for your pricing and availability strategy in Alcobaça.
- For August stays, consider implementing length-of-stay discounts or slightly higher rates for bookings made less than 121 days out to capitalize on advance planning.
- Target marketing efforts for the Summer season well in advance (at least 92 days) to capture early planners.
- Monitor your own booking lead times against these Alcobaça averages to identify opportunities for dynamic pricing adjustments.
Popular & Essential Airbnb Amenities in Alcobaça (2026)
Amenity Prevalence
Amenity Insights for Alcobaça
- Popular amenities like Kitchen, Wifi, Hot water are common but not universal. Offering these can provide a competitive edge.
- Warning: Wifi is not universally provided but is considered essential globally. Ensure reliable Wifi is offered.
Recommendations for Hosts
- Consider adding popular differentiators like Kitchen or Wifi to increase appeal.
- Highlight unique or less common amenities you offer (e.g., hot tub, dedicated workspace, EV charger) in your listing description and photos.
- Regularly check competitor amenities in Alcobaça to stay competitive.
Alcobaça Airbnb Guest Demographics & Profile Analysis (2026)
Guest Profile Summary for Alcobaça
- The typical guest profile for Airbnb in Alcobaça consists of predominantly international visitors (82%), with top international origins including Portugal, typically belonging to the Post-2000s (Gen Z/Alpha) group (50%), primarily speaking English or French.
- Domestic travelers account for 18.1% of guests.
- Key international markets include France (21.1%) and Portugal (18.1%).
- Top languages spoken are English (36%) followed by French (16.2%).
- A significant demographic segment is the Post-2000s (Gen Z/Alpha) group, representing 50% of guests.
Recommendations for Hosts
- Focus marketing internationally, particularly towards travelers from Portugal.
- Tailor amenities and listing descriptions to appeal to the dominant Post-2000s (Gen Z/Alpha) demographic (e.g., highlight fast WiFi, smart home features, local guides).
- Highlight unique local experiences or amenities relevant to the primary guest profile.
- Consider seasonal promotions aligned with peak travel times for key origin markets.
Nearby Short-Term Rental Market Comparison
How does the Alcobaça Airbnb market stack up against its neighbors? Compare key performance metrics like average monthly revenue, ADR, and occupancy rates in surrounding areas to understand the broader regional STR landscape.
| Market | Active Properties | Monthly Revenue | Daily Rate | Avg. Occupancy |
|---|---|---|---|---|
| Comporta | 111 | $3,719 | $422.92 | 41% |
| Alcácer do Sal | 19 | $3,194 | $386.92 | 32% |
| Ferreira do Alentejo | 13 | $3,006 | $280.31 | 39% |
| Reguengo Grande | 13 | $2,843 | $319.66 | 40% |
| Grândola | 333 | $2,617 | $425.67 | 34% |
| Lisbon | 13,033 | $2,355 | $163.58 | 54% |
| Cascais | 1,613 | $2,314 | $217.29 | 47% |
| Ribamar | 19 | $2,267 | $265.61 | 40% |
| Colares | 13 | $2,156 | $321.52 | 40% |
| Seixal | 214 | $2,117 | $207.58 | 42% |