Tutukaka Airbnb Market Analysis 2026: Short Term Rental Data & Vacation Rental Statistics in Northland, New Zealand
Is Airbnb profitable in Tutukaka in 2026? Explore comprehensive Airbnb analytics for Tutukaka, Northland, New Zealand to uncover income potential. This 2026 STR market report for Tutukaka, based on AirROI data from February 2025 to January 2026, reveals key trends in the niche market of 44 active listings.
Whether you're considering an Airbnb investment in Tutukaka, optimizing your existing vacation rental, or exploring rental arbitrage opportunities, understanding the Tutukaka Airbnb data is crucial. Leveraging the low regulation environment is key to maximizing your short term rental income potential. Let's dive into the specifics.
Key Tutukaka Airbnb Performance Metrics Overview
Monthly Airbnb Revenue Variations & Income Potential in Tutukaka (2026)
Understanding the monthly revenue variations for Airbnb listings in Tutukaka is key to maximizing your short term rental income potential. Seasonality significantly impacts earnings. Our analysis, based on data from the past 12 months, shows that the peak revenue month for STRs in Tutukaka is typically January, while July often presents the lowest earnings, highlighting opportunities for strategic pricing adjustments during shoulder and low seasons. Explore the typical Airbnb income in Tutukaka across different performance tiers:
- Best-in-class properties (Top 10%) achieve $5,477+ monthly, often utilizing dynamic pricing and superior guest experiences.
- Strong performing properties (Top 25%) earn $2,786 or more, indicating effective management and desirable locations/amenities.
- Typical properties (Median) generate around $1,444 per month, representing the average market performance.
- Entry-level properties (Bottom 25%) see earnings around $692, often with potential for optimization.
Average Monthly Airbnb Earnings Trend in Tutukaka
Tutukaka Airbnb Occupancy Rate Trends (2026)
Maximize your bookings by understanding the Tutukaka STR occupancy trends. Seasonal demand shifts significantly influence how often properties are booked. Typically, Februarysees the highest demand (peak season occupancy), while July experiences the lowest (low season). Effective strategies, like adjusting minimum stays or offering promotions, can boost occupancy during slower periods. Here's how different property tiers perform in Tutukaka:
- Best-in-class properties (Top 10%) achieve 65%+ occupancy, indicating high desirability and potentially optimized availability.
- Strong performing properties (Top 25%) maintain 49% or higher occupancy, suggesting good market fit and guest satisfaction.
- Typical properties (Median) have an occupancy rate around 33%.
- Entry-level properties (Bottom 25%) average 16% occupancy, potentially facing higher vacancy.
Average Monthly Occupancy Rate Trend in Tutukaka
Average Daily Rate (ADR) Airbnb Trends in Tutukaka (2026)
Effective short term rental pricing strategy in Tutukaka involves understanding monthly ADR fluctuations. The Average Daily Rate (ADR) for Airbnb in Tutukaka typically peaks in January and dips lowest during May. Leveraging Airbnb dynamic pricing tools or strategies based on this seasonality can significantly boost revenue. Here's a look at the typical nightly rates achieved:
- Best-in-class properties (Top 10%) command rates of $525+ per night, often due to premium features or locations.
- Strong performing properties (Top 25%) achieve nightly rates of $281 or more.
- Typical properties (Median) charge around $179 per night.
- Entry-level properties (Bottom 25%) earn around $102 per night.
Average Daily Rate (ADR) Trend by Month in Tutukaka
Get Live Tutukaka Market Intelligence 👇

Explore Real-time Analytics
Airbnb Seasonality Analysis & Trends in Tutukaka (2026)
Peak Season (January, December, February)
- Revenue averages $3,335 per month
- Occupancy rates average 48.3%
- Daily rates average $310
Shoulder Season
- Revenue averages $2,106 per month
- Occupancy maintains around 34.5%
- Daily rates hold near $289
Low Season (July, August, September)
- Revenue drops to average $1,481 per month
- Occupancy decreases to average 23.1%
- Daily rates adjust to average $285
Seasonality Insights for Tutukaka
- The Airbnb seasonality in Tutukaka shows highly seasonal trends requiring careful strategy. While the sections above show seasonal averages, it's also insightful to look at the extremes:
- During the high season, the absolute peak month showcases Tutukaka's highest earning potential, with monthly revenues capable of climbing to $3,396, occupancy reaching a high of 54.7%, and ADRs peaking at $320.
- Conversely, the slowest single month of the year, typically falling within the low season, marks the market's lowest point. In this month, revenue might dip to $1,367, occupancy could drop to 21.5%, and ADRs may adjust down to $280.
- Understanding both the seasonal averages and these monthly peaks and troughs in revenue, occupancy, and ADR is crucial for maximizing your Airbnb profit potential in Tutukaka.
Seasonal Strategies for Maximizing Profit
- Peak Season: Maximize revenue through premium pricing and potentially longer minimum stays. Ensure high availability.
- Low Season: Offer competitive pricing, special promotions (e.g., extended stay discounts), and flexible cancellation policies. Target off-season travelers like remote workers or budget-conscious guests.
- Shoulder Seasons: Implement dynamic pricing that balances peak and low rates. Target weekend travelers or specific events. Offer slightly more flexible terms than peak season.
- Regularly analyze your own performance against these Tutukaka seasonality benchmarks and adjust your pricing and availability strategy accordingly.
Best Areas for Airbnb Investment in Tutukaka (2026)
Exploring the top neighborhoods for short-term rentals in Tutukaka? This section highlights key areas, outlining why they are attractive for hosts and guests, along with notable local attractions. Consider these locations based on your target guest profile and investment strategy.
| Neighborhood / Area | Why Host Here? (Target Guests & Appeal) | Key Attractions & Landmarks |
|---|---|---|
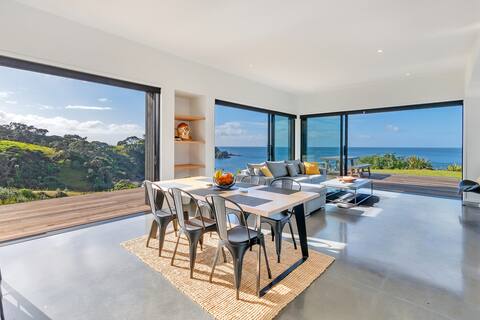
| Tutukaka Coast | Renowned for its stunning natural beauty, diving spots, and marine life. Attracts adventure enthusiasts and families looking for a coastal retreat. | Poor Knights Islands Marine Reserve, Tutukaka Marina, Snorkeling and diving tours, Ngunguru Estuary, Ocean Beach, Tutukaka Coastal Walkway |
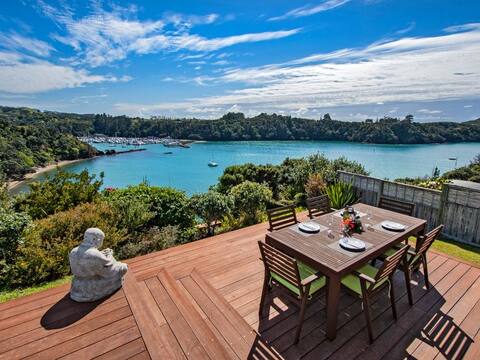
| Matapouri Bay | A beautiful, serene beach location ideal for families and holidaymakers. Famous for its clear waters and golden sands, it's a perfect getaway spot. | Matapouri Beach, Whale Bay, Mahuia Island, Matapouri Estuary, Dolphin watching, Local cafes and shops |
| Ngunguru | A charming small village close to the coast, popular for its relaxed vibe and proximity to beautiful beaches. | Ngunguru Beach, Ngunguru Sandspit, Fishing and boating activities, Local kiwi environment, Estuary walks, Surf spots nearby |
| James Street | An emerging area popular with visitors seeking a local experience, close to key amenities and the waterfront. | Local dining options, Close proximity to beaches, Scenic views, Local shops and markets, Short drive to larger attractions |
| Ocean Beach | Known for its expansive sandy beach and excellent surf conditions. Popular with beach lovers and surfers. | Ocean Beach Surf Life Saving Club, Surfing competitions, Beach walks, Secluded spots for relaxing, Accessibility to nearby parks |
| Kaimarama | A peaceful, rural area offering stunning views and a getaway from the hustle, attracting those looking for tranquility. | Scenic rural landscapes, Walking trails, Local wildlife, Nearby beaches, Proximity to hiking spots |
| Whangaumu Bay | A popular swimming spot with families due to its safe swimming conditions and beauty. A great place for relaxation and fun. | Whangaumu Beach, Picnic areas, Beach volleyball, Swimming, Snorkeling and kayaking |
| Doubtless Bay | Famous for its exotic beaches and luxury accommodations, it draws visitors looking for a high-end experience and stunning surroundings. | Doubtless Bay Beach, Luxury resorts, Water activities, Scenic drives, Fishing spots |
Understanding Airbnb License Requirements & STR Laws in Tutukaka (2026)
While Tutukaka, Northland, New Zealand currently shows low STR regulations, specific Airbnb license requirements might still exist or change. Always verify the latest short term rental regulations and Airbnb license requirements directly with local government authorities for Tutukaka to ensure full compliance before hosting.
(Source: AirROI data, 2026, finding no licensed listings among those analyzed)
Top Performing Airbnb Properties in Tutukaka (2026)
Benchmark your potential! Explore examples of top-performing Airbnb properties in Tutukakabased on Trailing Twelve Month (TTM) revenue. Analyze their characteristics, revenue, occupancy rate, and ADR to understand what drives success in this market.
Black Rock Holiday Home - Tutukaka
Entire Place • 5 bedrooms

Absolute Beach Front -Tutukaka's slice of heaven
Entire Place • 4 bedrooms

Oceanview Cottage
Entire Place • 3 bedrooms

Views on top
Entire Place • 2 bedrooms

North Gable House
Entire Place • 4 bedrooms
Sea Blue Heaven
Entire Place • 3 bedrooms
Note: Performance varies based on location, size, amenities, seasonality, and management quality. Data reflects the past 12 months.
Top Performing Airbnb Hosts in Tutukaka (2026)
Learn from the best! This table showcases top-performing Airbnb hosts in Tutukaka based on the number of properties managed and estimated total revenue over the past year. Analyze their scale and performance metrics.
| Host Name | Properties | Grossing Revenue | Stay Reviews | Avg Rating |
|---|---|---|---|---|
| Annette | 3 | $140,569 | 118 | 4.99/5.0 |
| Alan | 1 | $101,930 | 271 | 4.90/5.0 |
| Wayne | 1 | $85,540 | 63 | 4.92/5.0 |
| Shona | 1 | $61,885 | 168 | 4.97/5.0 |
| Holiday | 2 | $56,039 | 81 | 4.83/5.0 |
| Anneke | 2 | $47,321 | 183 | 4.97/5.0 |
| Phill | 4 | $40,006 | 101 | 4.79/5.0 |
| Sandra | 1 | $33,589 | 46 | 4.93/5.0 |
| Jacinda | 1 | $33,083 | 28 | 4.96/5.0 |
| Anne | 2 | $32,616 | 630 | 4.94/5.0 |
Analyzing the strategies of top hosts, such as their property selection, pricing, and guest communication, can offer valuable lessons for optimizing your own Airbnb operations in Tutukaka.
Dive Deeper: Advanced Tutukaka STR Market Data (2026)
Ready to unlock more insights? AirROI provides access to advanced metrics and comprehensive Airbnb data for Tutukaka. Explore detailed analytics beyond this report to refine your investment strategy, optimize pricing, and maximize your vacation rental profits.
Explore Advanced MetricsTutukaka Short-Term Rental Market Composition (2026): Property & Room Types
Room Type Distribution
Property Type Distribution
Market Composition Insights for Tutukaka
- The Tutukaka Airbnb market composition is heavily skewed towards Entire Home/Apt listings, which make up 97.7% of the 44 active rentals. This indicates strong guest preference for privacy and space.
- Looking at the property type distribution in Tutukaka, House properties are the most common (47.7%), reflecting the local real estate landscape.
- Houses represent a significant 47.7% portion, catering likely to families or larger groups.
- The presence of 18.2% Hotel/Boutique listings indicates integration with traditional hospitality.
Tutukaka Airbnb Room Capacity Analysis (2026): Bedroom Distribution
Distribution of Listings by Number of Bedrooms
Room Capacity Insights for Tutukaka
- The dominant room capacity in Tutukaka is 1 bedroom listings, making up 43.2% of the market. This suggests a strong demand for properties suitable for couples or solo travelers.
- Together, 1 bedroom and 2 bedrooms properties represent 65.9% of the active Airbnb listings in Tutukaka, indicating a high concentration in these sizes.
- A significant 29.5% of listings offer 3+ bedrooms, catering to larger groups and families seeking more space in Tutukaka.
Tutukaka Vacation Rental Guest Capacity Trends (2026)
Distribution of Listings by Guest Capacity
Guest Capacity Insights for Tutukaka
- The most common guest capacity trend in Tutukaka vacation rentals is listings accommodating 2 guests (40.9%). This suggests the primary traveler segment is likely couples or solo travelers.
- Properties designed for 2 guests and 4 guests dominate the Tutukaka STR market, accounting for 65.9% of listings.
- A significant 40.9% of listings cater specifically to 1-2 guests, highlighting strong demand from couples and solo travelers in Tutukaka.
- 27.3% of properties accommodate 6+ guests, serving the market segment for larger families or group travel in Tutukaka.
- On average, properties in Tutukaka are equipped to host 4.0 guests.
Tutukaka Airbnb Booking Patterns (2026): Available vs. Booked Days
Available Days Distribution
Booked Days Distribution
Booking Pattern Insights for Tutukaka
- The most common availability pattern in Tutukaka falls within the 271-366 days range, representing 52.3% of listings. This suggests many properties have significant open periods on their calendars.
- Approximately 90.9% of listings show high availability (181+ days open annually), indicating potential for increased bookings or specific owner usage patterns.
- For booked days, the 91-180 days range is most frequent in Tutukaka (43.2%), reflecting common guest stay durations or potential owner blocking patterns.
- A notable 11.4% of properties secure long booking periods (181+ days booked per year), highlighting successful long-term rental strategies or significant owner usage.
Tutukaka Airbnb Minimum Stay Requirements Analysis
Distribution of Listings by Minimum Night Requirement
1 Night
7 listings
15.9% of total
2 Nights
16 listings
36.4% of total
3 Nights
3 listings
6.8% of total
4-6 Nights
2 listings
4.5% of total
30+ Nights
16 listings
36.4% of total
Key Insights
- The most prevalent minimum stay requirement in Tutukaka is 2 Nights, adopted by 36.4% of listings. This highlights the market's preference for shorter, flexible bookings.
- A significant segment (36.4%) caters to monthly stays (30+ nights) in Tutukaka, pointing to opportunities in the extended-stay market.
Recommendations
- Align with the market by considering a 2 Nights minimum stay, as 36.4% of Tutukaka hosts use this setting.
- If feasible, allowing 1-night stays, especially midweek or during low season, could capture last-minute bookings, as only 15.9% currently do.
- A 2-night minimum appears standard (36.4%). Consider this for weekends or peak periods.
- Explore offering discounts for stays of 30+ nights to attract the 36.4% of the market seeking extended stays.
- Adjust minimum nights based on seasonality – potentially shorter during low season and longer during peak demand periods in Tutukaka.
Tutukaka Airbnb Cancellation Policy Trends Analysis (2026)
Limited
1 listings
2.3% of total
Flexible
8 listings
18.2% of total
Moderate
14 listings
31.8% of total
Firm
18 listings
40.9% of total
Strict
3 listings
6.8% of total
Cancellation Policy Insights for Tutukaka
- The prevailing Airbnb cancellation policy trend in Tutukaka is Firm, used by 40.9% of listings.
- There's a relatively balanced mix between guest-friendly (50.0%) and stricter (47.7%) policies, offering choices for different guest needs.
- Strict cancellation policies are quite rare (6.8%), potentially making listings with this policy less competitive unless justified by high demand or property type.
Recommendations for Hosts
- Consider adopting a Firm policy to align with the 40.9% market standard in Tutukaka.
- Using a Strict policy might deter some guests, as only 6.8% of listings use it. Evaluate if potential revenue protection outweighs possible lower booking rates.
- Regularly review your cancellation policy against competitors and market demand shifts in Tutukaka.
Tutukaka STR Booking Lead Time Analysis (2026)
Average Booking Lead Time by Month
Booking Lead Time Insights for Tutukaka
- The overall average booking lead time for vacation rentals in Tutukaka is 56 days.
- Guests book furthest in advance for stays during September (average 81 days), likely coinciding with peak travel demand or local events.
- The shortest booking windows occur for stays in July (average 30 days), indicating more last-minute travel plans during this time.
- Seasonally, Winter (71 days avg.) sees the longest lead times, while Summer (35 days avg.) has the shortest, reflecting typical travel planning cycles.
Recommendations for Hosts
- Use the overall average lead time (56 days) as a baseline for your pricing and availability strategy in Tutukaka.
- For September stays, consider implementing length-of-stay discounts or slightly higher rates for bookings made less than 81 days out to capitalize on advance planning.
- Target marketing efforts for the Winter season well in advance (at least 71 days) to capture early planners.
- Monitor your own booking lead times against these Tutukaka averages to identify opportunities for dynamic pricing adjustments.
Popular & Essential Airbnb Amenities in Tutukaka (2026)
Amenity Prevalence
Amenity Insights for Tutukaka
- Essential amenities in Tutukaka that guests expect include: Free parking on premises, Smoke alarm. Lacking these (any) could significantly impact bookings.
- Popular amenities like Heating, Dishes and silverware, Wifi are common but not universal. Offering these can provide a competitive edge.
- Warning: Wifi is not universally provided but is considered essential globally. Ensure reliable Wifi is offered.
Recommendations for Hosts
- Ensure your listing includes all essential amenities for Tutukaka: Free parking on premises, Smoke alarm.
- Prioritize adding missing essentials: Free parking on premises, Smoke alarm.
- Consider adding popular differentiators like Heating or Dishes and silverware to increase appeal.
- Highlight unique or less common amenities you offer (e.g., hot tub, dedicated workspace, EV charger) in your listing description and photos.
- Regularly check competitor amenities in Tutukaka to stay competitive.
Tutukaka Airbnb Guest Demographics & Profile Analysis (2026)
Guest Profile Summary for Tutukaka
- The typical guest profile for Airbnb in Tutukaka consists of a mix of domestic (51%) and international guests, often arriving from nearby Auckland, typically belonging to the Post-2000s (Gen Z/Alpha) group (50%), primarily speaking English or Spanish.
- Domestic travelers account for 51.0% of guests.
- Key international markets include New Zealand (51%) and United States (17.8%).
- Top languages spoken are English (63.3%) followed by Spanish (9%).
- A significant demographic segment is the Post-2000s (Gen Z/Alpha) group, representing 50% of guests.
Recommendations for Hosts
- Balance marketing efforts between domestic and international channels based on the guest mix.
- Tailor amenities and listing descriptions to appeal to the dominant Post-2000s (Gen Z/Alpha) demographic (e.g., highlight fast WiFi, smart home features, local guides).
- Highlight unique local experiences or amenities relevant to the primary guest profile.
- Consider seasonal promotions aligned with peak travel times for key origin markets.
Nearby Short-Term Rental Market Comparison
How does the Tutukaka Airbnb market stack up against its neighbors? Compare key performance metrics like average monthly revenue, ADR, and occupancy rates in surrounding areas to understand the broader regional STR landscape.
| Market | Active Properties | Monthly Revenue | Daily Rate | Avg. Occupancy |
|---|---|---|---|---|
| Hot Water Beach | 27 | $2,949 | $257.55 | 50% |
| Whananaki | 14 | $2,368 | $364.38 | 36% |
| Waiheke | 580 | $2,274 | $338.47 | 32% |
| Hahei | 104 | $2,241 | $260.25 | 39% |
| Opito Bay | 16 | $1,911 | $294.47 | 29% |
| Waitematā | 1,525 | $1,702 | $146.61 | 50% |
| Langs Beach | 26 | $1,598 | $343.61 | 29% |
| Baylys Beach | 12 | $1,559 | $131.00 | 46% |
| Paihia | 10 | $1,509 | $185.24 | 40% |
| Whangārei Heads | 51 | $1,486 | $168.82 | 39% |