Ruakākā Beach Airbnb Market Analysis 2026: Short Term Rental Data & Vacation Rental Statistics in Northland, New Zealand
Is Airbnb profitable in Ruakākā Beach in 2026? Explore comprehensive Airbnb analytics for Ruakākā Beach, Northland, New Zealand to uncover income potential. This 2026 STR market report for Ruakākā Beach, based on AirROI data from February 2025 to January 2026, reveals key trends in the niche market of 29 active listings.
Whether you're considering an Airbnb investment in Ruakākā Beach, optimizing your existing vacation rental, or exploring rental arbitrage opportunities, understanding the Ruakākā Beach Airbnb data is crucial. Leveraging the low regulation environment is key to maximizing your short term rental income potential. Let's dive into the specifics.
Key Ruakākā Beach Airbnb Performance Metrics Overview
Monthly Airbnb Revenue Variations & Income Potential in Ruakākā Beach (2026)
Understanding the monthly revenue variations for Airbnb listings in Ruakākā Beach is key to maximizing your short term rental income potential. Seasonality significantly impacts earnings. Our analysis, based on data from the past 12 months, shows that the peak revenue month for STRs in Ruakākā Beach is typically January, while September often presents the lowest earnings, highlighting opportunities for strategic pricing adjustments during shoulder and low seasons. Explore the typical Airbnb income in Ruakākā Beach across different performance tiers:
- Best-in-class properties (Top 10%) achieve $3,764+ monthly, often utilizing dynamic pricing and superior guest experiences.
- Strong performing properties (Top 25%) earn $2,200 or more, indicating effective management and desirable locations/amenities.
- Typical properties (Median) generate around $1,314 per month, representing the average market performance.
- Entry-level properties (Bottom 25%) see earnings around $657, often with potential for optimization.
Average Monthly Airbnb Earnings Trend in Ruakākā Beach
Ruakākā Beach Airbnb Occupancy Rate Trends (2026)
Maximize your bookings by understanding the Ruakākā Beach STR occupancy trends. Seasonal demand shifts significantly influence how often properties are booked. Typically, Januarysees the highest demand (peak season occupancy), while September experiences the lowest (low season). Effective strategies, like adjusting minimum stays or offering promotions, can boost occupancy during slower periods. Here's how different property tiers perform in Ruakākā Beach:
- Best-in-class properties (Top 10%) achieve 69%+ occupancy, indicating high desirability and potentially optimized availability.
- Strong performing properties (Top 25%) maintain 46% or higher occupancy, suggesting good market fit and guest satisfaction.
- Typical properties (Median) have an occupancy rate around 26%.
- Entry-level properties (Bottom 25%) average 11% occupancy, potentially facing higher vacancy.
Average Monthly Occupancy Rate Trend in Ruakākā Beach
Average Daily Rate (ADR) Airbnb Trends in Ruakākā Beach (2026)
Effective short term rental pricing strategy in Ruakākā Beach involves understanding monthly ADR fluctuations. The Average Daily Rate (ADR) for Airbnb in Ruakākā Beach typically peaks in February and dips lowest during September. Leveraging Airbnb dynamic pricing tools or strategies based on this seasonality can significantly boost revenue. Here's a look at the typical nightly rates achieved:
- Best-in-class properties (Top 10%) command rates of $428+ per night, often due to premium features or locations.
- Strong performing properties (Top 25%) achieve nightly rates of $346 or more.
- Typical properties (Median) charge around $204 per night.
- Entry-level properties (Bottom 25%) earn around $135 per night.
Average Daily Rate (ADR) Trend by Month in Ruakākā Beach
Get Live Ruakākā Beach Market Intelligence 👇
Explore Real-time Analytics
Airbnb Seasonality Analysis & Trends in Ruakākā Beach (2026)
Peak Season (January, December, February)
- Revenue averages $2,761 per month
- Occupancy rates average 43.3%
- Daily rates average $255
Shoulder Season
- Revenue averages $1,640 per month
- Occupancy maintains around 30.9%
- Daily rates hold near $243
Low Season (June, July, September)
- Revenue drops to average $1,019 per month
- Occupancy decreases to average 17.1%
- Daily rates adjust to average $243
Seasonality Insights for Ruakākā Beach
- The Airbnb seasonality in Ruakākā Beach shows highly seasonal trends requiring careful strategy. While the sections above show seasonal averages, it's also insightful to look at the extremes:
- During the high season, the absolute peak month showcases Ruakākā Beach's highest earning potential, with monthly revenues capable of climbing to $3,021, occupancy reaching a high of 45.5%, and ADRs peaking at $268.
- Conversely, the slowest single month of the year, typically falling within the low season, marks the market's lowest point. In this month, revenue might dip to $947, occupancy could drop to 16.5%, and ADRs may adjust down to $226.
- Understanding both the seasonal averages and these monthly peaks and troughs in revenue, occupancy, and ADR is crucial for maximizing your Airbnb profit potential in Ruakākā Beach.
Seasonal Strategies for Maximizing Profit
- Peak Season: Maximize revenue through premium pricing and potentially longer minimum stays. Ensure high availability.
- Low Season: Offer competitive pricing, special promotions (e.g., extended stay discounts), and flexible cancellation policies. Target off-season travelers like remote workers or budget-conscious guests.
- Shoulder Seasons: Implement dynamic pricing that balances peak and low rates. Target weekend travelers or specific events. Offer slightly more flexible terms than peak season.
- Regularly analyze your own performance against these Ruakākā Beach seasonality benchmarks and adjust your pricing and availability strategy accordingly.
Best Areas for Airbnb Investment in Ruakākā Beach (2026)
Exploring the top neighborhoods for short-term rentals in Ruakākā Beach? This section highlights key areas, outlining why they are attractive for hosts and guests, along with notable local attractions. Consider these locations based on your target guest profile and investment strategy.
| Neighborhood / Area | Why Host Here? (Target Guests & Appeal) | Key Attractions & Landmarks |
|---|---|---|
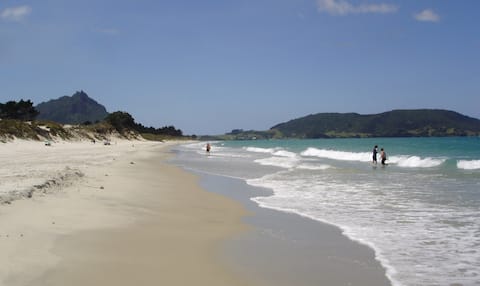
| Ruakākā Beach | Beautiful sandy beach ideal for families and water sports enthusiasts, offering breathtaking views and a relaxed coastal lifestyle. Perfect for hosting vacation rentals with easy beach access. | Ruakākā Beach, Ruakākā Marine Reserve, Whangarei Heads, Bream Bay, Mount Manaia, Bream Head Scenic Reserve |
| Bream Bay | Known for its stunning beaches and outdoor activities, Bream Bay attracts visitors seeking adventure and natural beauty, making it a great location for Airbnb investments. | Bream Bay, Northland Events Centre, The Cove, Whangarei Falls, Ocean Beach, Ruakākā Surf Life Saving Club |
| Whangarei Heads | A scenic area that is popular for its stunning landscapes and hiking trails, appealing to tourists looking for outdoor experiences and eco-tourism. | Cape Brett, Whangarei Heads Walks, Onerahi Beach, Parua Bay, Waro Limestone Scenic Reserve, Smugglers Cove |
| Marsden Point | A growing area with new developments and access to beaches, making it an attractive investment for vacation rentals near the port and industrial areas. | Marsden Point Beach, Port of Whangarei, Campbell's Bay, Ngaruawahia River, local cafes and restaurants |
| Langs Beach | A quiet beach community known for its peaceful environment, perfect for family getaways and relaxing retreats, ideal for hosting Airbnb properties. | Langs Beach, rock pools, Bush Reserve, scenic coastal walks, local art galleries |
| One Tree Point | A picturesque coastal village known for its calm waters and family-friendly environment, making it a desirable spot for vacation rentals. | One Tree Point Beach, Dune Lakes, Boating activities, local parks, close proximity to Whangarei |
| Pataua North | Set in a tranquil, scenic area with access to a beautiful estuary and local wildlife, attracting eco-tourists and nature lovers for a peaceful stay. | Pataua North Beach, Pataua Estuary, walking trails, fishing spots, great for kayaking |
| Onerahi | A suburb of Whangarei, offering a blend of beach and city life, appealing for visitors who want the best of both worlds during their stay. | Onerahi Beach, Whangarei Airport, Restaurant and café options, local parks, walking tracks |
Understanding Airbnb License Requirements & STR Laws in Ruakākā Beach (2026)
While Ruakākā Beach, Northland, New Zealand currently shows low STR regulations, specific Airbnb license requirements might still exist or change. Always verify the latest short term rental regulations and Airbnb license requirements directly with local government authorities for Ruakākā Beach to ensure full compliance before hosting.
(Source: AirROI data, 2026, finding no licensed listings among those analyzed)
Top Performing Airbnb Properties in Ruakākā Beach (2026)
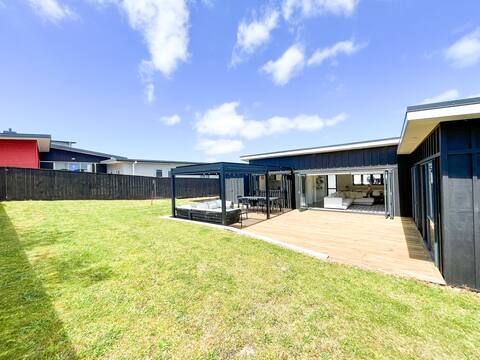
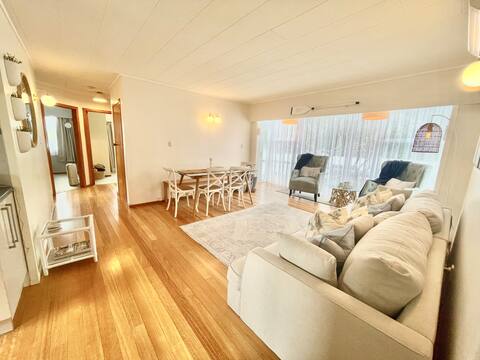
Benchmark your potential! Explore examples of top-performing Airbnb properties in Ruakākā Beachbased on Trailing Twelve Month (TTM) revenue. Analyze their characteristics, revenue, occupancy rate, and ADR to understand what drives success in this market.

Luxurious Beachfront Paradise - 1h35 from Auckland
Entire Place • 5 bedrooms
Ruakaka Beach Escape
Entire Place • 4 bedrooms
Erin's Bach
Entire Place • 1 bedroom
Pipi Palace Ruakaka - For Work or Family Stays
Entire Place • 4 bedrooms

Pohutukawa House, Ruakaka
Entire Place • 5 bedrooms

Tuturu view, sand n surf!
Entire Place • 2 bedrooms
Note: Performance varies based on location, size, amenities, seasonality, and management quality. Data reflects the past 12 months.
Top Performing Airbnb Hosts in Ruakākā Beach (2026)
Learn from the best! This table showcases top-performing Airbnb hosts in Ruakākā Beach based on the number of properties managed and estimated total revenue over the past year. Analyze their scale and performance metrics.
| Host Name | Properties | Grossing Revenue | Stay Reviews | Avg Rating |
|---|---|---|---|---|
| Val | 1 | $80,553 | 278 | 4.93/5.0 |
| Leone & Mark | 2 | $42,328 | 51 | 4.96/5.0 |
| Bachcare | 10 | $39,819 | 69 | 4.74/5.0 |
| Anna | 1 | $30,172 | 11 | 4.64/5.0 |
| Kathy & Bryon | 1 | $28,740 | 238 | 4.97/5.0 |
| Graham | 1 | $23,011 | 12 | 4.92/5.0 |
| Francie | 1 | $22,958 | 33 | 5.00/5.0 |
| Merril & Graham | 1 | $21,437 | 233 | 4.90/5.0 |
| Donna | 1 | $18,150 | 39 | 4.97/5.0 |
| Lucy | 1 | $15,192 | 90 | 4.96/5.0 |
Analyzing the strategies of top hosts, such as their property selection, pricing, and guest communication, can offer valuable lessons for optimizing your own Airbnb operations in Ruakākā Beach.
Dive Deeper: Advanced Ruakākā Beach STR Market Data (2026)
Ready to unlock more insights? AirROI provides access to advanced metrics and comprehensive Airbnb data for Ruakākā Beach. Explore detailed analytics beyond this report to refine your investment strategy, optimize pricing, and maximize your vacation rental profits.
Explore Advanced MetricsRuakākā Beach Short-Term Rental Market Composition (2026): Property & Room Types
Room Type Distribution
Property Type Distribution
Market Composition Insights for Ruakākā Beach
- The Ruakākā Beach Airbnb market composition is heavily skewed towards Entire Home/Apt listings, which make up 100% of the 29 active rentals. This indicates strong guest preference for privacy and space.
- Looking at the property type distribution in Ruakākā Beach, House properties are the most common (82.8%), reflecting the local real estate landscape.
- Houses represent a significant 82.8% portion, catering likely to families or larger groups.
- The presence of 10.3% Hotel/Boutique listings indicates integration with traditional hospitality.
Ruakākā Beach Airbnb Room Capacity Analysis (2026): Bedroom Distribution
Distribution of Listings by Number of Bedrooms
Room Capacity Insights for Ruakākā Beach
- The dominant room capacity in Ruakākā Beach is 3 bedrooms listings, making up 34.5% of the market. This suggests a strong demand for properties suitable for families or small groups.
- Together, 3 bedrooms and 4 bedrooms properties represent 65.5% of the active Airbnb listings in Ruakākā Beach, indicating a high concentration in these sizes.
- A significant 72.4% of listings offer 3+ bedrooms, catering to larger groups and families seeking more space in Ruakākā Beach.
Ruakākā Beach Vacation Rental Guest Capacity Trends (2026)
Distribution of Listings by Guest Capacity
Guest Capacity Insights for Ruakākā Beach
- The most common guest capacity trend in Ruakākā Beach vacation rentals is listings accommodating 8+ guests (48.3%). This suggests the primary traveler segment is likely larger groups.
- Properties designed for 8+ guests and 6 guests dominate the Ruakākā Beach STR market, accounting for 65.5% of listings.
- 72.4% of properties accommodate 6+ guests, serving the market segment for larger families or group travel in Ruakākā Beach.
- On average, properties in Ruakākā Beach are equipped to host 6.3 guests.
Ruakākā Beach Airbnb Booking Patterns (2026): Available vs. Booked Days
Available Days Distribution
Booked Days Distribution
Booking Pattern Insights for Ruakākā Beach
- The most common availability pattern in Ruakākā Beach falls within the 271-366 days range, representing 65.5% of listings. This suggests many properties have significant open periods on their calendars.
- Approximately 93.1% of listings show high availability (181+ days open annually), indicating potential for increased bookings or specific owner usage patterns.
- For booked days, the 1-30 days range is most frequent in Ruakākā Beach (44.8%), reflecting common guest stay durations or potential owner blocking patterns.
- A notable 6.8% of properties secure long booking periods (181+ days booked per year), highlighting successful long-term rental strategies or significant owner usage.
Ruakākā Beach Airbnb Minimum Stay Requirements Analysis
Distribution of Listings by Minimum Night Requirement
1 Night
3 listings
10.3% of total
2 Nights
15 listings
51.7% of total
3 Nights
2 listings
6.9% of total
30+ Nights
9 listings
31% of total
Key Insights
- The most prevalent minimum stay requirement in Ruakākā Beach is 2 Nights, adopted by 51.7% of listings. This highlights the market's preference for shorter, flexible bookings.
- A strong majority (62.0%) of the Ruakākā Beach Airbnb data shows acceptance of very short stays (1-2 nights), indicating a dynamic, high-turnover market.
- A significant segment (31%) caters to monthly stays (30+ nights) in Ruakākā Beach, pointing to opportunities in the extended-stay market.
Recommendations
- Align with the market by considering a 2 Nights minimum stay, as 51.7% of Ruakākā Beach hosts use this setting.
- If feasible, allowing 1-night stays, especially midweek or during low season, could capture last-minute bookings, as only 10.3% currently do.
- A 2-night minimum appears standard (51.7%). Consider this for weekends or peak periods.
- Explore offering discounts for stays of 30+ nights to attract the 31% of the market seeking extended stays.
- Adjust minimum nights based on seasonality – potentially shorter during low season and longer during peak demand periods in Ruakākā Beach.
Ruakākā Beach Airbnb Cancellation Policy Trends Analysis (2026)
Flexible
2 listings
6.9% of total
Moderate
8 listings
27.6% of total
Firm
17 listings
58.6% of total
Strict
2 listings
6.9% of total
Cancellation Policy Insights for Ruakākā Beach
- The prevailing Airbnb cancellation policy trend in Ruakākā Beach is Firm, used by 58.6% of listings.
- A majority (65.5%) of hosts in Ruakākā Beach utilize Firm or Strict policies, indicating a market where hosts prioritize booking security.
- Strict cancellation policies are quite rare (6.9%), potentially making listings with this policy less competitive unless justified by high demand or property type.
Recommendations for Hosts
- Consider adopting a Firm policy to align with the 58.6% market standard in Ruakākā Beach.
- Using a Strict policy might deter some guests, as only 6.9% of listings use it. Evaluate if potential revenue protection outweighs possible lower booking rates.
- Regularly review your cancellation policy against competitors and market demand shifts in Ruakākā Beach.
Ruakākā Beach STR Booking Lead Time Analysis (2026)
Average Booking Lead Time by Month
Booking Lead Time Insights for Ruakākā Beach
- The overall average booking lead time for vacation rentals in Ruakākā Beach is 31 days.
- Guests book furthest in advance for stays during December (average 86 days), likely coinciding with peak travel demand or local events.
- The shortest booking windows occur for stays in August (average 10 days), indicating more last-minute travel plans during this time.
- Seasonally, Winter (61 days avg.) sees the longest lead times, while Summer (14 days avg.) has the shortest, reflecting typical travel planning cycles.
Recommendations for Hosts
- Use the overall average lead time (31 days) as a baseline for your pricing and availability strategy in Ruakākā Beach.
- For December stays, consider implementing length-of-stay discounts or slightly higher rates for bookings made less than 86 days out to capitalize on advance planning.
- During August, focus on last-minute booking availability and promotions, as guests book with very short notice (10 days avg.).
- Target marketing efforts for the Winter season well in advance (at least 61 days) to capture early planners.
- Monitor your own booking lead times against these Ruakākā Beach averages to identify opportunities for dynamic pricing adjustments.
Popular & Essential Airbnb Amenities in Ruakākā Beach (2026)
Amenity Prevalence
Amenity Insights for Ruakākā Beach
- Essential amenities in Ruakākā Beach that guests expect include: Wifi, Kitchen. Lacking these (any) could significantly impact bookings.
- Popular amenities like Free parking on premises, TV, Toaster are common but not universal. Offering these can provide a competitive edge.
Recommendations for Hosts
- Ensure your listing includes all essential amenities for Ruakākā Beach: Wifi, Kitchen.
- Prioritize adding missing essentials: Kitchen.
- Consider adding popular differentiators like Free parking on premises or TV to increase appeal.
- Highlight unique or less common amenities you offer (e.g., hot tub, dedicated workspace, EV charger) in your listing description and photos.
- Regularly check competitor amenities in Ruakākā Beach to stay competitive.
Ruakākā Beach Airbnb Guest Demographics & Profile Analysis (2026)
Guest Profile Summary for Ruakākā Beach
- The typical guest profile for Airbnb in Ruakākā Beach consists of primarily domestic travelers (81%), often arriving from nearby Auckland, typically belonging to the Post-2000s (Gen Z/Alpha) group (50%), primarily speaking English or French.
- Domestic travelers account for 81.0% of guests.
- Key international markets include New Zealand (81%) and United States (5.4%).
- Top languages spoken are English (74.5%) followed by French (3.6%).
- A significant demographic segment is the Post-2000s (Gen Z/Alpha) group, representing 50% of guests.
Recommendations for Hosts
- Target domestic marketing efforts towards travelers from Auckland and Tauranga.
- Tailor amenities and listing descriptions to appeal to the dominant Post-2000s (Gen Z/Alpha) demographic (e.g., highlight fast WiFi, smart home features, local guides).
- Highlight unique local experiences or amenities relevant to the primary guest profile.
- Consider seasonal promotions aligned with peak travel times for key origin markets.
Nearby Short-Term Rental Market Comparison
How does the Ruakākā Beach Airbnb market stack up against its neighbors? Compare key performance metrics like average monthly revenue, ADR, and occupancy rates in surrounding areas to understand the broader regional STR landscape.
| Market | Active Properties | Monthly Revenue | Daily Rate | Avg. Occupancy |
|---|---|---|---|---|
| Hot Water Beach | 27 | $2,949 | $257.55 | 50% |
| Whananaki | 14 | $2,368 | $364.38 | 36% |
| Waiheke | 580 | $2,274 | $338.47 | 32% |
| Hahei | 104 | $2,241 | $260.25 | 39% |
| Opito Bay | 16 | $1,911 | $294.47 | 29% |
| Waitematā | 1,525 | $1,702 | $146.61 | 50% |
| Tutukaka | 44 | $1,659 | $203.24 | 36% |
| Langs Beach | 26 | $1,598 | $343.61 | 29% |
| Baylys Beach | 12 | $1,559 | $131.00 | 46% |
| Paihia | 10 | $1,509 | $185.24 | 40% |