Langs Beach Airbnb Market Analysis 2026: Short Term Rental Data & Vacation Rental Statistics in Northland, New Zealand
Is Airbnb profitable in Langs Beach in 2026? Explore comprehensive Airbnb analytics for Langs Beach, Northland, New Zealand to uncover income potential. This 2026 STR market report for Langs Beach, based on AirROI data from February 2025 to January 2026, reveals key trends in the niche market of 26 active listings.
Whether you're considering an Airbnb investment in Langs Beach, optimizing your existing vacation rental, or exploring rental arbitrage opportunities, understanding the Langs Beach Airbnb data is crucial. Leveraging the low regulation environment is key to maximizing your short term rental income potential. Let's dive into the specifics.
Key Langs Beach Airbnb Performance Metrics Overview
Monthly Airbnb Revenue Variations & Income Potential in Langs Beach (2026)
Understanding the monthly revenue variations for Airbnb listings in Langs Beach is key to maximizing your short term rental income potential. Seasonality significantly impacts earnings. Our analysis, based on data from the past 12 months, shows that the peak revenue month for STRs in Langs Beach is typically January, while August often presents the lowest earnings, highlighting opportunities for strategic pricing adjustments during shoulder and low seasons. Explore the typical Airbnb income in Langs Beach across different performance tiers:
- Best-in-class properties (Top 10%) achieve $4,825+ monthly, often utilizing dynamic pricing and superior guest experiences.
- Strong performing properties (Top 25%) earn $3,015 or more, indicating effective management and desirable locations/amenities.
- Typical properties (Median) generate around $1,497 per month, representing the average market performance.
- Entry-level properties (Bottom 25%) see earnings around $867, often with potential for optimization.
Average Monthly Airbnb Earnings Trend in Langs Beach
Langs Beach Airbnb Occupancy Rate Trends (2026)
Maximize your bookings by understanding the Langs Beach STR occupancy trends. Seasonal demand shifts significantly influence how often properties are booked. Typically, Februarysees the highest demand (peak season occupancy), while August experiences the lowest (low season). Effective strategies, like adjusting minimum stays or offering promotions, can boost occupancy during slower periods. Here's how different property tiers perform in Langs Beach:
- Best-in-class properties (Top 10%) achieve 60%+ occupancy, indicating high desirability and potentially optimized availability.
- Strong performing properties (Top 25%) maintain 46% or higher occupancy, suggesting good market fit and guest satisfaction.
- Typical properties (Median) have an occupancy rate around 25%.
- Entry-level properties (Bottom 25%) average 12% occupancy, potentially facing higher vacancy.
Average Monthly Occupancy Rate Trend in Langs Beach
Average Daily Rate (ADR) Airbnb Trends in Langs Beach (2026)
Effective short term rental pricing strategy in Langs Beach involves understanding monthly ADR fluctuations. The Average Daily Rate (ADR) for Airbnb in Langs Beach typically peaks in January and dips lowest during May. Leveraging Airbnb dynamic pricing tools or strategies based on this seasonality can significantly boost revenue. Here's a look at the typical nightly rates achieved:
- Best-in-class properties (Top 10%) command rates of $552+ per night, often due to premium features or locations.
- Strong performing properties (Top 25%) achieve nightly rates of $378 or more.
- Typical properties (Median) charge around $242 per night.
- Entry-level properties (Bottom 25%) earn around $164 per night.
Average Daily Rate (ADR) Trend by Month in Langs Beach
Get Live Langs Beach Market Intelligence 👇

Explore Real-time Analytics
Airbnb Seasonality Analysis & Trends in Langs Beach (2026)
Peak Season (January, December, February)
- Revenue averages $3,676 per month
- Occupancy rates average 46.5%
- Daily rates average $344
Shoulder Season
- Revenue averages $2,144 per month
- Occupancy maintains around 28.4%
- Daily rates hold near $324
Low Season (May, August, September)
- Revenue drops to average $1,215 per month
- Occupancy decreases to average 19.7%
- Daily rates adjust to average $322
Seasonality Insights for Langs Beach
- The Airbnb seasonality in Langs Beach shows highly seasonal trends requiring careful strategy. While the sections above show seasonal averages, it's also insightful to look at the extremes:
- During the high season, the absolute peak month showcases Langs Beach's highest earning potential, with monthly revenues capable of climbing to $4,102, occupancy reaching a high of 51.0%, and ADRs peaking at $352.
- Conversely, the slowest single month of the year, typically falling within the low season, marks the market's lowest point. In this month, revenue might dip to $1,081, occupancy could drop to 15.9%, and ADRs may adjust down to $310.
- Understanding both the seasonal averages and these monthly peaks and troughs in revenue, occupancy, and ADR is crucial for maximizing your Airbnb profit potential in Langs Beach.
Seasonal Strategies for Maximizing Profit
- Peak Season: Maximize revenue through premium pricing and potentially longer minimum stays. Ensure high availability.
- Low Season: Offer competitive pricing, special promotions (e.g., extended stay discounts), and flexible cancellation policies. Target off-season travelers like remote workers or budget-conscious guests.
- Shoulder Seasons: Implement dynamic pricing that balances peak and low rates. Target weekend travelers or specific events. Offer slightly more flexible terms than peak season.
- Regularly analyze your own performance against these Langs Beach seasonality benchmarks and adjust your pricing and availability strategy accordingly.
Best Areas for Airbnb Investment in Langs Beach (2026)
Exploring the top neighborhoods for short-term rentals in Langs Beach? This section highlights key areas, outlining why they are attractive for hosts and guests, along with notable local attractions. Consider these locations based on your target guest profile and investment strategy.
| Neighborhood / Area | Why Host Here? (Target Guests & Appeal) | Key Attractions & Landmarks |
|---|---|---|
| Langs Beach | A serene beach destination known for its beautiful landscapes and relaxed atmosphere. Perfect for families and couples looking for a getaway with beach access and stunning views. | Langs Beach, Waipu Cove, Bream Head Scenic Reserve, Matauri Bay, Uretiti Beach, Ngunguru Sandspit |
| Waipu | A charming coastal village with rich Scottish heritage, known for its annual events and welcoming community. A great place for visitors interested in culture and natural beauty. | Waipu Caves, Waipu Museum, Ruakaka Beach, Langs Beach, local markets, Bream Bay |
| Mangawhai Heads | A popular spot for holidaymakers, offering beautiful beaches and outdoor activities. Attracts surfers and nature lovers with its vibrant coastal vibe. | Mangawhai Heads Beach, Mangawhai Estuary, Mangawhai Scenic Reserve, The Mangawhai Trail, Mangawhai Village Market |
| Matakana | Famous for its wineries and markets, this area has a burgeoning foodie scene, appealing to culinary enthusiasts and holidaymakers alike. | Matakana Village, Matakana Farmers' Market, Brick Bay Vineyard, Pakiri Beach, Warkworth Town |
| Puhoi | A picturesque village with a rich history, offering a peaceful retreat and close proximity to outdoor adventures and the coast. | Puhoi River, Historical Puhoi Village, Puhoi Cheese Company, Hiking trails, Kayaking |
| Oakura Bay | Known for its stunning beach and fishing opportunities, this destination attracts those who appreciate coastal life and outdoor activities. | Oakura Bay Beach, Fishing Charters, Kayaking, Scenic Views, Relaxed Atmosphere |
| Takirau | A hidden gem featuring incredible natural beauty and tranquil surroundings, ideal for those seeking privacy and serenity. | Stunning coastline, Nature walks, Secluded beaches, Birdwatching, Photogenic landscapes |
| Whangarei Heads | A beautiful coastal area with breathtaking views and outdoor activities, attracting both nature lovers and adventure seekers. | Whangarei Heads Beach, Mount Manaia, Whangaumu Bay, Adventure walks, Fishing spots |
Understanding Airbnb License Requirements & STR Laws in Langs Beach (2026)
While Langs Beach, Northland, New Zealand currently shows low STR regulations, specific Airbnb license requirements might still exist or change. Always verify the latest short term rental regulations and Airbnb license requirements directly with local government authorities for Langs Beach to ensure full compliance before hosting.
(Source: AirROI data, 2026, finding no licensed listings among those analyzed)
Top Performing Airbnb Properties in Langs Beach (2026)
Benchmark your potential! Explore examples of top-performing Airbnb properties in Langs Beachbased on Trailing Twelve Month (TTM) revenue. Analyze their characteristics, revenue, occupancy rate, and ADR to understand what drives success in this market.
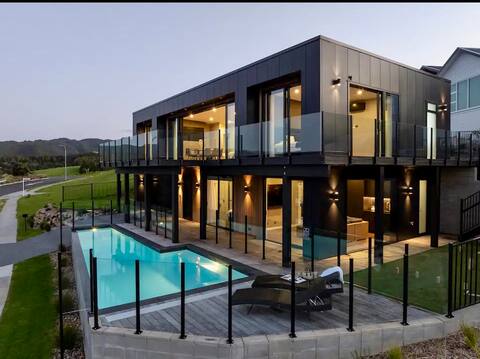
Infinity Villa Langs Beach. Pool, Beach, Luxury.
Entire Place • 5 bedrooms

Beachfront Bliss - prime beachfront location
Entire Place • 3 bedrooms

Langs Beach House
Entire Place • 4 bedrooms
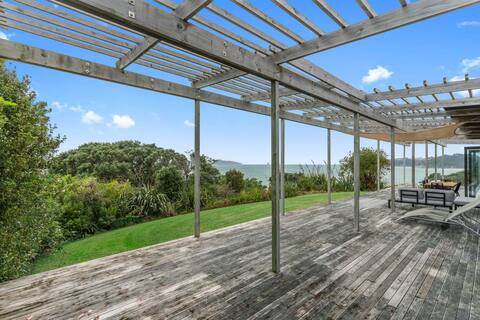
Oceanview Sanctuary - modern, sunny with views
Entire Place • 3 bedrooms
Langs Family Home
Entire Place • 4 bedrooms

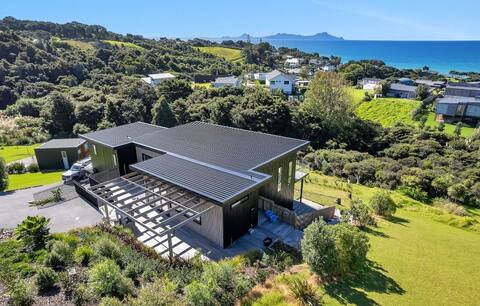
Langs Beach House - modern bach in prime location
Entire Place • 3 bedrooms
Note: Performance varies based on location, size, amenities, seasonality, and management quality. Data reflects the past 12 months.
Top Performing Airbnb Hosts in Langs Beach (2026)
Learn from the best! This table showcases top-performing Airbnb hosts in Langs Beach based on the number of properties managed and estimated total revenue over the past year. Analyze their scale and performance metrics.
| Host Name | Properties | Grossing Revenue | Stay Reviews | Avg Rating |
|---|---|---|---|---|
| Bach Stay - Mangawhai | 4 | $147,737 | 165 | 4.81/5.0 |
| Shivani | 2 | $105,404 | 52 | 4.92/5.0 |
| Barbara | 1 | $46,579 | 275 | 4.96/5.0 |
| Rebecca | 1 | $25,973 | 7 | 5.00/5.0 |
| Denise | 1 | $24,337 | 94 | 4.95/5.0 |
| David | 1 | $17,782 | 50 | 4.90/5.0 |
| Linda | 1 | $17,613 | 2 | Not Rated |
| Bachcare | 5 | $16,793 | 22 | 4.72/5.0 |
| Wendy | 1 | $16,687 | 46 | 5.00/5.0 |
| Andersons | 1 | $15,928 | 2 | Not Rated |
Analyzing the strategies of top hosts, such as their property selection, pricing, and guest communication, can offer valuable lessons for optimizing your own Airbnb operations in Langs Beach.
Dive Deeper: Advanced Langs Beach STR Market Data (2026)
Ready to unlock more insights? AirROI provides access to advanced metrics and comprehensive Airbnb data for Langs Beach. Explore detailed analytics beyond this report to refine your investment strategy, optimize pricing, and maximize your vacation rental profits.
Explore Advanced MetricsLangs Beach Short-Term Rental Market Composition (2026): Property & Room Types
Room Type Distribution
Property Type Distribution
Market Composition Insights for Langs Beach
- The Langs Beach Airbnb market composition is heavily skewed towards Entire Home/Apt listings, which make up 100% of the 26 active rentals. This indicates strong guest preference for privacy and space.
- Looking at the property type distribution in Langs Beach, House properties are the most common (73.1%), reflecting the local real estate landscape.
- Houses represent a significant 73.1% portion, catering likely to families or larger groups.
- Smaller segments like hotel/boutique (combined 3.8%) offer potential for unique stay experiences.
Langs Beach Airbnb Room Capacity Analysis (2026): Bedroom Distribution
Distribution of Listings by Number of Bedrooms
Room Capacity Insights for Langs Beach
- The dominant room capacity in Langs Beach is 3 bedrooms listings, making up 38.5% of the market. This suggests a strong demand for properties suitable for families or small groups.
- Together, 3 bedrooms and 4 bedrooms properties represent 61.6% of the active Airbnb listings in Langs Beach, indicating a high concentration in these sizes.
- A significant 69.3% of listings offer 3+ bedrooms, catering to larger groups and families seeking more space in Langs Beach.
Langs Beach Vacation Rental Guest Capacity Trends (2026)
Distribution of Listings by Guest Capacity
Guest Capacity Insights for Langs Beach
- The most common guest capacity trend in Langs Beach vacation rentals is listings accommodating 8+ guests (50%). This suggests the primary traveler segment is likely larger groups.
- Properties designed for 8+ guests and 6 guests dominate the Langs Beach STR market, accounting for 69.2% of listings.
- 69.2% of properties accommodate 6+ guests, serving the market segment for larger families or group travel in Langs Beach.
- On average, properties in Langs Beach are equipped to host 6.2 guests.
Langs Beach Airbnb Booking Patterns (2026): Available vs. Booked Days
Available Days Distribution
Booked Days Distribution
Booking Pattern Insights for Langs Beach
- The most common availability pattern in Langs Beach falls within the 271-366 days range, representing 65.4% of listings. This suggests many properties have significant open periods on their calendars.
- Approximately 96.2% of listings show high availability (181+ days open annually), indicating potential for increased bookings or specific owner usage patterns.
- For booked days, the 31-90 days range is most frequent in Langs Beach (34.6%), reflecting common guest stay durations or potential owner blocking patterns.
- A notable 3.8% of properties secure long booking periods (181+ days booked per year), highlighting successful long-term rental strategies or significant owner usage.
Langs Beach Airbnb Minimum Stay Requirements Analysis
Distribution of Listings by Minimum Night Requirement
1 Night
2 listings
7.7% of total
2 Nights
9 listings
34.6% of total
4-6 Nights
1 listings
3.8% of total
30+ Nights
14 listings
53.8% of total
Key Insights
- The most prevalent minimum stay requirement in Langs Beach is 30+ Nights, adopted by 53.8% of listings. This highlights the market's preference for longer commitments.
- A significant segment (53.8%) caters to monthly stays (30+ nights) in Langs Beach, pointing to opportunities in the extended-stay market.
Recommendations
- Align with the market by considering a 30+ Nights minimum stay, as 53.8% of Langs Beach hosts use this setting.
- If feasible, allowing 1-night stays, especially midweek or during low season, could capture last-minute bookings, as only 7.7% currently do.
- A 2-night minimum appears standard (34.6%). Consider this for weekends or peak periods.
- Explore offering discounts for stays of 30+ nights to attract the 53.8% of the market seeking extended stays.
- Adjust minimum nights based on seasonality – potentially shorter during low season and longer during peak demand periods in Langs Beach.
Langs Beach Airbnb Cancellation Policy Trends Analysis (2026)
Flexible
3 listings
11.5% of total
Moderate
4 listings
15.4% of total
Firm
19 listings
73.1% of total
Cancellation Policy Insights for Langs Beach
- The prevailing Airbnb cancellation policy trend in Langs Beach is Firm, used by 73.1% of listings.
- A majority (73.1%) of hosts in Langs Beach utilize Firm or Strict policies, indicating a market where hosts prioritize booking security.
Recommendations for Hosts
- Consider adopting a Firm policy to align with the 73.1% market standard in Langs Beach.
- Regularly review your cancellation policy against competitors and market demand shifts in Langs Beach.
Langs Beach STR Booking Lead Time Analysis (2026)
Average Booking Lead Time by Month
Booking Lead Time Insights for Langs Beach
- The overall average booking lead time for vacation rentals in Langs Beach is 61 days.
- Guests book furthest in advance for stays during December (average 120 days), likely coinciding with peak travel demand or local events.
- The shortest booking windows occur for stays in September (average 14 days), indicating more last-minute travel plans during this time.
- Seasonally, Winter (89 days avg.) sees the longest lead times, while Summer (21 days avg.) has the shortest, reflecting typical travel planning cycles.
Recommendations for Hosts
- Use the overall average lead time (61 days) as a baseline for your pricing and availability strategy in Langs Beach.
- For December stays, consider implementing length-of-stay discounts or slightly higher rates for bookings made less than 120 days out to capitalize on advance planning.
- During September, focus on last-minute booking availability and promotions, as guests book with very short notice (14 days avg.).
- Target marketing efforts for the Winter season well in advance (at least 89 days) to capture early planners.
- Monitor your own booking lead times against these Langs Beach averages to identify opportunities for dynamic pricing adjustments.
Popular & Essential Airbnb Amenities in Langs Beach (2026)
Amenity Prevalence
Amenity Insights for Langs Beach
- Essential amenities in Langs Beach that guests expect include: Free parking on premises, Smoke alarm. Lacking these (any) could significantly impact bookings.
- Popular amenities like Kitchen, Wifi, TV are common but not universal. Offering these can provide a competitive edge.
- Warning: Wifi is not universally provided but is considered essential globally. Ensure reliable Wifi is offered.
Recommendations for Hosts
- Ensure your listing includes all essential amenities for Langs Beach: Free parking on premises, Smoke alarm.
- Consider adding popular differentiators like Kitchen or Wifi to increase appeal.
- Highlight unique or less common amenities you offer (e.g., hot tub, dedicated workspace, EV charger) in your listing description and photos.
- Regularly check competitor amenities in Langs Beach to stay competitive.
Langs Beach Airbnb Guest Demographics & Profile Analysis (2026)
Guest Profile Summary for Langs Beach
- The typical guest profile for Airbnb in Langs Beach consists of primarily domestic travelers (78%), often arriving from nearby Auckland, typically belonging to the Post-2000s (Gen Z/Alpha) group (50%), primarily speaking English or German.
- Domestic travelers account for 78.1% of guests.
- Key international markets include New Zealand (78.1%) and United Kingdom (6.6%).
- Top languages spoken are English (65.5%) followed by German (10.9%).
- A significant demographic segment is the Post-2000s (Gen Z/Alpha) group, representing 50% of guests.
Recommendations for Hosts
- Target domestic marketing efforts towards travelers from Auckland and Wellington.
- Tailor amenities and listing descriptions to appeal to the dominant Post-2000s (Gen Z/Alpha) demographic (e.g., highlight fast WiFi, smart home features, local guides).
- Highlight unique local experiences or amenities relevant to the primary guest profile.
- Consider seasonal promotions aligned with peak travel times for key origin markets.
Nearby Short-Term Rental Market Comparison
How does the Langs Beach Airbnb market stack up against its neighbors? Compare key performance metrics like average monthly revenue, ADR, and occupancy rates in surrounding areas to understand the broader regional STR landscape.
| Market | Active Properties | Monthly Revenue | Daily Rate | Avg. Occupancy |
|---|---|---|---|---|
| Hot Water Beach | 27 | $2,949 | $257.55 | 50% |
| Whananaki | 14 | $2,368 | $364.38 | 36% |
| Waiheke | 580 | $2,274 | $338.47 | 32% |
| Hahei | 104 | $2,241 | $260.25 | 39% |
| Opito Bay | 16 | $1,911 | $294.47 | 29% |
| Karapiro | 40 | $1,865 | $206.22 | 37% |
| Waitematā | 1,525 | $1,702 | $146.61 | 50% |
| Rukuhia | 10 | $1,675 | $216.31 | 33% |
| Tamahere | 76 | $1,665 | $198.77 | 39% |
| Tutukaka | 44 | $1,659 | $203.24 | 36% |