Bay of Islands-Whangaroa Community Airbnb Market Analysis 2026: Short Term Rental Data & Vacation Rental Statistics in Northland, New Zealand
Is Airbnb profitable in Bay of Islands-Whangaroa Community in 2026? Explore comprehensive Airbnb analytics for Bay of Islands-Whangaroa Community, Northland, New Zealand to uncover income potential. This 2026 STR market report for Bay of Islands-Whangaroa Community, based on AirROI data from February 2025 to January 2026, reveals key trends in the market of 766 active listings.
Whether you're considering an Airbnb investment in Bay of Islands-Whangaroa Community, optimizing your existing vacation rental, or exploring rental arbitrage opportunities, understanding the Bay of Islands-Whangaroa Community Airbnb data is crucial. Leveraging the low regulation environment is key to maximizing your short term rental income potential. Let's dive into the specifics.
Key Bay of Islands-Whangaroa Community Airbnb Performance Metrics Overview
Monthly Airbnb Revenue Variations & Income Potential in Bay of Islands-Whangaroa Community (2026)
Understanding the monthly revenue variations for Airbnb listings in Bay of Islands-Whangaroa Community is key to maximizing your short term rental income potential. Seasonality significantly impacts earnings. Our analysis, based on data from the past 12 months, shows that the peak revenue month for STRs in Bay of Islands-Whangaroa Community is typically February, while August often presents the lowest earnings, highlighting opportunities for strategic pricing adjustments during shoulder and low seasons. Explore the typical Airbnb income in Bay of Islands-Whangaroa Community across different performance tiers:
- Best-in-class properties (Top 10%) achieve $4,472+ monthly, often utilizing dynamic pricing and superior guest experiences.
- Strong performing properties (Top 25%) earn $2,697 or more, indicating effective management and desirable locations/amenities.
- Typical properties (Median) generate around $1,451 per month, representing the average market performance.
- Entry-level properties (Bottom 25%) see earnings around $733, often with potential for optimization.
Average Monthly Airbnb Earnings Trend in Bay of Islands-Whangaroa Community
Bay of Islands-Whangaroa Community Airbnb Occupancy Rate Trends (2026)
Maximize your bookings by understanding the Bay of Islands-Whangaroa Community STR occupancy trends. Seasonal demand shifts significantly influence how often properties are booked. Typically, Februarysees the highest demand (peak season occupancy), while June experiences the lowest (low season). Effective strategies, like adjusting minimum stays or offering promotions, can boost occupancy during slower periods. Here's how different property tiers perform in Bay of Islands-Whangaroa Community:
- Best-in-class properties (Top 10%) achieve 74%+ occupancy, indicating high desirability and potentially optimized availability.
- Strong performing properties (Top 25%) maintain 54% or higher occupancy, suggesting good market fit and guest satisfaction.
- Typical properties (Median) have an occupancy rate around 32%.
- Entry-level properties (Bottom 25%) average 15% occupancy, potentially facing higher vacancy.
Average Monthly Occupancy Rate Trend in Bay of Islands-Whangaroa Community
Average Daily Rate (ADR) Airbnb Trends in Bay of Islands-Whangaroa Community (2026)
Effective short term rental pricing strategy in Bay of Islands-Whangaroa Community involves understanding monthly ADR fluctuations. The Average Daily Rate (ADR) for Airbnb in Bay of Islands-Whangaroa Community typically peaks in January and dips lowest during August. Leveraging Airbnb dynamic pricing tools or strategies based on this seasonality can significantly boost revenue. Here's a look at the typical nightly rates achieved:
- Best-in-class properties (Top 10%) command rates of $415+ per night, often due to premium features or locations.
- Strong performing properties (Top 25%) achieve nightly rates of $273 or more.
- Typical properties (Median) charge around $160 per night.
- Entry-level properties (Bottom 25%) earn around $104 per night.
Average Daily Rate (ADR) Trend by Month in Bay of Islands-Whangaroa Community
Get Live Bay of Islands-Whangaroa Community Market Intelligence 👇

Explore Real-time Analytics
Airbnb Seasonality Analysis & Trends in Bay of Islands-Whangaroa Community (2026)
Peak Season (February, December, January)
- Revenue averages $2,883 per month
- Occupancy rates average 45.6%
- Daily rates average $237
Shoulder Season
- Revenue averages $1,993 per month
- Occupancy maintains around 36.2%
- Daily rates hold near $211
Low Season (June, August, September)
- Revenue drops to average $1,433 per month
- Occupancy decreases to average 27.9%
- Daily rates adjust to average $206
Seasonality Insights for Bay of Islands-Whangaroa Community
- The Airbnb seasonality in Bay of Islands-Whangaroa Community shows highly seasonal trends requiring careful strategy. While the sections above show seasonal averages, it's also insightful to look at the extremes:
- During the high season, the absolute peak month showcases Bay of Islands-Whangaroa Community's highest earning potential, with monthly revenues capable of climbing to $3,088, occupancy reaching a high of 53.9%, and ADRs peaking at $247.
- Conversely, the slowest single month of the year, typically falling within the low season, marks the market's lowest point. In this month, revenue might dip to $1,390, occupancy could drop to 26.9%, and ADRs may adjust down to $204.
- Understanding both the seasonal averages and these monthly peaks and troughs in revenue, occupancy, and ADR is crucial for maximizing your Airbnb profit potential in Bay of Islands-Whangaroa Community.
Seasonal Strategies for Maximizing Profit
- Peak Season: Maximize revenue through premium pricing and potentially longer minimum stays. Ensure high availability.
- Low Season: Offer competitive pricing, special promotions (e.g., extended stay discounts), and flexible cancellation policies. Target off-season travelers like remote workers or budget-conscious guests.
- Shoulder Seasons: Implement dynamic pricing that balances peak and low rates. Target weekend travelers or specific events. Offer slightly more flexible terms than peak season.
- Regularly analyze your own performance against these Bay of Islands-Whangaroa Community seasonality benchmarks and adjust your pricing and availability strategy accordingly.
Best Areas for Airbnb Investment in Bay of Islands-Whangaroa Community (2026)
Exploring the top neighborhoods for short-term rentals in Bay of Islands-Whangaroa Community? This section highlights key areas, outlining why they are attractive for hosts and guests, along with notable local attractions. Consider these locations based on your target guest profile and investment strategy.
| Neighborhood / Area | Why Host Here? (Target Guests & Appeal) | Key Attractions & Landmarks |
|---|---|---|
| Paihia | The gateway to the Bay of Islands, Paihia is a popular tourist destination with stunning beaches, water activities, and restaurants. A vibrant place for visitors seeking adventure and relaxation. | Waitangi Treaty Grounds, Russell Island, Dolphin Watching Tours, Haruru Falls, Christ Church Russell |
| Russell | Historic town with charming colonial buildings and beautiful beaches, Russell is perfect for tourists looking for a mix of history and natural beauty. Known for its relaxed vibe and great local dining options. | Pahia Beach, North Head Historic Reserve, Russell Museum, Okiato, Tapeka Point |
| Kerikeri | Rich in history and natural beauty, Kerikeri is famous for its orchards, wineries, and the beautiful Kerikeri River. It offers a tranquil retreat for visitors looking to explore the countryside. | Kerikeri Mission Station, Rainbow Falls, Stone Store, The Packing Shed, Aroha Island |
| Ngawha Springs | Famous for its unique geothermal springs, Ngawha Springs attracts visitors seeking relaxation and wellness through natural hot pools. A unique spot for folks looking for rejuvenation. | Ngawha Hot Springs, Puketi Forest, Kaikohe, Far North Regional Museum, Maori Cultural Experiences |
| Haruru Falls | Known for its scenic waterfall, Haruru Falls is a great base for outdoor lovers. A picturesque area perfect for those interested in nature excursions and water activities. | Haruru Falls, Waitangi River, Biking Trails, Kohukohu, Cape Reinga |
| Opononi | A stunning coastal area known for its beautiful Hokianga Harbour. Opononi is rich in Maori history and offers various outdoor activities including beach sports and sightseeing. | Opononi Beach, Hokianga Harbour, Sand Dunes, Waipoua Forest, The giant Kauri trees |
| Mangonui | A quaint fishing village with a rich history, Mangonui attracts visitors for its seaside charm and waterfront dining. A great spot for those looking to experience local Maori culture and seafood. | Mangonui Fish Shop, Mangonui Heritage Trail, Doubtless Bay, Coastal Walks, Local Art Galleries |
| Kaitaia | As the northernmost town of New Zealand, Kaitaia is the gateway to the Far North and offers rich natural experiences, making it popular for travelers seeking adventure and culture. | Te Ahu Center, Ahipara Beach, Tokerau Beach, Waitangi Day Celebrations, Hiking Trails to Cape Reinga |
Understanding Airbnb License Requirements & STR Laws in Bay of Islands-Whangaroa Community (2026)
While Bay of Islands-Whangaroa Community, Northland, New Zealand currently shows low STR regulations, specific Airbnb license requirements might still exist or change. Always verify the latest short term rental regulations and Airbnb license requirements directly with local government authorities for Bay of Islands-Whangaroa Community to ensure full compliance before hosting.
(Source: AirROI data, 2026, based on 0% licensed listings)
Top Performing Airbnb Properties in Bay of Islands-Whangaroa Community (2026)
Benchmark your potential! Explore examples of top-performing Airbnb properties in Bay of Islands-Whangaroa Communitybased on Trailing Twelve Month (TTM) revenue. Analyze their characteristics, revenue, occupancy rate, and ADR to understand what drives success in this market.

Luxury Seaside Harding House - 5 Bathrooms
Entire Place • 6 bedrooms
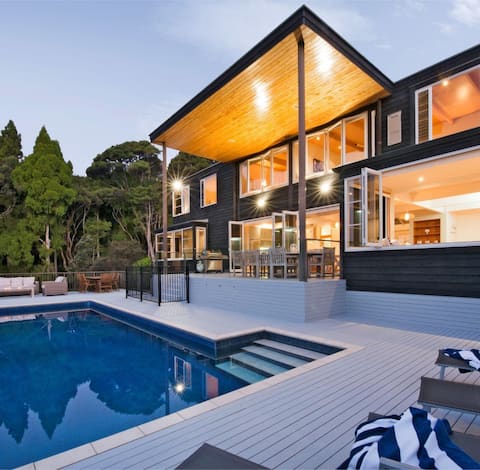
Resort-Style Paihia - with Heated Pool!
Entire Place • 5 bedrooms
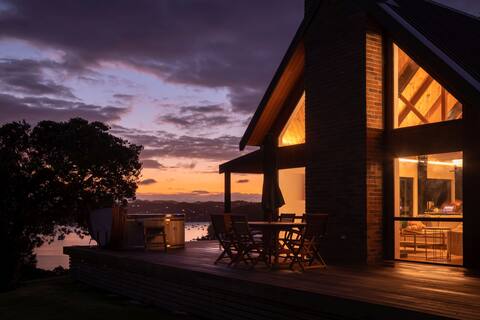
Top House - unrivalled views and privacy
Entire Place • 3 bedrooms

The Tree Tops Oasis
Entire Place • 4 bedrooms
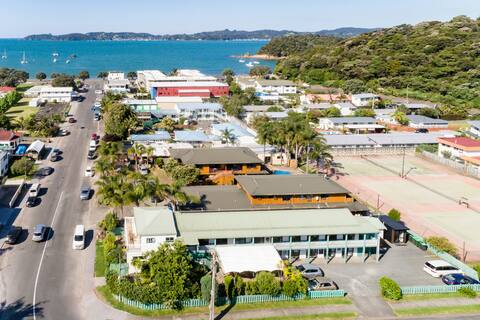
Rent an Entire Hotel - Bay of Islands Lodge
Private Room • 12 bedrooms

Paroa Retreat, Award Winning Luxury
Entire Place • 3 bedrooms
Note: Performance varies based on location, size, amenities, seasonality, and management quality. Data reflects the past 12 months.
Top Performing Airbnb Hosts in Bay of Islands-Whangaroa Community (2026)
Learn from the best! This table showcases top-performing Airbnb hosts in Bay of Islands-Whangaroa Community based on the number of properties managed and estimated total revenue over the past year. Analyze their scale and performance metrics.
| Host Name | Properties | Grossing Revenue | Stay Reviews | Avg Rating |
|---|---|---|---|---|
| John | 13 | $446,547 | 416 | 4.89/5.0 |
| Cameron | 20 | $420,363 | 126 | 4.71/5.0 |
| Bachcare | 38 | $394,916 | 353 | 4.61/5.0 |
| Kelly | 8 | $289,490 | 778 | 4.93/5.0 |
| Lee | 11 | $203,563 | 612 | 4.58/5.0 |
| Clive | 4 | $202,377 | 509 | 4.94/5.0 |
| Sweet Haven Retreats | 5 | $155,999 | 182 | 4.80/5.0 |
| Maree | 2 | $152,482 | 98 | 4.99/5.0 |
| Angela | 4 | $148,259 | 80 | 4.89/5.0 |
| Christine | 4 | $142,564 | 161 | 4.92/5.0 |
Analyzing the strategies of top hosts, such as their property selection, pricing, and guest communication, can offer valuable lessons for optimizing your own Airbnb operations in Bay of Islands-Whangaroa Community.
Dive Deeper: Advanced Bay of Islands-Whangaroa Community STR Market Data (2026)
Ready to unlock more insights? AirROI provides access to advanced metrics and comprehensive Airbnb data for Bay of Islands-Whangaroa Community. Explore detailed analytics beyond this report to refine your investment strategy, optimize pricing, and maximize your vacation rental profits.
Explore Advanced MetricsBay of Islands-Whangaroa Community Short-Term Rental Market Composition (2026): Property & Room Types
Room Type Distribution
Property Type Distribution
Market Composition Insights for Bay of Islands-Whangaroa Community
- The Bay of Islands-Whangaroa Community Airbnb market composition is heavily skewed towards Entire Home/Apt listings, which make up 83.8% of the 766 active rentals. This indicates strong guest preference for privacy and space.
- Looking at the property type distribution in Bay of Islands-Whangaroa Community, House properties are the most common (50.7%), reflecting the local real estate landscape.
- Houses represent a significant 50.7% portion, catering likely to families or larger groups.
- The presence of 14.4% Hotel/Boutique listings indicates integration with traditional hospitality.
- Smaller segments like unique stays (combined 0.3%) offer potential for unique stay experiences.
Bay of Islands-Whangaroa Community Airbnb Room Capacity Analysis (2026): Bedroom Distribution
Distribution of Listings by Number of Bedrooms
Room Capacity Insights for Bay of Islands-Whangaroa Community
- The dominant room capacity in Bay of Islands-Whangaroa Community is 1 bedroom listings, making up 31.5% of the market. This suggests a strong demand for properties suitable for couples or solo travelers.
- Together, 1 bedroom and 2 bedrooms properties represent 53.2% of the active Airbnb listings in Bay of Islands-Whangaroa Community, indicating a high concentration in these sizes.
- A significant 32.9% of listings offer 3+ bedrooms, catering to larger groups and families seeking more space in Bay of Islands-Whangaroa Community.
Bay of Islands-Whangaroa Community Vacation Rental Guest Capacity Trends (2026)
Distribution of Listings by Guest Capacity
Guest Capacity Insights for Bay of Islands-Whangaroa Community
- The most common guest capacity trend in Bay of Islands-Whangaroa Community vacation rentals is listings accommodating 2 guests (27.4%). This suggests the primary traveler segment is likely couples or solo travelers.
- Properties designed for 2 guests and 4 guests dominate the Bay of Islands-Whangaroa Community STR market, accounting for 47.4% of listings.
- 35.1% of properties accommodate 6+ guests, serving the market segment for larger families or group travel in Bay of Islands-Whangaroa Community.
- On average, properties in Bay of Islands-Whangaroa Community are equipped to host 4.1 guests.
Bay of Islands-Whangaroa Community Airbnb Booking Patterns (2026): Available vs. Booked Days
Available Days Distribution
Booked Days Distribution
Booking Pattern Insights for Bay of Islands-Whangaroa Community
- The most common availability pattern in Bay of Islands-Whangaroa Community falls within the 271-366 days range, representing 56.9% of listings. This suggests many properties have significant open periods on their calendars.
- Approximately 87.3% of listings show high availability (181+ days open annually), indicating potential for increased bookings or specific owner usage patterns.
- For booked days, the 31-90 days range is most frequent in Bay of Islands-Whangaroa Community (32.8%), reflecting common guest stay durations or potential owner blocking patterns.
- A notable 13.2% of properties secure long booking periods (181+ days booked per year), highlighting successful long-term rental strategies or significant owner usage.
Bay of Islands-Whangaroa Community Airbnb Minimum Stay Requirements Analysis
Distribution of Listings by Minimum Night Requirement
1 Night
150 listings
19.6% of total
2 Nights
273 listings
35.6% of total
3 Nights
33 listings
4.3% of total
4-6 Nights
18 listings
2.3% of total
7-29 Nights
4 listings
0.5% of total
30+ Nights
288 listings
37.6% of total
Key Insights
- The most prevalent minimum stay requirement in Bay of Islands-Whangaroa Community is 30+ Nights, adopted by 37.6% of listings. This highlights the market's preference for longer commitments.
- A significant segment (37.6%) caters to monthly stays (30+ nights) in Bay of Islands-Whangaroa Community, pointing to opportunities in the extended-stay market.
Recommendations
- Align with the market by considering a 30+ Nights minimum stay, as 37.6% of Bay of Islands-Whangaroa Community hosts use this setting.
- If feasible, allowing 1-night stays, especially midweek or during low season, could capture last-minute bookings, as only 19.6% currently do.
- A 2-night minimum appears standard (35.6%). Consider this for weekends or peak periods.
- Explore offering discounts for stays of 30+ nights to attract the 37.6% of the market seeking extended stays.
- Adjust minimum nights based on seasonality – potentially shorter during low season and longer during peak demand periods in Bay of Islands-Whangaroa Community.
Bay of Islands-Whangaroa Community Airbnb Cancellation Policy Trends Analysis (2026)
Limited
9 listings
1.2% of total
Super Strict 30 Days
33 listings
4.3% of total
Super Strict 60 Days
7 listings
0.9% of total
Flexible
161 listings
21% of total
Moderate
220 listings
28.8% of total
Firm
279 listings
36.5% of total
Strict
56 listings
7.3% of total
Cancellation Policy Insights for Bay of Islands-Whangaroa Community
- The prevailing Airbnb cancellation policy trend in Bay of Islands-Whangaroa Community is Firm, used by 36.5% of listings.
- There's a relatively balanced mix between guest-friendly (49.8%) and stricter (43.8%) policies, offering choices for different guest needs.
- Strict cancellation policies are quite rare (7.3%), potentially making listings with this policy less competitive unless justified by high demand or property type.
Recommendations for Hosts
- Consider adopting a Firm policy to align with the 36.5% market standard in Bay of Islands-Whangaroa Community.
- Using a Strict policy might deter some guests, as only 7.3% of listings use it. Evaluate if potential revenue protection outweighs possible lower booking rates.
- Regularly review your cancellation policy against competitors and market demand shifts in Bay of Islands-Whangaroa Community.
Bay of Islands-Whangaroa Community STR Booking Lead Time Analysis (2026)
Average Booking Lead Time by Month
Booking Lead Time Insights for Bay of Islands-Whangaroa Community
- The overall average booking lead time for vacation rentals in Bay of Islands-Whangaroa Community is 67 days.
- Guests book furthest in advance for stays during December (average 102 days), likely coinciding with peak travel demand or local events.
- The shortest booking windows occur for stays in July (average 34 days), indicating more last-minute travel plans during this time.
- Seasonally, Winter (94 days avg.) sees the longest lead times, while Summer (37 days avg.) has the shortest, reflecting typical travel planning cycles.
Recommendations for Hosts
- Use the overall average lead time (67 days) as a baseline for your pricing and availability strategy in Bay of Islands-Whangaroa Community.
- For December stays, consider implementing length-of-stay discounts or slightly higher rates for bookings made less than 102 days out to capitalize on advance planning.
- Target marketing efforts for the Winter season well in advance (at least 94 days) to capture early planners.
- Monitor your own booking lead times against these Bay of Islands-Whangaroa Community averages to identify opportunities for dynamic pricing adjustments.
Popular & Essential Airbnb Amenities in Bay of Islands-Whangaroa Community (2026)
Amenity Prevalence
Amenity Insights for Bay of Islands-Whangaroa Community
- Essential amenities in Bay of Islands-Whangaroa Community that guests expect include: Free parking on premises. Lacking these (this) could significantly impact bookings.
- Popular amenities like Wifi, Smoke alarm, TV are common but not universal. Offering these can provide a competitive edge.
- Warning: Wifi is not universally provided but is considered essential globally. Ensure reliable Wifi is offered.
Recommendations for Hosts
- Ensure your listing includes all essential amenities for Bay of Islands-Whangaroa Community: Free parking on premises.
- Prioritize adding missing essentials: Free parking on premises.
- Consider adding popular differentiators like Wifi or Smoke alarm to increase appeal.
- Highlight unique or less common amenities you offer (e.g., hot tub, dedicated workspace, EV charger) in your listing description and photos.
- Regularly check competitor amenities in Bay of Islands-Whangaroa Community to stay competitive.
Bay of Islands-Whangaroa Community Airbnb Guest Demographics & Profile Analysis (2026)
Guest Profile Summary for Bay of Islands-Whangaroa Community
- The typical guest profile for Airbnb in Bay of Islands-Whangaroa Community consists of a mix of domestic (50%) and international guests, with top international origins including Australia, typically belonging to the Post-2000s (Gen Z/Alpha) group (50%), primarily speaking English or German.
- Domestic travelers account for 49.7% of guests.
- Key international markets include New Zealand (49.7%) and Australia (14.7%).
- Top languages spoken are English (64.8%) followed by German (7.6%).
- A significant demographic segment is the Post-2000s (Gen Z/Alpha) group, representing 50% of guests.
Recommendations for Hosts
- Balance marketing efforts between domestic and international channels based on the guest mix.
- Tailor amenities and listing descriptions to appeal to the dominant Post-2000s (Gen Z/Alpha) demographic (e.g., highlight fast WiFi, smart home features, local guides).
- Highlight unique local experiences or amenities relevant to the primary guest profile.
- Consider seasonal promotions aligned with peak travel times for key origin markets.
Nearby Short-Term Rental Market Comparison
How does the Bay of Islands-Whangaroa Community Airbnb market stack up against its neighbors? Compare key performance metrics like average monthly revenue, ADR, and occupancy rates in surrounding areas to understand the broader regional STR landscape.
| Market | Active Properties | Monthly Revenue | Daily Rate | Avg. Occupancy |
|---|---|---|---|---|
| Hot Water Beach | 27 | $2,949 | $257.55 | 50% |
| Whananaki | 14 | $2,368 | $364.38 | 36% |
| Waiheke | 580 | $2,274 | $338.47 | 32% |
| Hahei | 104 | $2,241 | $260.25 | 39% |
| Opito Bay | 16 | $1,911 | $294.47 | 29% |
| Waitematā | 1,525 | $1,702 | $146.61 | 50% |
| Tutukaka | 44 | $1,659 | $203.24 | 36% |
| Langs Beach | 26 | $1,598 | $343.61 | 29% |
| Baylys Beach | 12 | $1,559 | $131.00 | 46% |
| Paihia | 10 | $1,509 | $185.24 | 40% |