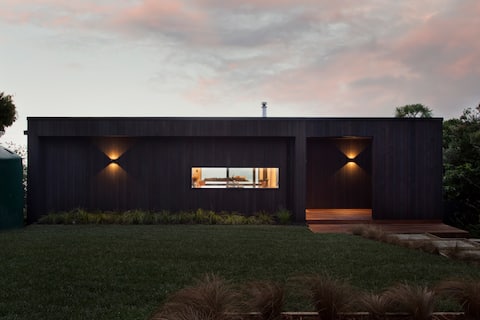
Waitākere Ranges Airbnb Market Analysis 2026: Short Term Rental Data & Vacation Rental Statistics in Auckland, New Zealand
Is Airbnb profitable in Waitākere Ranges in 2026? Explore comprehensive Airbnb analytics for Waitākere Ranges, Auckland, New Zealand to uncover income potential. This 2026 STR market report for Waitākere Ranges, based on AirROI data from February 2025 to January 2026, reveals key trends in the market of 219 active listings.
Whether you're considering an Airbnb investment in Waitākere Ranges, optimizing your existing vacation rental, or exploring rental arbitrage opportunities, understanding the Waitākere Ranges Airbnb data is crucial. Leveraging the low regulation environment is key to maximizing your short term rental income potential. Let's dive into the specifics.
Key Waitākere Ranges Airbnb Performance Metrics Overview
Monthly Airbnb Revenue Variations & Income Potential in Waitākere Ranges (2026)
Understanding the monthly revenue variations for Airbnb listings in Waitākere Ranges is key to maximizing your short term rental income potential. Seasonality significantly impacts earnings. Our analysis, based on data from the past 12 months, shows that the peak revenue month for STRs in Waitākere Ranges is typically December, while July often presents the lowest earnings, highlighting opportunities for strategic pricing adjustments during shoulder and low seasons. Explore the typical Airbnb income in Waitākere Ranges across different performance tiers:
- Best-in-class properties (Top 10%) achieve $3,856+ monthly, often utilizing dynamic pricing and superior guest experiences.
- Strong performing properties (Top 25%) earn $2,323 or more, indicating effective management and desirable locations/amenities.
- Typical properties (Median) generate around $1,222 per month, representing the average market performance.
- Entry-level properties (Bottom 25%) see earnings around $544, often with potential for optimization.
Average Monthly Airbnb Earnings Trend in Waitākere Ranges
Waitākere Ranges Airbnb Occupancy Rate Trends (2026)
Maximize your bookings by understanding the Waitākere Ranges STR occupancy trends. Seasonal demand shifts significantly influence how often properties are booked. Typically, Februarysees the highest demand (peak season occupancy), while July experiences the lowest (low season). Effective strategies, like adjusting minimum stays or offering promotions, can boost occupancy during slower periods. Here's how different property tiers perform in Waitākere Ranges:
- Best-in-class properties (Top 10%) achieve 80%+ occupancy, indicating high desirability and potentially optimized availability.
- Strong performing properties (Top 25%) maintain 62% or higher occupancy, suggesting good market fit and guest satisfaction.
- Typical properties (Median) have an occupancy rate around 37%.
- Entry-level properties (Bottom 25%) average 17% occupancy, potentially facing higher vacancy.
Average Monthly Occupancy Rate Trend in Waitākere Ranges
Average Daily Rate (ADR) Airbnb Trends in Waitākere Ranges (2026)
Effective short term rental pricing strategy in Waitākere Ranges involves understanding monthly ADR fluctuations. The Average Daily Rate (ADR) for Airbnb in Waitākere Ranges typically peaks in January and dips lowest during April. Leveraging Airbnb dynamic pricing tools or strategies based on this seasonality can significantly boost revenue. Here's a look at the typical nightly rates achieved:
- Best-in-class properties (Top 10%) command rates of $260+ per night, often due to premium features or locations.
- Strong performing properties (Top 25%) achieve nightly rates of $176 or more.
- Typical properties (Median) charge around $103 per night.
- Entry-level properties (Bottom 25%) earn around $64 per night.
Average Daily Rate (ADR) Trend by Month in Waitākere Ranges
Get Live Waitākere Ranges Market Intelligence 👇

Explore Real-time Analytics
Airbnb Seasonality Analysis & Trends in Waitākere Ranges (2026)
Peak Season (December, January, February)
- Revenue averages $2,108 per month
- Occupancy rates average 47.4%
- Daily rates average $143
Shoulder Season
- Revenue averages $1,648 per month
- Occupancy maintains around 40.7%
- Daily rates hold near $138
Low Season (May, July, August)
- Revenue drops to average $1,364 per month
- Occupancy decreases to average 33.6%
- Daily rates adjust to average $138
Seasonality Insights for Waitākere Ranges
- The Airbnb seasonality in Waitākere Ranges shows moderate seasonality with distinct peak and low periods. While the sections above show seasonal averages, it's also insightful to look at the extremes:
- During the high season, the absolute peak month showcases Waitākere Ranges's highest earning potential, with monthly revenues capable of climbing to $2,175, occupancy reaching a high of 52.3%, and ADRs peaking at $146.
- Conversely, the slowest single month of the year, typically falling within the low season, marks the market's lowest point. In this month, revenue might dip to $1,349, occupancy could drop to 33.1%, and ADRs may adjust down to $134.
- Understanding both the seasonal averages and these monthly peaks and troughs in revenue, occupancy, and ADR is crucial for maximizing your Airbnb profit potential in Waitākere Ranges.
Seasonal Strategies for Maximizing Profit
- Peak Season: Maximize revenue through premium pricing and potentially longer minimum stays. Ensure high availability.
- Low Season: Offer competitive pricing, special promotions (e.g., extended stay discounts), and flexible cancellation policies. Target off-season travelers like remote workers or budget-conscious guests.
- Shoulder Seasons: Implement dynamic pricing that balances peak and low rates. Target weekend travelers or specific events. Offer slightly more flexible terms than peak season.
- Regularly analyze your own performance against these Waitākere Ranges seasonality benchmarks and adjust your pricing and availability strategy accordingly.
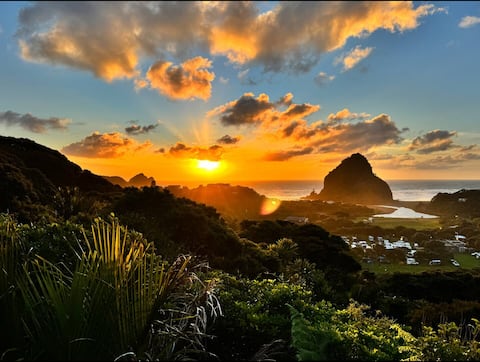
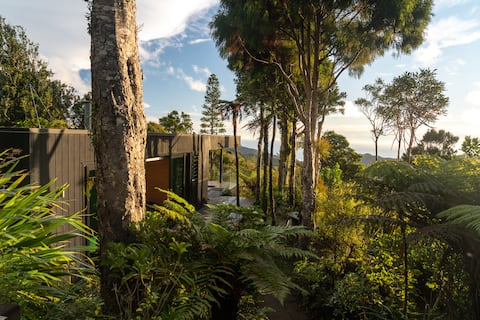
Best Areas for Airbnb Investment in Waitākere Ranges (2026)
Exploring the top neighborhoods for short-term rentals in Waitākere Ranges? This section highlights key areas, outlining why they are attractive for hosts and guests, along with notable local attractions. Consider these locations based on your target guest profile and investment strategy.
| Neighborhood / Area | Why Host Here? (Target Guests & Appeal) | Key Attractions & Landmarks |
|---|---|---|
| Piha | Famous for its stunning black sand beach and dramatic surf. Piha is a popular destination for visitors looking for a coastal retreat with scenic landscapes and outdoor activities. | Piha Beach, Lion Rock, Waitākere Ranges Regional Park, Kitekite Falls, Pararaha Valley, Piha Surf School |
| Bethells Beach | A beautiful, secluded beach popular for its natural beauty and relaxed atmosphere. Great for visitors seeking tranquility and scenic hikes. | Bethells Beach, Te Henga / Bethells Beach Walk, Lake Wainamu, Kaitarakihi Stream, Hiking Trails, Sunsets |
| Karekare | Known for its stunning landscapes and beautiful waterfalls, Karekare offers visitors a tranquil escape with both beach and hiking options. | Karekare Beach, Karekare Falls, Waitākere Ranges, Scenic Walks, Nature Photography, Hiking Trails |
| Laingholm | A quiet, bush-clad suburb offering a peaceful retreat close to nature. Ideal for guests wanting to stay away from bustling city life. | Laingholm Beach, Waitākere Ranges, Nature Walks, Local Cafes, Art Galleries, Scenic Views |
| Recommended areas such as Titirangi | Metropolitan coastal suburb known for its artistic vibe and proximity to the Waitākere Ranges. Offers great local amenities and a friendly community feel. | Tititangi Village, Art Galleries, Local Market, Bush Walks, Scenic Drives, Cafés |
| Oratia | Known for its beautiful rural landscape, Oratia offers a contrast to the urban environment of Auckland while still being close to the city. | Oratia Farmers Market, Local Wineries, Bush Walks, Scenic Parks, Nature Trails, Cafés |
| Henderson | An urban area with a variety of shopping and dining options. Henderson is a practical choice for those wanting easy access to the city and nature. | Auckland's Waitākere Golf Club, WestCity Shopping Centre, Local Parks, Henderson Massey Local Board, Cinemas |
| Woodlands Park | This suburb features a unique blend of greenery and accessibility. It's ideal for guests who want to explore the Waitākere area. | Woodlands Park Reserve, Local Gardens, Walking Trails, Nature Spots, Community Events, Scenic Areas |
Understanding Airbnb License Requirements & STR Laws in Waitākere Ranges (2026)
While Waitākere Ranges, Auckland, New Zealand currently shows low STR regulations, specific Airbnb license requirements might still exist or change. Always verify the latest short term rental regulations and Airbnb license requirements directly with local government authorities for Waitākere Ranges to ensure full compliance before hosting.
(Source: AirROI data, 2026, finding no licensed listings among those analyzed)
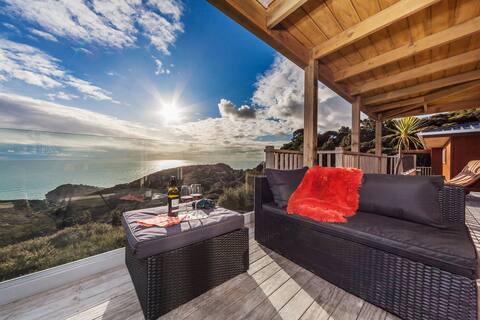
Top Performing Airbnb Properties in Waitākere Ranges (2026)
Benchmark your potential! Explore examples of top-performing Airbnb properties in Waitākere Rangesbased on Trailing Twelve Month (TTM) revenue. Analyze their characteristics, revenue, occupancy rate, and ADR to understand what drives success in this market.
Piha House with Breathtaking Views
Entire Place • 3 bedrooms
The Little Louise's: Lux-romantic & Panoramic View
Entire Place • 1 bedroom
Romantic Piha whole house
Entire Place • 3 bedrooms

Beachfront Sunset Bach
Entire Place • 3 bedrooms
Piha Retreat - Rainforest Magic
Entire Place • 2 bedrooms

Piha Retreat - FivePendrell
Entire Place • 2 bedrooms
Note: Performance varies based on location, size, amenities, seasonality, and management quality. Data reflects the past 12 months.
Top Performing Airbnb Hosts in Waitākere Ranges (2026)
Learn from the best! This table showcases top-performing Airbnb hosts in Waitākere Ranges based on the number of properties managed and estimated total revenue over the past year. Analyze their scale and performance metrics.
| Host Name | Properties | Grossing Revenue | Stay Reviews | Avg Rating |
|---|---|---|---|---|
| George | 6 | $151,336 | 899 | 4.95/5.0 |
| Kathy | 4 | $144,466 | 366 | 4.94/5.0 |
| Eva | 2 | $100,326 | 754 | 4.94/5.0 |
| Sandy | 2 | $92,566 | 157 | 4.79/5.0 |
| Suzy | 1 | $81,375 | 144 | 4.92/5.0 |
| Jenene | 1 | $72,572 | 45 | 5.00/5.0 |
| Kirsty | 1 | $63,013 | 27 | 4.93/5.0 |
| Jane | 1 | $58,027 | 281 | 4.90/5.0 |
| Sara | 1 | $54,067 | 18 | 4.61/5.0 |
| Rachael | 1 | $51,504 | 134 | 4.96/5.0 |
Analyzing the strategies of top hosts, such as their property selection, pricing, and guest communication, can offer valuable lessons for optimizing your own Airbnb operations in Waitākere Ranges.
Dive Deeper: Advanced Waitākere Ranges STR Market Data (2026)
Ready to unlock more insights? AirROI provides access to advanced metrics and comprehensive Airbnb data for Waitākere Ranges. Explore detailed analytics beyond this report to refine your investment strategy, optimize pricing, and maximize your vacation rental profits.
Explore Advanced MetricsWaitākere Ranges Short-Term Rental Market Composition (2026): Property & Room Types
Room Type Distribution
Property Type Distribution
Market Composition Insights for Waitākere Ranges
- The Waitākere Ranges Airbnb market composition is heavily skewed towards Entire Home/Apt listings, which make up 74.4% of the 219 active rentals. This indicates strong guest preference for privacy and space.
- Looking at the property type distribution in Waitākere Ranges, House properties are the most common (63.9%), reflecting the local real estate landscape.
- Houses represent a significant 63.9% portion, catering likely to families or larger groups.
- The presence of 11.9% Hotel/Boutique listings indicates integration with traditional hospitality.
- Smaller segments like unique stays (combined 1.8%) offer potential for unique stay experiences.
Waitākere Ranges Airbnb Room Capacity Analysis (2026): Bedroom Distribution
Distribution of Listings by Number of Bedrooms
Room Capacity Insights for Waitākere Ranges
- The dominant room capacity in Waitākere Ranges is 1 bedroom listings, making up 35.6% of the market. This suggests a strong demand for properties suitable for couples or solo travelers.
- Together, 1 bedroom and 2 bedrooms properties represent 61.2% of the active Airbnb listings in Waitākere Ranges, indicating a high concentration in these sizes.
Waitākere Ranges Vacation Rental Guest Capacity Trends (2026)
Distribution of Listings by Guest Capacity
Guest Capacity Insights for Waitākere Ranges
- The most common guest capacity trend in Waitākere Ranges vacation rentals is listings accommodating 2 guests (30.1%). This suggests the primary traveler segment is likely couples or solo travelers.
- Properties designed for 2 guests and 4 guests dominate the Waitākere Ranges STR market, accounting for 51.1% of listings.
- 16.4% of properties accommodate 6+ guests, serving the market segment for larger families or group travel in Waitākere Ranges.
- On average, properties in Waitākere Ranges are equipped to host 3.0 guests.
Waitākere Ranges Airbnb Booking Patterns (2026): Available vs. Booked Days
Available Days Distribution
Booked Days Distribution
Booking Pattern Insights for Waitākere Ranges
- The most common availability pattern in Waitākere Ranges falls within the 271-366 days range, representing 53.9% of listings. This suggests many properties have significant open periods on their calendars.
- Approximately 79.9% of listings show high availability (181+ days open annually), indicating potential for increased bookings or specific owner usage patterns.
- For booked days, the 1-30 days range is most frequent in Waitākere Ranges (26.9%), reflecting common guest stay durations or potential owner blocking patterns.
- A notable 21.0% of properties secure long booking periods (181+ days booked per year), highlighting successful long-term rental strategies or significant owner usage.
Waitākere Ranges Airbnb Minimum Stay Requirements Analysis
Distribution of Listings by Minimum Night Requirement
1 Night
58 listings
26.6% of total
2 Nights
89 listings
40.8% of total
3 Nights
7 listings
3.2% of total
4-6 Nights
4 listings
1.8% of total
7-29 Nights
4 listings
1.8% of total
30+ Nights
56 listings
25.7% of total
Key Insights
- The most prevalent minimum stay requirement in Waitākere Ranges is 2 Nights, adopted by 40.8% of listings. This highlights the market's preference for shorter, flexible bookings.
- A strong majority (67.4%) of the Waitākere Ranges Airbnb data shows acceptance of very short stays (1-2 nights), indicating a dynamic, high-turnover market.
- A significant segment (25.7%) caters to monthly stays (30+ nights) in Waitākere Ranges, pointing to opportunities in the extended-stay market.
Recommendations
- Align with the market by considering a 2 Nights minimum stay, as 40.8% of Waitākere Ranges hosts use this setting.
- If feasible, allowing 1-night stays, especially midweek or during low season, could capture last-minute bookings, as only 26.6% currently do.
- Explore offering discounts for stays of 30+ nights to attract the 25.7% of the market seeking extended stays.
- Adjust minimum nights based on seasonality – potentially shorter during low season and longer during peak demand periods in Waitākere Ranges.
Waitākere Ranges Airbnb Cancellation Policy Trends Analysis (2026)
Limited
4 listings
1.8% of total
Super Strict 60 Days
1 listings
0.5% of total
Flexible
57 listings
26% of total
Moderate
77 listings
35.2% of total
Firm
64 listings
29.2% of total
Strict
16 listings
7.3% of total
Cancellation Policy Insights for Waitākere Ranges
- The prevailing Airbnb cancellation policy trend in Waitākere Ranges is Moderate, used by 35.2% of listings.
- There's a relatively balanced mix between guest-friendly (61.2%) and stricter (36.5%) policies, offering choices for different guest needs.
- Strict cancellation policies are quite rare (7.3%), potentially making listings with this policy less competitive unless justified by high demand or property type.
Recommendations for Hosts
- Consider adopting a Moderate policy to align with the 35.2% market standard in Waitākere Ranges.
- Using a Strict policy might deter some guests, as only 7.3% of listings use it. Evaluate if potential revenue protection outweighs possible lower booking rates.
- Regularly review your cancellation policy against competitors and market demand shifts in Waitākere Ranges.
Waitākere Ranges STR Booking Lead Time Analysis (2026)
Average Booking Lead Time by Month
Booking Lead Time Insights for Waitākere Ranges
- The overall average booking lead time for vacation rentals in Waitākere Ranges is 40 days.
- Guests book furthest in advance for stays during January (average 67 days), likely coinciding with peak travel demand or local events.
- The shortest booking windows occur for stays in May (average 24 days), indicating more last-minute travel plans during this time.
- Seasonally, Winter (61 days avg.) sees the longest lead times, while Summer (28 days avg.) has the shortest, reflecting typical travel planning cycles.
Recommendations for Hosts
- Use the overall average lead time (40 days) as a baseline for your pricing and availability strategy in Wait�ākere Ranges.
- For January stays, consider implementing length-of-stay discounts or slightly higher rates for bookings made less than 67 days out to capitalize on advance planning.
- Target marketing efforts for the Winter season well in advance (at least 61 days) to capture early planners.
- Monitor your own booking lead times against these Waitākere Ranges averages to identify opportunities for dynamic pricing adjustments.
Popular & Essential Airbnb Amenities in Waitākere Ranges (2026)
Amenity Prevalence
Amenity Insights for Waitākere Ranges
- Essential amenities in Waitākere Ranges that guests expect include: Smoke alarm. Lacking these (this) could significantly impact bookings.
- Popular amenities like Wifi, Hot water, Free parking on premises are common but not universal. Offering these can provide a competitive edge.
- Warning: Wifi is not universally provided but is considered essential globally. Ensure reliable Wifi is offered.
Recommendations for Hosts
- Ensure your listing includes all essential amenities for Waitākere Ranges: Smoke alarm.
- Prioritize adding missing essentials: Smoke alarm.
- Consider adding popular differentiators like Wifi or Hot water to increase appeal.
- Highlight unique or less common amenities you offer (e.g., hot tub, dedicated workspace, EV charger) in your listing description and photos.
- Regularly check competitor amenities in Waitākere Ranges to stay competitive.
Waitākere Ranges Airbnb Guest Demographics & Profile Analysis (2026)
Guest Profile Summary for Waitākere Ranges
- The typical guest profile for Airbnb in Waitākere Ranges consists of a mix of domestic (47%) and international guests, with top international origins including United States, typically belonging to the Post-2000s (Gen Z/Alpha) group (50%), primarily speaking English or French.
- Domestic travelers account for 46.5% of guests.
- Key international markets include New Zealand (46.5%) and United States (19.2%).
- Top languages spoken are English (60%) followed by French (8.1%).
- A significant demographic segment is the Post-2000s (Gen Z/Alpha) group, representing 50% of guests.
Recommendations for Hosts
- Balance marketing efforts between domestic and international channels based on the guest mix.
- Tailor amenities and listing descriptions to appeal to the dominant Post-2000s (Gen Z/Alpha) demographic (e.g., highlight fast WiFi, smart home features, local guides).
- Highlight unique local experiences or amenities relevant to the primary guest profile.
- Consider seasonal promotions aligned with peak travel times for key origin markets.
Nearby Short-Term Rental Market Comparison
How does the Waitākere Ranges Airbnb market stack up against its neighbors? Compare key performance metrics like average monthly revenue, ADR, and occupancy rates in surrounding areas to understand the broader regional STR landscape.
| Market | Active Properties | Monthly Revenue | Daily Rate | Avg. Occupancy |
|---|---|---|---|---|
| Hot Water Beach | 27 | $2,949 | $257.55 | 50% |
| Whananaki | 14 | $2,368 | $364.38 | 36% |
| Waiheke | 580 | $2,274 | $338.47 | 32% |
| Hahei | 104 | $2,241 | $260.25 | 39% |
| Opito Bay | 16 | $1,911 | $294.47 | 29% |
| Karapiro | 40 | $1,865 | $206.22 | 37% |
| Waitematā | 1,525 | $1,702 | $146.61 | 50% |
| Rukuhia | 10 | $1,675 | $216.31 | 33% |
| Tamahere | 76 | $1,665 | $198.77 | 39% |
| Tutukaka | 44 | $1,659 | $203.24 | 36% |