Boca del Río Airbnb Market Analysis 2026: Short Term Rental Data & Vacation Rental Statistics in Veracruz, Mexico
Is Airbnb profitable in Boca del Río in 2026? Explore comprehensive Airbnb analytics for Boca del Río, Veracruz, Mexico to uncover income potential. This 2026 STR market report for Boca del Río, based on AirROI data from February 2025 to January 2026, reveals key trends in the market of 624 active listings.
Whether you're considering an Airbnb investment in Boca del Río, optimizing your existing vacation rental, or exploring rental arbitrage opportunities, understanding the Boca del Río Airbnb data is crucial. Leveraging the low regulation environment is key to maximizing your short term rental income potential. Let's dive into the specifics.
Key Boca del Río Airbnb Performance Metrics Overview
Monthly Airbnb Revenue Variations & Income Potential in Boca del Río (2026)
Understanding the monthly revenue variations for Airbnb listings in Boca del Río is key to maximizing your short term rental income potential. Seasonality significantly impacts earnings. Our analysis, based on data from the past 12 months, shows that the peak revenue month for STRs in Boca del Río is typically December, while February often presents the lowest earnings, highlighting opportunities for strategic pricing adjustments during shoulder and low seasons. Explore the typical Airbnb income in Boca del Río across different performance tiers:
- Best-in-class properties (Top 10%) achieve $1,936+ monthly, often utilizing dynamic pricing and superior guest experiences.
- Strong performing properties (Top 25%) earn $1,305 or more, indicating effective management and desirable locations/amenities.
- Typical properties (Median) generate around $728 per month, representing the average market performance.
- Entry-level properties (Bottom 25%) see earnings around $345, often with potential for optimization.
Average Monthly Airbnb Earnings Trend in Boca del Río
Boca del Río Airbnb Occupancy Rate Trends (2026)
Maximize your bookings by understanding the Boca del Río STR occupancy trends. Seasonal demand shifts significantly influence how often properties are booked. Typically, Augustsees the highest demand (peak season occupancy), while January experiences the lowest (low season). Effective strategies, like adjusting minimum stays or offering promotions, can boost occupancy during slower periods. Here's how different property tiers perform in Boca del Río:
- Best-in-class properties (Top 10%) achieve 68%+ occupancy, indicating high desirability and potentially optimized availability.
- Strong performing properties (Top 25%) maintain 51% or higher occupancy, suggesting good market fit and guest satisfaction.
- Typical properties (Median) have an occupancy rate around 33%.
- Entry-level properties (Bottom 25%) average 16% occupancy, potentially facing higher vacancy.
Average Monthly Occupancy Rate Trend in Boca del Río
Average Daily Rate (ADR) Airbnb Trends in Boca del Río (2026)
Effective short term rental pricing strategy in Boca del Río involves understanding monthly ADR fluctuations. The Average Daily Rate (ADR) for Airbnb in Boca del Río typically peaks in December and dips lowest during March. Leveraging Airbnb dynamic pricing tools or strategies based on this seasonality can significantly boost revenue. Here's a look at the typical nightly rates achieved:
- Best-in-class properties (Top 10%) command rates of $149+ per night, often due to premium features or locations.
- Strong performing properties (Top 25%) achieve nightly rates of $106 or more.
- Typical properties (Median) charge around $75 per night.
- Entry-level properties (Bottom 25%) earn around $49 per night.
Average Daily Rate (ADR) Trend by Month in Boca del Río
Get Live Boca del Río Market Intelligence 👇

Explore Real-time Analytics
Airbnb Seasonality Analysis & Trends in Boca del Río (2026)
Peak Season (December, July, August)
- Revenue averages $1,257 per month
- Occupancy rates average 42.2%
- Daily rates average $95
Shoulder Season
- Revenue averages $908 per month
- Occupancy maintains around 36.2%
- Daily rates hold near $86
Low Season (January, February, November)
- Revenue drops to average $712 per month
- Occupancy decreases to average 28.2%
- Daily rates adjust to average $89
Seasonality Insights for Boca del Río
- The Airbnb seasonality in Boca del Río shows highly seasonal trends requiring careful strategy. While the sections above show seasonal averages, it's also insightful to look at the extremes:
- During the high season, the absolute peak month showcases Boca del Río's highest earning potential, with monthly revenues capable of climbing to $1,336, occupancy reaching a high of 44.3%, and ADRs peaking at $109.
- Conversely, the slowest single month of the year, typically falling within the low season, marks the market's lowest point. In this month, revenue might dip to $634, occupancy could drop to 24.3%, and ADRs may adjust down to $80.
- Understanding both the seasonal averages and these monthly peaks and troughs in revenue, occupancy, and ADR is crucial for maximizing your Airbnb profit potential in Boca del Río.
Seasonal Strategies for Maximizing Profit
- Peak Season: Maximize revenue through premium pricing and potentially longer minimum stays. Ensure high availability.
- Low Season: Offer competitive pricing, special promotions (e.g., extended stay discounts), and flexible cancellation policies. Target off-season travelers like remote workers or budget-conscious guests.
- Shoulder Seasons: Implement dynamic pricing that balances peak and low rates. Target weekend travelers or specific events. Offer slightly more flexible terms than peak season.
- Regularly analyze your own performance against these Boca del Río seasonality benchmarks and adjust your pricing and availability strategy accordingly.
Best Areas for Airbnb Investment in Boca del Río (2026)
Exploring the top neighborhoods for short-term rentals in Boca del Río? This section highlights key areas, outlining why they are attractive for hosts and guests, along with notable local attractions. Consider these locations based on your target guest profile and investment strategy.
| Neighborhood / Area | Why Host Here? (Target Guests & Appeal) | Key Attractions & Landmarks |
|---|---|---|
| Playa de Villa del Mar | Popular beach destination known for its beautiful sandy shores and family-friendly environment. Ideal for vacationers looking for relaxation and water activities. | Villa del Mar Beach, World Trade Center Veracruz, Aquarium of Veracruz, Salsipuedes Beach, Veracruz Marina |
| Centro Histórico | The historic center of Veracruz, full of colonial architecture, vibrant culture, and rich history. Perfect for tourists wanting to explore local heritage and attractions. | Zócalo de Veracruz, Cathedral of Veracruz, Fuerte de San Juan de Ulúa, Teatro Degollado, Plaza Principal |
| Boca del Río Beach | Another stunning beach area, Boca del Río Beach offers a lively atmosphere with plenty of restaurants and bars. Great for tourists who enjoy dining and nightlife by the sea. | Boca del Río Beach, La Antigua River, Café de la Parroquia, Shopping centers nearby, Water sports activities |
| Las Acacias | A peaceful residential area close to both the beach and the city center, suitable for families and longer stays. Offers local dining and amenities. | Plaza Las Acacias, local parks, grocery stores, nearby markets, riverside promenades |
| Cerro Gordo | Known for its panoramic views and upscale homes, it's a great place for travelers looking for tranquility away from the busier tourist spots. | Cerro Gordo Viewpoint, Nature trails, local wildlife, picnic areas, hiking paths |
| Jardines de Virginia | A family-friendly neighborhood with parks and modern amenities, making it suitable for longer stays and local experiences. | Local parks, Family restaurants, Shopping areas, Community events, nearby schools |
| Nautilus | Upscale living with easy access to the beach and dining. Popular among tourists looking for luxury and comfort during their stay. | Luxury hotels, Fine dining restaurants, Beach clubs, Water sports rental, Veracruz Aquarium |
| Lomas del Río | A residential area known for its quiet atmosphere, great for guests wanting a local experience while still being close to major attractions. | Local cafes, Parks, Cultural centers, Family-friendly environment, Shops and services |
Understanding Airbnb License Requirements & STR Laws in Boca del Río (2026)
While Boca del Río, Veracruz, Mexico currently shows low STR regulations, specific Airbnb license requirements might still exist or change. Always verify the latest short term rental regulations and Airbnb license requirements directly with local government authorities for Boca del Río to ensure full compliance before hosting.
(Source: AirROI data, 2026, based on 0% licensed listings)
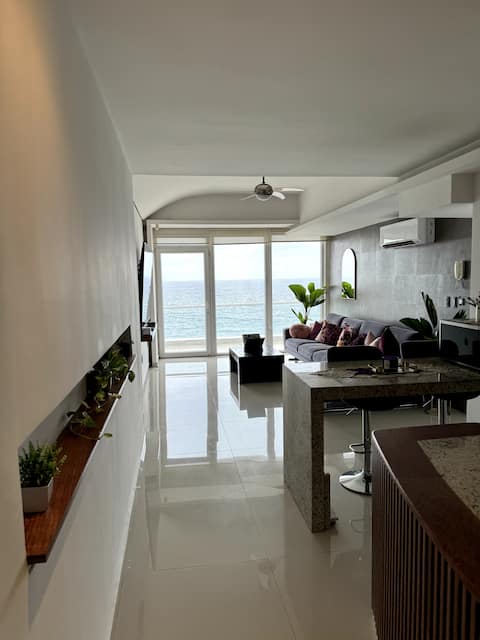
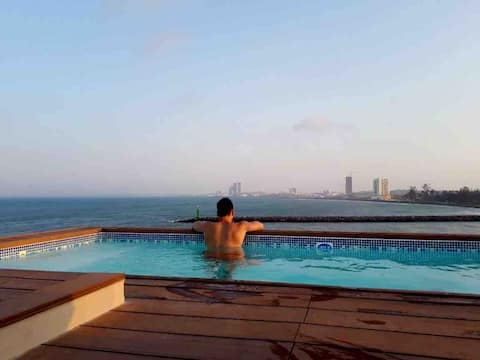
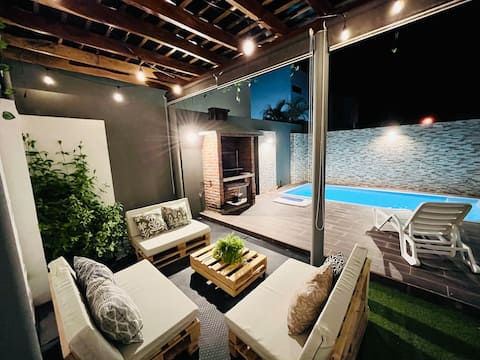
Top Performing Airbnb Properties in Boca del Río (2026)
Benchmark your potential! Explore examples of top-performing Airbnb properties in Boca del Ríobased on Trailing Twelve Month (TTM) revenue. Analyze their characteristics, revenue, occupancy rate, and ADR to understand what drives success in this market.
Zen House / Jade&Amatista / Vista al mar / 18p max
Entire Place • 6 bedrooms

House for families – pool and space for 22+
Entire Place • 4 bedrooms

El Descanso D'LUX (25 people)
Entire Place • 5 bedrooms

El Descanso Marella
Entire Place • 3 bedrooms
PH with ocean view. Exclusive use pool.
Entire Place • 4 bedrooms
Beach house with pool and exclusive beach 18 people
Entire Place • 3 bedrooms
Note: Performance varies based on location, size, amenities, seasonality, and management quality. Data reflects the past 12 months.
Top Performing Airbnb Hosts in Boca del Río (2026)
Learn from the best! This table showcases top-performing Airbnb hosts in Boca del Río based on the number of properties managed and estimated total revenue over the past year. Analyze their scale and performance metrics.
| Host Name | Properties | Grossing Revenue | Stay Reviews | Avg Rating |
|---|---|---|---|---|
| Trastevere Inmobiliaria | 12 | $155,710 | 1892 | 4.77/5.0 |
| Inmobiliaria Y Constructora Al | 20 | $133,495 | 292 | 4.67/5.0 |
| Dogar Capitales | 9 | $109,245 | 534 | 4.73/5.0 |
| Alejandro | 3 | $108,332 | 154 | 5.00/5.0 |
| Zen House | 2 | $102,123 | 53 | 4.99/5.0 |
| Jorge Torres | 5 | $96,838 | 420 | 4.58/5.0 |
| Gerardo | 2 | $93,148 | 41 | 4.95/5.0 |
| Vecino Appartamenti | 5 | $85,667 | 208 | 4.65/5.0 |
| Alfonso | 4 | $76,543 | 980 | 4.82/5.0 |
| Michelle | 2 | $62,666 | 260 | 4.81/5.0 |
Analyzing the strategies of top hosts, such as their property selection, pricing, and guest communication, can offer valuable lessons for optimizing your own Airbnb operations in Boca del Río.
Dive Deeper: Advanced Boca del Río STR Market Data (2026)
Ready to unlock more insights? AirROI provides access to advanced metrics and comprehensive Airbnb data for Boca del Río. Explore detailed analytics beyond this report to refine your investment strategy, optimize pricing, and maximize your vacation rental profits.
Explore Advanced MetricsBoca del Río Short-Term Rental Market Composition (2026): Property & Room Types
Room Type Distribution
Property Type Distribution
Market Composition Insights for Boca del Río
- The Boca del Río Airbnb market composition is heavily skewed towards Entire Home/Apt listings, which make up 87.8% of the 624 active rentals. This indicates strong guest preference for privacy and space.
- Looking at the property type distribution in Boca del Río, Apartment/Condo properties are the most common (69.6%), reflecting the local real estate landscape.
- Houses represent a significant 23.7% portion, catering likely to families or larger groups.
- Smaller segments like hotel/boutique, others, outdoor/unique (combined 6.8%) offer potential for unique stay experiences.
Boca del Río Airbnb Room Capacity Analysis (2026): Bedroom Distribution
Distribution of Listings by Number of Bedrooms
Room Capacity Insights for Boca del Río
- The dominant room capacity in Boca del Río is 2 bedrooms listings, making up 42% of the market. This suggests a strong demand for properties suitable for couples or solo travelers.
- Together, 2 bedrooms and 3 bedrooms properties represent 70.2% of the active Airbnb listings in Boca del Río, indicating a high concentration in these sizes.
- A significant 33.2% of listings offer 3+ bedrooms, catering to larger groups and families seeking more space in Boca del Río.
Boca del Río Vacation Rental Guest Capacity Trends (2026)
Distribution of Listings by Guest Capacity
Guest Capacity Insights for Boca del Río
- The most common guest capacity trend in Boca del Río vacation rentals is listings accommodating 6 guests (28%). This suggests the primary traveler segment is likely larger groups.
- Properties designed for 6 guests and 4 guests dominate the Boca del Río STR market, accounting for 47.9% of listings.
- 50.9% of properties accommodate 6+ guests, serving the market segment for larger families or group travel in Boca del Río.
- On average, properties in Boca del Río are equipped to host 5.0 guests.
Boca del Río Airbnb Booking Patterns (2026): Available vs. Booked Days
Available Days Distribution
Booked Days Distribution
Booking Pattern Insights for Boca del Río
- The most common availability pattern in Boca del Río falls within the 271-366 days range, representing 50.8% of listings. This suggests many properties have significant open periods on their calendars.
- Approximately 87.5% of listings show high availability (181+ days open annually), indicating potential for increased bookings or specific owner usage patterns.
- For booked days, the 91-180 days range is most frequent in Boca del Río (38.3%), reflecting common guest stay durations or potential owner blocking patterns.
- A notable 13.6% of properties secure long booking periods (181+ days booked per year), highlighting successful long-term rental strategies or significant owner usage.
Boca del Río Airbnb Minimum Stay Requirements Analysis
Distribution of Listings by Minimum Night Requirement
1 Night
301 listings
48.2% of total
2 Nights
181 listings
29% of total
3 Nights
9 listings
1.4% of total
4-6 Nights
5 listings
0.8% of total
7-29 Nights
2 listings
0.3% of total
30+ Nights
126 listings
20.2% of total
Key Insights
- The most prevalent minimum stay requirement in Boca del Río is 1 Night, adopted by 48.2% of listings. This highlights the market's preference for shorter, flexible bookings.
- A strong majority (77.2%) of the Boca del Río Airbnb data shows acceptance of very short stays (1-2 nights), indicating a dynamic, high-turnover market.
- A significant segment (20.2%) caters to monthly stays (30+ nights) in Boca del Río, pointing to opportunities in the extended-stay market.
Recommendations
- Align with the market by considering a 1 Night minimum stay, as 48.2% of Boca del Río hosts use this setting.
- Explore offering discounts for stays of 30+ nights to attract the 20.2% of the market seeking extended stays.
- Adjust minimum nights based on seasonality – potentially shorter during low season and longer during peak demand periods in Boca del Río.
Boca del Río Airbnb Cancellation Policy Trends Analysis (2026)
Limited
9 listings
1.4% of total
Super Strict 30 Days
12 listings
1.9% of total
Flexible
252 listings
40.4% of total
Moderate
199 listings
31.9% of total
Firm
118 listings
18.9% of total
Strict
33 listings
5.3% of total
Cancellation Policy Insights for Boca del Río
- The prevailing Airbnb cancellation policy trend in Boca del Río is Flexible, used by 40.4% of listings.
- The market strongly favors guest-friendly terms, with 72.3% of listings offering Flexible or Moderate policies. This suggests guests in Boca del Río may expect booking flexibility.
- Strict cancellation policies are quite rare (5.3%), potentially making listings with this policy less competitive unless justified by high demand or property type.
Recommendations for Hosts
- Consider adopting a Flexible policy to align with the 40.4% market standard in Boca del Río.
- Using a Strict policy might deter some guests, as only 5.3% of listings use it. Evaluate if potential revenue protection outweighs possible lower booking rates.
- Regularly review your cancellation policy against competitors and market demand shifts in Boca del Río.
Boca del Río STR Booking Lead Time Analysis (2026)
Average Booking Lead Time by Month
Booking Lead Time Insights for Boca del Río
- The overall average booking lead time for vacation rentals in Boca del Río is 24 days.
- Guests book furthest in advance for stays during August (average 43 days), likely coinciding with peak travel demand or local events.
- The shortest booking windows occur for stays in February (average 11 days), indicating more last-minute travel plans during this time.
- Seasonally, Summer (29 days avg.) sees the longest lead times, while Spring (17 days avg.) has the shortest, reflecting typical travel planning cycles.
Recommendations for Hosts
- Use the overall average lead time (24 days) as a baseline for your pricing and availability strategy in Boca del Río.
- For August stays, consider implementing length-of-stay discounts or slightly higher rates for bookings made less than 43 days out to capitalize on advance planning.
- During February, focus on last-minute booking availability and promotions, as guests book with very short notice (11 days avg.).
- Target marketing efforts for the Summer season well in advance (at least 29 days) to capture early planners.
- Monitor your own booking lead times against these Boca del Río averages to identify opportunities for dynamic pricing adjustments.
Popular & Essential Airbnb Amenities in Boca del Río (2026)
Amenity Prevalence
Amenity Insights for Boca del Río
- Essential amenities in Boca del Río that guests expect include: Wifi, Air conditioning, TV. Lacking these (any) could significantly impact bookings.
- Popular amenities like Hot water, Kitchen, Dishes and silverware are common but not universal. Offering these can provide a competitive edge.
Recommendations for Hosts
- Ensure your listing includes all essential amenities for Boca del Río: Wifi, Air conditioning, TV.
- Prioritize adding missing essentials: Wifi, Air conditioning, TV.
- Consider adding popular differentiators like Hot water or Kitchen to increase appeal.
- Highlight unique or less common amenities you offer (e.g., hot tub, dedicated workspace, EV charger) in your listing description and photos.
- Regularly check competitor amenities in Boca del Río to stay competitive.
Boca del Río Airbnb Guest Demographics & Profile Analysis (2026)
Guest Profile Summary for Boca del Río
- The typical guest profile for Airbnb in Boca del Río consists of primarily domestic travelers (93%), often arriving from nearby Mexico City, typically belonging to the Post-2000s (Gen Z/Alpha) group (50%), primarily speaking Spanish or English.
- Domestic travelers account for 92.6% of guests.
- Key international markets include Mexico (92.6%) and United States (4.4%).
- Top languages spoken are Spanish (59%) followed by English (32.4%).
- A significant demographic segment is the Post-2000s (Gen Z/Alpha) group, representing 50% of guests.
Recommendations for Hosts
- Target domestic marketing efforts towards travelers from Mexico City and Xalapa.
- Tailor amenities and listing descriptions to appeal to the dominant Post-2000s (Gen Z/Alpha) demographic (e.g., highlight fast WiFi, smart home features, local guides).
- Highlight unique local experiences or amenities relevant to the primary guest profile.
- Consider seasonal promotions aligned with peak travel times for key origin markets.
Nearby Short-Term Rental Market Comparison
How does the Boca del Río Airbnb market stack up against its neighbors? Compare key performance metrics like average monthly revenue, ADR, and occupancy rates in surrounding areas to understand the broader regional STR landscape.
| Market | Active Properties | Monthly Revenue | Daily Rate | Avg. Occupancy |
|---|---|---|---|---|
| La Guadalupe | 19 | $1,791 | $216.30 | 31% |
| Costa Esmeralda | 18 | $1,183 | $182.50 | 26% |
| Monte Gordo | 29 | $1,065 | $166.24 | 24% |
| Playa de Chachalacas | 70 | $1,064 | $158.49 | 26% |
| Jalcomulco | 26 | $793 | $110.40 | 24% |
| Mandinga y Matoza | 52 | $757 | $113.41 | 29% |
| Veracruz | 283 | $735 | $93.45 | 33% |
| Tecolutla | 110 | $709 | $112.07 | 23% |
| Casitas | 30 | $700 | $186.29 | 18% |
| Playas del Conchal | 24 | $640 | $100.15 | 28% |