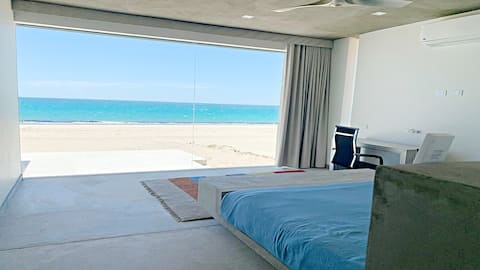
Puerto Peñasco Airbnb Market Analysis 2025: Short Term Rental Data & Vacation Rental Statistics in Sonora, Mexico
Is Airbnb profitable in Puerto Peñasco in 2025? Explore comprehensive Airbnb analytics for Puerto Peñasco, Sonora, Mexico to uncover income potential. This 2025 STR market report for Puerto Peñasco, based on AirROI data from November 2024 to October 2025, reveals key trends in the niche market of 96 active listings.
Whether you're considering an Airbnb investment in Puerto Peñasco, optimizing your existing vacation rental, or exploring rental arbitrage opportunities, understanding the Puerto Peñasco Airbnb data is crucial. Leveraging the low regulation environment is key to maximizing your short term rental income potential. Let's dive into the specifics.
Key Puerto Peñasco Airbnb Performance Metrics Overview
Monthly Airbnb Revenue Variations & Income Potential in Puerto Peñasco (2025)
Understanding the monthly revenue variations for Airbnb listings in Puerto Peñasco is key to maximizing your short term rental income potential. Seasonality significantly impacts earnings. Our analysis, based on data from the past 12 months, shows that the peak revenue month for STRs in Puerto Peñasco is typically June, while January often presents the lowest earnings, highlighting opportunities for strategic pricing adjustments during shoulder and low seasons. Explore the typical Airbnb income in Puerto Peñasco across different performance tiers:
- Best-in-class properties (Top 10%) achieve $5,042+ monthly, often utilizing dynamic pricing and superior guest experiences.
- Strong performing properties (Top 25%) earn $3,259 or more, indicating effective management and desirable locations/amenities.
- Typical properties (Median) generate around $1,747 per month, representing the average market performance.
- Entry-level properties (Bottom 25%) see earnings around $923, often with potential for optimization.
Average Monthly Airbnb Earnings Trend in Puerto Peñasco
Puerto Peñasco Airbnb Occupancy Rate Trends (2025)
Maximize your bookings by understanding the Puerto Peñasco STR occupancy trends. Seasonal demand shifts significantly influence how often properties are booked. Typically, Junesees the highest demand (peak season occupancy), while January experiences the lowest (low season). Effective strategies, like adjusting minimum stays or offering promotions, can boost occupancy during slower periods. Here's how different property tiers perform in Puerto Peñasco:
- Best-in-class properties (Top 10%) achieve 58%+ occupancy, indicating high desirability and potentially optimized availability.
- Strong performing properties (Top 25%) maintain 39% or higher occupancy, suggesting good market fit and guest satisfaction.
- Typical properties (Median) have an occupancy rate around 23%.
- Entry-level properties (Bottom 25%) average 13% occupancy, potentially facing higher vacancy.
Average Monthly Occupancy Rate Trend in Puerto Peñasco
Average Daily Rate (ADR) Airbnb Trends in Puerto Peñasco (2025)
Effective short term rental pricing strategy in Puerto Peñasco involves understanding monthly ADR fluctuations. The Average Daily Rate (ADR) for Airbnb in Puerto Peñasco typically peaks in May and dips lowest during August. Leveraging Airbnb dynamic pricing tools or strategies based on this seasonality can significantly boost revenue. Here's a look at the typical nightly rates achieved:
- Best-in-class properties (Top 10%) command rates of $551+ per night, often due to premium features or locations.
- Strong performing properties (Top 25%) achieve nightly rates of $376 or more.
- Typical properties (Median) charge around $260 per night.
- Entry-level properties (Bottom 25%) earn around $192 per night.
Average Daily Rate (ADR) Trend by Month in Puerto Peñasco
Get Live Puerto Peñasco Market Intelligence 👇

Explore Real-time Analytics
Airbnb Seasonality Analysis & Trends in Puerto Peñasco (2025)
Peak Season (June, May, March)
- Revenue averages $3,269 per month
- Occupancy rates average 34.3%
- Daily rates average $345
Shoulder Season
- Revenue averages $2,327 per month
- Occupancy maintains around 28.5%
- Daily rates hold near $302
Low Season (January, February, September)
- Revenue drops to average $1,786 per month
- Occupancy decreases to average 22.2%
- Daily rates adjust to average $303
Seasonality Insights for Puerto Peñasco
- The Airbnb seasonality in Puerto Peñasco shows highly seasonal trends requiring careful strategy. While the sections above show seasonal averages, it's also insightful to look at the extremes:
- During the high season, the absolute peak month showcases Puerto Peñasco's highest earning potential, with monthly revenues capable of climbing to $3,623, occupancy reaching a high of 37.0%, and ADRs peaking at $352.
- Conversely, the slowest single month of the year, typically falling within the low season, marks the market's lowest point. In this month, revenue might dip to $1,608, occupancy could drop to 17.2%, and ADRs may adjust down to $258.
- Understanding both the seasonal averages and these monthly peaks and troughs in revenue, occupancy, and ADR is crucial for maximizing your Airbnb profit potential in Puerto Peñasco.
Seasonal Strategies for Maximizing Profit
- Peak Season: Maximize revenue through premium pricing and potentially longer minimum stays. Ensure high availability.
- Low Season: Offer competitive pricing, special promotions (e.g., extended stay discounts), and flexible cancellation policies. Target off-season travelers like remote workers or budget-conscious guests.
- Shoulder Seasons: Implement dynamic pricing that balances peak and low rates. Target weekend travelers or specific events. Offer slightly more flexible terms than peak season.
- Regularly analyze your own performance against these Puerto Peñasco seasonality benchmarks and adjust your pricing and availability strategy accordingly.
Best Areas for Airbnb Investment in Puerto Peñasco (2025)
Exploring the top neighborhoods for short-term rentals in Puerto Peñasco? This section highlights key areas, outlining why they are attractive for hosts and guests, along with notable local attractions. Consider these locations based on your target guest profile and investment strategy.
| Neighborhood / Area | Why Host Here? (Target Guests & Appeal) | Key Attractions & Landmarks |
|---|---|---|
| Las Conchas | A serene beachfront community known for its beautiful sea views and quiet atmosphere. Ideal for families and vacationers looking for a relaxing getaway. | Las Conchas Beach, Rocky Point Marina, El Malecon, Cholla Bay, Cedar Street Plaza |
| Sandy Beach | A popular destination with stunning beachfront resorts and a vibrant nightlife. Great for tourists seeking a lively atmosphere and water activities. | Sandy Beach, Sonoran Sea Resort, Wrecked at the Reef, Sky Bar, Marina Fiesta |
| Puerto Peñasco Town Center | The cultural heart of Puerto Peñasco with local markets, restaurants, and shopping. Perfect for travelers wanting to experience local culture and cuisine. | Old Port, La Malecon, Fisherman's Monument, Local Markets, Restaurants and Bars |
| Cholla Bay | A charming bay area known for its scenic views and laid-back vibe. Attracts visitors interested in water sports and a more local experience. | Cholla Bay Beach, Cholla Bay Boat Ramp, Restaurants at Cholla Bay, Watch for Marine Life |
| Mirador | A residential area with a mix of local charm and tourist amenities. Close to beaches and shopping, making it convenient for vacationers. | Playa Bonita Beach, Mirador Beach, Cultural Center of Puerto Peñasco, Shopping Malls |
| La Choya | A peaceful neighborhood known for its upscale condominiums and sea views. A great choice for retirees and those looking for luxury accommodations. | La Choya Beach, Golf Courses, Luxury Resorts, Spa Services |
| Las Palomas | Home to a famous beachfront resort where many tourists flock for its luxurious amenities and beautiful scenery. Attracts both families and couples. | Las Palomas Beach & Golf Resort, Resort Pools, Spa Services, Popular with Tourists |
| Estrella del Mar | A tranquil community located away from the hustle and bustle, offering a more relaxed environment for those wanting peace and quiet. | Estrella del Mar Beach, Local Parks, Scenic Coastal Views, Community Events |
Understanding Airbnb License Requirements & STR Laws in Puerto Peñasco (2025)
While Puerto Peñasco, Sonora, Mexico currently shows low STR regulations, specific Airbnb license requirements might still exist or change. Always verify the latest short term rental regulations and Airbnb license requirements directly with local government authorities for Puerto Peñasco to ensure full compliance before hosting.
(Source: AirROI data, 2025, based on 1% licensed listings)
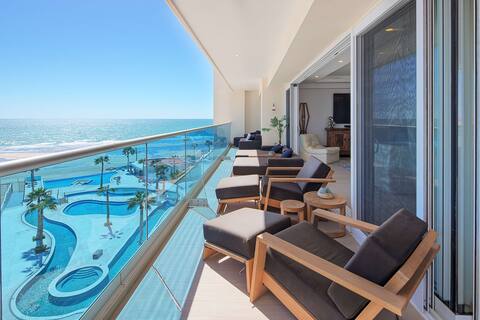
Top Performing Airbnb Properties in Puerto Peñasco (2025)
Benchmark your potential! Explore examples of top-performing Airbnb properties in Puerto Peñascobased on Trailing Twelve Month (TTM) revenue. Analyze their characteristics, revenue, occupancy rate, and ADR to understand what drives success in this market.
The Perfect Spot! House Sea Esta Villa
Entire Place • 4 bedrooms
Summer 601 at Encantame Towers
Entire Place • 3 bedrooms
Brand New Beautiful House La Brisas
Entire Place • 3 bedrooms

5 bed/5 bath total-2 adjacent condos-ocean views
Entire Place • 5 bedrooms

Luxury Encantame Towers 2 -Bedroom DLX Verano E905
Entire Place • 2 bedrooms
PLAYA VIDA Oceanfront Luxury Condo
Entire Place • 2 bedrooms
Note: Performance varies based on location, size, amenities, seasonality, and management quality. Data reflects the past 12 months.
Top Performing Airbnb Hosts in Puerto Peñasco (2025)
Learn from the best! This table showcases top-performing Airbnb hosts in Puerto Peñasco based on the number of properties managed and estimated total revenue over the past year. Analyze their scale and performance metrics.
| Host Name | Properties | Grossing Revenue | Stay Reviews | Avg Rating |
|---|---|---|---|---|
| Kivoya | 19 | $302,886 | 181 | 4.45/5.0 |
| Premium Vacations | 14 | $265,313 | 355 | 4.75/5.0 |
| Debra | 3 | $94,117 | 54 | 4.95/5.0 |
| Alan | 1 | $80,376 | 11 | 5.00/5.0 |
| Danny | 1 | $69,479 | 47 | 4.89/5.0 |
| Ross | 2 | $64,626 | 26 | 5.00/5.0 |
| Tommy Bahama | 1 | $46,760 | 19 | 5.00/5.0 |
| Tana | 1 | $41,811 | 56 | 4.95/5.0 |
| Chuck | 2 | $41,489 | 13 | 4.73/5.0 |
| Joe | 1 | $40,600 | 25 | 4.96/5.0 |
Analyzing the strategies of top hosts, such as their property selection, pricing, and guest communication, can offer valuable lessons for optimizing your own Airbnb operations in Puerto Peñasco.
Dive Deeper: Advanced Puerto Peñasco STR Market Data (2025)
Ready to unlock more insights? AirROI provides access to advanced metrics and comprehensive Airbnb data for Puerto Peñasco. Explore detailed analytics beyond this report to refine your investment strategy, optimize pricing, and maximize your vacation rental profits.
Explore Advanced MetricsPuerto Peñasco Short-Term Rental Market Composition (2025): Property & Room Types
Room Type Distribution
Property Type Distribution
Market Composition Insights for Puerto Peñasco
- The Puerto Peñasco Airbnb market composition is heavily skewed towards Entire Home/Apt listings, which make up 91.7% of the 96 active rentals. This indicates strong guest preference for privacy and space.
- Looking at the property type distribution in Puerto Peñasco, Apartment/Condo properties are the most common (56.3%), reflecting the local real estate landscape.
- Houses represent a significant 36.5% portion, catering likely to families or larger groups.
- The presence of 5.2% Hotel/Boutique listings indicates integration with traditional hospitality.
- Smaller segments like others, outdoor/unique (combined 2.0%) offer potential for unique stay experiences.
Puerto Peñasco Airbnb Room Capacity Analysis (2025): Bedroom Distribution
Distribution of Listings by Number of Bedrooms
Room Capacity Insights for Puerto Peñasco
- The dominant room capacity in Puerto Peñasco is 2 bedrooms listings, making up 33.3% of the market. This suggests a strong demand for properties suitable for couples or solo travelers.
- Together, 2 bedrooms and 3 bedrooms properties represent 57.3% of the active Airbnb listings in Puerto Peñasco, indicating a high concentration in these sizes.
- A significant 44.9% of listings offer 3+ bedrooms, catering to larger groups and families seeking more space in Puerto Peñasco.
Puerto Peñasco Vacation Rental Guest Capacity Trends (2025)
Distribution of Listings by Guest Capacity
Guest Capacity Insights for Puerto Peñasco
- The most common guest capacity trend in Puerto Peñasco vacation rentals is listings accommodating 6 guests (38.5%). This suggests the primary traveler segment is likely larger groups.
- Properties designed for 6 guests and 8+ guests dominate the Puerto Peñasco STR market, accounting for 73.9% of listings.
- 80.2% of properties accommodate 6+ guests, serving the market segment for larger families or group travel in Puerto Peñasco.
- On average, properties in Puerto Peñasco are equipped to host 6.4 guests.
Puerto Peñasco Airbnb Booking Patterns (2025): Available vs. Booked Days
Available Days Distribution
Booked Days Distribution
Booking Pattern Insights for Puerto Peñasco
- The most common availability pattern in Puerto Peñasco falls within the 271-366 days range, representing 76% of listings. This suggests many properties have significant open periods on their calendars.
- Approximately 93.7% of listings show high availability (181+ days open annually), indicating potential for increased bookings or specific owner usage patterns.
- For booked days, the 31-90 days range is most frequent in Puerto Peñasco (42.7%), reflecting common guest stay durations or potential owner blocking patterns.
- A notable 7.3% of properties secure long booking periods (181+ days booked per year), highlighting successful long-term rental strategies or significant owner usage.
Puerto Peñasco Airbnb Minimum Stay Requirements Analysis
Distribution of Listings by Minimum Night Requirement
1 Night
12 listings
12.5% of total
2 Nights
49 listings
51% of total
3 Nights
14 listings
14.6% of total
4-6 Nights
1 listings
1% of total
7-29 Nights
2 listings
2.1% of total
30+ Nights
18 listings
18.8% of total
Key Insights
- The most prevalent minimum stay requirement in Puerto Peñasco is 2 Nights, adopted by 51% of listings. This highlights the market's preference for shorter, flexible bookings.
- A strong majority (63.5%) of the Puerto Peñasco Airbnb data shows acceptance of very short stays (1-2 nights), indicating a dynamic, high-turnover market.
- A significant segment (18.8%) caters to monthly stays (30+ nights) in Puerto Peñasco, pointing to opportunities in the extended-stay market.
Recommendations
- Align with the market by considering a 2 Nights minimum stay, as 51% of Puerto Peñasco hosts use this setting.
- If feasible, allowing 1-night stays, especially midweek or during low season, could capture last-minute bookings, as only 12.5% currently do.
- A 2-night minimum appears standard (51%). Consider this for weekends or peak periods.
- Explore offering discounts for stays of 30+ nights to attract the 18.8% of the market seeking extended stays.
- Adjust minimum nights based on seasonality – potentially shorter during low season and longer during peak demand periods in Puerto Peñasco.
Puerto Peñasco Airbnb Cancellation Policy Trends Analysis (2025)
Limited
1 listings
1% of total
Super Strict 30 Days
1 listings
1% of total
Flexible
10 listings
10.4% of total
Moderate
30 listings
31.3% of total
Firm
17 listings
17.7% of total
Strict
37 listings
38.5% of total
Cancellation Policy Insights for Puerto Peñasco
- The prevailing Airbnb cancellation policy trend in Puerto Peñasco is Strict, used by 38.5% of listings.
- A majority (56.2%) of hosts in Puerto Peñasco utilize Firm or Strict policies, indicating a market where hosts prioritize booking security.
Recommendations for Hosts
- Consider adopting a Strict policy to align with the 38.5% market standard in Puerto Peñasco.
- With 38.5% using Strict terms, this is a viable option in Puerto Peñasco, particularly for high-value properties or during peak demand periods.
- Regularly review your cancellation policy against competitors and market demand shifts in Puerto Peñasco.
Puerto Peñasco STR Booking Lead Time Analysis (2025)
Average Booking Lead Time by Month
Booking Lead Time Insights for Puerto Peñasco
- The overall average booking lead time for vacation rentals in Puerto Peñasco is 45 days.
- Guests book furthest in advance for stays during December (average 114 days), likely coinciding with peak travel demand or local events.
- The shortest booking windows occur for stays in July (average 26 days), indicating more last-minute travel plans during this time.
- Seasonally, Winter (60 days avg.) sees the longest lead times, while Summer (30 days avg.) has the shortest, reflecting typical travel planning cycles.
Recommendations for Hosts
- Use the overall average lead time (45 days) as a baseline for your pricing and availability strategy in Puerto Peñasco.
- For December stays, consider implementing length-of-stay discounts or slightly higher rates for bookings made less than 114 days out to capitalize on advance planning.
- Target marketing efforts for the Winter season well in advance (at least 60 days) to capture early planners.
- Monitor your own booking lead times against these Puerto Peñasco averages to identify opportunities for dynamic pricing adjustments.
Popular & Essential Airbnb Amenities in Puerto Peñasco (2025)
Amenity Prevalence
Amenity Insights for Puerto Peñasco
- Essential amenities in Puerto Peñasco that guests expect include: Air conditioning, TV, Kitchen. Lacking these (any) could significantly impact bookings.
- Popular amenities like Wifi, Free parking on premises, Refrigerator are common but not universal. Offering these can provide a competitive edge.
- Warning: Wifi is not universally provided but is considered essential globally. Ensure reliable Wifi is offered.
Recommendations for Hosts
- Ensure your listing includes all essential amenities for Puerto Peñasco: Air conditioning, TV, Kitchen.
- Prioritize adding missing essentials: Air conditioning, TV, Kitchen.
- Consider adding popular differentiators like Wifi or Free parking on premises to increase appeal.
- Highlight unique or less common amenities you offer (e.g., hot tub, dedicated workspace, EV charger) in your listing description and photos.
- Regularly check competitor amenities in Puerto Peñasco to stay competitive.
Puerto Peñasco Airbnb Guest Demographics & Profile Analysis (2025)
Guest Profile Summary for Puerto Peñasco
- The typical guest profile for Airbnb in Puerto Peñasco consists of predominantly international visitors (89%), with top international origins including Mexico, typically belonging to the Post-2000s (Gen Z/Alpha) group (50%), primarily speaking English or Spanish.
- Domestic travelers account for 10.6% of guests.
- Key international markets include United States (89%) and Mexico (10.6%).
- Top languages spoken are English (55.1%) followed by Spanish (38.8%).
- A significant demographic segment is the Post-2000s (Gen Z/Alpha) group, representing 50% of guests.
Recommendations for Hosts
- Focus marketing internationally, particularly towards travelers from Mexico.
- Tailor amenities and listing descriptions to appeal to the dominant Post-2000s (Gen Z/Alpha) demographic (e.g., highlight fast WiFi, smart home features, local guides).
- Highlight unique local experiences or amenities relevant to the primary guest profile.
- Consider seasonal promotions aligned with peak travel times for key origin markets.
Nearby Short-Term Rental Market Comparison
How does the Puerto Peñasco Airbnb market stack up against its neighbors? Compare key performance metrics like average monthly revenue, ADR, and occupancy rates in surrounding areas to understand the broader regional STR landscape.
| Market | Active Properties | Monthly Revenue | Daily Rate | Avg. Occupancy |
|---|---|---|---|---|
| Playa Encanto | 72 | $2,379 | $303.60 | 32% |
| Las Conchas | 143 | $1,814 | $292.71 | 24% |
| Yuma | 344 | $1,556 | $144.09 | 45% |
| Rocky Point | 1,881 | $1,417 | $239.40 | 25% |
| Fortuna Foothills | 146 | $1,305 | $131.01 | 46% |
| San Luis | 16 | $1,259 | $135.56 | 39% |
| Ajo | 18 | $968 | $105.11 | 43% |
| Somerton | 13 | $949 | $118.88 | 38% |
| San Felipe | 344 | $857 | $219.21 | 21% |
| San Felípe | 22 | $847 | $331.90 | 18% |