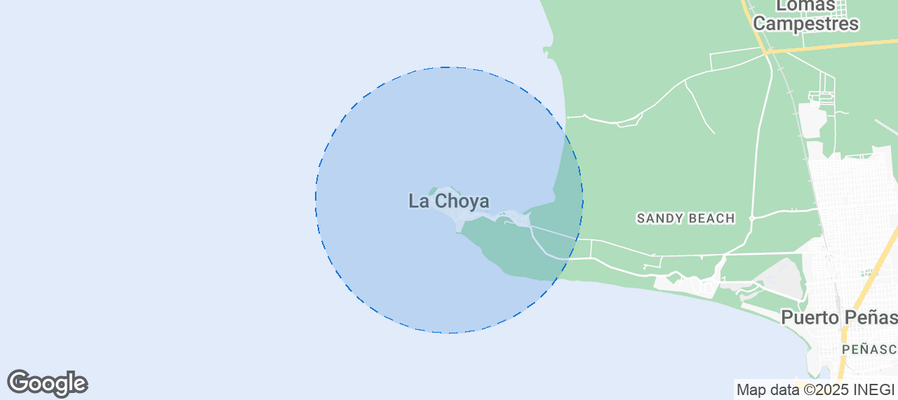
Bahía La Choya Airbnb Market Analysis 2026: Short Term Rental Data & Vacation Rental Statistics in Sonora, Mexico
Is Airbnb profitable in Bahía La Choya in 2026? Explore comprehensive Airbnb analytics for Bahía La Choya, Sonora, Mexico to uncover income potential. This 2026 STR market report for Bahía La Choya, based on AirROI data from February 2025 to January 2026, reveals key trends in the niche market of 51 active listings.
Whether you're considering an Airbnb investment in Bahía La Choya, optimizing your existing vacation rental, or exploring rental arbitrage opportunities, understanding the Bahía La Choya Airbnb data is crucial. Leveraging the low regulation environment is key to maximizing your short term rental income potential. Let's dive into the specifics.
Key Bahía La Choya Airbnb Performance Metrics Overview
Monthly Airbnb Revenue Variations & Income Potential in Bahía La Choya (2026)
Understanding the monthly revenue variations for Airbnb listings in Bahía La Choya is key to maximizing your short term rental income potential. Seasonality significantly impacts earnings. Our analysis, based on data from the past 12 months, shows that the peak revenue month for STRs in Bahía La Choya is typically June, while September often presents the lowest earnings, highlighting opportunities for strategic pricing adjustments during shoulder and low seasons. Explore the typical Airbnb income in Bahía La Choya across different performance tiers:
- Best-in-class properties (Top 10%) achieve $3,397+ monthly, often utilizing dynamic pricing and superior guest experiences.
- Strong performing properties (Top 25%) earn $1,769 or more, indicating effective management and desirable locations/amenities.
- Typical properties (Median) generate around $925 per month, representing the average market performance.
- Entry-level properties (Bottom 25%) see earnings around $516, often with potential for optimization.
Average Monthly Airbnb Earnings Trend in Bahía La Choya
Bahía La Choya Airbnb Occupancy Rate Trends (2026)
Maximize your bookings by understanding the Bahía La Choya STR occupancy trends. Seasonal demand shifts significantly influence how often properties are booked. Typically, Julysees the highest demand (peak season occupancy), while August experiences the lowest (low season). Effective strategies, like adjusting minimum stays or offering promotions, can boost occupancy during slower periods. Here's how different property tiers perform in Bahía La Choya:
- Best-in-class properties (Top 10%) achieve 58%+ occupancy, indicating high desirability and potentially optimized availability.
- Strong performing properties (Top 25%) maintain 30% or higher occupancy, suggesting good market fit and guest satisfaction.
- Typical properties (Median) have an occupancy rate around 17%.
- Entry-level properties (Bottom 25%) average 10% occupancy, potentially facing higher vacancy.
Average Monthly Occupancy Rate Trend in Bahía La Choya
Average Daily Rate (ADR) Airbnb Trends in Bahía La Choya (2026)
Effective short term rental pricing strategy in Bahía La Choya involves understanding monthly ADR fluctuations. The Average Daily Rate (ADR) for Airbnb in Bahía La Choya typically peaks in October and dips lowest during February. Leveraging Airbnb dynamic pricing tools or strategies based on this seasonality can significantly boost revenue. Here's a look at the typical nightly rates achieved:
- Best-in-class properties (Top 10%) command rates of $313+ per night, often due to premium features or locations.
- Strong performing properties (Top 25%) achieve nightly rates of $222 or more.
- Typical properties (Median) charge around $177 per night.
- Entry-level properties (Bottom 25%) earn around $138 per night.
Average Daily Rate (ADR) Trend by Month in Bahía La Choya
Get Live Bahía La Choya Market Intelligence 👇
Explore Real-time Analytics
Airbnb Seasonality Analysis & Trends in Bahía La Choya (2026)
Peak Season (June, December, May)
- Revenue averages $1,739 per month
- Occupancy rates average 26.4%
- Daily rates average $197
Shoulder Season
- Revenue averages $1,466 per month
- Occupancy maintains around 24.9%
- Daily rates hold near $192
Low Season (January, April, September)
- Revenue drops to average $1,091 per month
- Occupancy decreases to average 19.5%
- Daily rates adjust to average $193
Seasonality Insights for Bahía La Choya
- The Airbnb seasonality in Bahía La Choya shows moderate seasonality with distinct peak and low periods. While the sections above show seasonal averages, it's also insightful to look at the extremes:
- During the high season, the absolute peak month showcases Bahía La Choya's highest earning potential, with monthly revenues capable of climbing to $1,792, occupancy reaching a high of 27.8%, and ADRs peaking at $202.
- Conversely, the slowest single month of the year, typically falling within the low season, marks the market's lowest point. In this month, revenue might dip to $1,010, occupancy could drop to 16.1%, and ADRs may adjust down to $182.
- Understanding both the seasonal averages and these monthly peaks and troughs in revenue, occupancy, and ADR is crucial for maximizing your Airbnb profit potential in Bahía La Choya.
Seasonal Strategies for Maximizing Profit
- Peak Season: Maximize revenue through premium pricing and potentially longer minimum stays. Ensure high availability.
- Low Season: Offer competitive pricing, special promotions (e.g., extended stay discounts), and flexible cancellation policies. Target off-season travelers like remote workers or budget-conscious guests.
- Shoulder Seasons: Implement dynamic pricing that balances peak and low rates. Target weekend travelers or specific events. Offer slightly more flexible terms than peak season.
- Regularly analyze your own performance against these Bahía La Choya seasonality benchmarks and adjust your pricing and availability strategy accordingly.
Best Areas for Airbnb Investment in Bahía La Choya (2026)
Exploring the top neighborhoods for short-term rentals in Bahía La Choya? This section highlights key areas, outlining why they are attractive for hosts and guests, along with notable local attractions. Consider these locations based on your target guest profile and investment strategy.
| Neighborhood / Area | Why Host Here? (Target Guests & Appeal) | Key Attractions & Landmarks |
|---|---|---|
| La Choya Beach | A beautiful beach destination with stunning views and a relaxed atmosphere, perfect for vacationers looking to enjoy the sun and sea. Offers access to water sports and activities. | La Choya Beach, Water sports rental, Beachfront dining, Sunset views, Snorkeling spots |
| San Carlos | A popular area for tourists seeking outdoor activities such as fishing, boating, and hiking. Known for its picturesque landscapes and vibrant community. | San Carlos Beach, Marina San Carlos, Campamento Tortuguero, Tortuga Rojas Beach, Diving trips |
| Guaymas | A nearby city offering a blend of culture and coastal experiences, appealing to tourists interested in local history, cuisine, and scenic views of the sea. | Guaymas Malecon, Historic downtown Guaymas, Plaza de los Tres Presidentes, La Alameda Park, Seafood markets |
| Hacienda Las Fuentes | An exclusive gated community offering luxury accommodations and amenities, ideal for travelers seeking privacy and high-end experiences. | Private pool areas, Golf courses, Fine dining, Spas and wellness centers, Secluded beaches |
| Bahía de Kino | A serene beach community famous for its beautiful coastline and relaxed vibe, suitable for families and quiet getaways. | Kino Beach, Fishing trips, Ecotourism, Local seafood dining, Cultural events |
| Puerto Peñasco | A thriving tourist destination known for its vibrant nightlife and expansive beaches, attracting a diverse crowd of vacationers. | Rocky Point Beach, Las Conchas Beach, El Malecon, Water activities, Nightlife hotspots |
| Los Algodones | A small coastal town that offers a tranquil environment and proximity to beautiful beaches, perfect for those looking to escape the hustle and bustle. | Algodones Beach, Nearby hiking trails, Local artisan shops, Fishing and boating, Nature reserves |
| Cerro Prieto | An area with unique geographical features and hiking opportunities, appealing to adventure seekers and those looking to explore natural beauty. | Cerro Prieto hiking trails, Natural hot springs, Wildlife viewing, Stargazing, Scenic overlooks |
Understanding Airbnb License Requirements & STR Laws in Bahía La Choya (2026)
While Bahía La Choya, Sonora, Mexico currently shows low STR regulations, specific Airbnb license requirements might still exist or change. Always verify the latest short term rental regulations and Airbnb license requirements directly with local government authorities for Bahía La Choya to ensure full compliance before hosting.
(Source: AirROI data, 2026, finding no licensed listings among those analyzed)
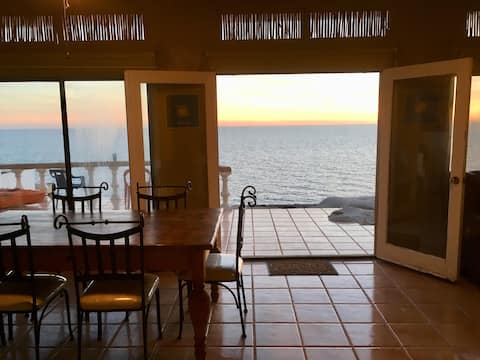
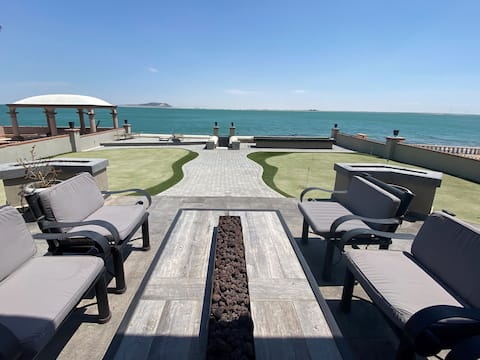
Top Performing Airbnb Properties in Bahía La Choya (2026)
Benchmark your potential! Explore examples of top-performing Airbnb properties in Bahía La Choyabased on Trailing Twelve Month (TTM) revenue. Analyze their characteristics, revenue, occupancy rate, and ADR to understand what drives success in this market.
SeaClusion Mexico
Entire Place • 3 bedrooms

Family Retreat with Salt water Bay front
Entire Place • 3 bedrooms

3-Story Home Pool & Rooftop Spa by the Sea Unit C
Entire Place • 3 bedrooms
Bliss By The Bay
Entire Place • 4 bedrooms

Vacation Getaway Steps from the Water!
Entire Place • 5 bedrooms

Beachfront House in Cholla Bay
Entire Place • 3 bedrooms
Note: Performance varies based on location, size, amenities, seasonality, and management quality. Data reflects the past 12 months.
Top Performing Airbnb Hosts in Bahía La Choya (2026)
Learn from the best! This table showcases top-performing Airbnb hosts in Bahía La Choya based on the number of properties managed and estimated total revenue over the past year. Analyze their scale and performance metrics.
| Host Name | Properties | Grossing Revenue | Stay Reviews | Avg Rating |
|---|---|---|---|---|
| Steve | 1 | $50,921 | 253 | 4.85/5.0 |
| Andrea | 1 | $47,266 | 58 | 4.98/5.0 |
| Aron | 9 | $35,372 | 67 | 4.58/5.0 |
| Tom | 1 | $29,405 | 122 | 4.84/5.0 |
| Jon | 1 | $28,534 | 26 | 4.92/5.0 |
| Alicia | 2 | $28,101 | 20 | 4.55/5.0 |
| Fmi | 3 | $27,961 | 38 | 4.72/5.0 |
| Rocky Point Beach Rentals | 2 | $26,494 | 68 | 4.96/5.0 |
| Roger | 1 | $19,786 | 108 | 4.68/5.0 |
| Cheryl | 3 | $18,673 | 112 | 4.73/5.0 |
Analyzing the strategies of top hosts, such as their property selection, pricing, and guest communication, can offer valuable lessons for optimizing your own Airbnb operations in Bahía La Choya.
Dive Deeper: Advanced Bahía La Choya STR Market Data (2026)
Ready to unlock more insights? AirROI provides access to advanced metrics and comprehensive Airbnb data for Bahía La Choya. Explore detailed analytics beyond this report to refine your investment strategy, optimize pricing, and maximize your vacation rental profits.
Explore Advanced MetricsBahía La Choya Short-Term Rental Market Composition (2026): Property & Room Types
Room Type Distribution
Property Type Distribution
Market Composition Insights for Bahía La Choya
- The Bahía La Choya Airbnb market composition is heavily skewed towards Entire Home/Apt listings, which make up 100% of the 51 active rentals. This indicates strong guest preference for privacy and space.
- Looking at the property type distribution in Bahía La Choya, House properties are the most common (66.7%), reflecting the local real estate landscape.
- Houses represent a significant 66.7% portion, catering likely to families or larger groups.
- Smaller segments like others (combined 2.0%) offer potential for unique stay experiences.
Bahía La Choya Airbnb Room Capacity Analysis (2026): Bedroom Distribution
Distribution of Listings by Number of Bedrooms
Room Capacity Insights for Bahía La Choya
- The dominant room capacity in Bahía La Choya is 2 bedrooms listings, making up 35.3% of the market. This suggests a strong demand for properties suitable for couples or solo travelers.
- Together, 2 bedrooms and 3 bedrooms properties represent 68.6% of the active Airbnb listings in Bahía La Choya, indicating a high concentration in these sizes.
- A significant 49.0% of listings offer 3+ bedrooms, catering to larger groups and families seeking more space in Bahía La Choya.
Bahía La Choya Vacation Rental Guest Capacity Trends (2026)
Distribution of Listings by Guest Capacity
Guest Capacity Insights for Bahía La Choya
- The most common guest capacity trend in Bahía La Choya vacation rentals is listings accommodating 8+ guests (49%). This suggests the primary traveler segment is likely larger groups.
- Properties designed for 8+ guests and 6 guests dominate the Bahía La Choya STR market, accounting for 74.5% of listings.
- 78.4% of properties accommodate 6+ guests, serving the market segment for larger families or group travel in Bahía La Choya.
- On average, properties in Bahía La Choya are equipped to host 6.5 guests.
Bahía La Choya Airbnb Booking Patterns (2026): Available vs. Booked Days
Available Days Distribution
Booked Days Distribution
Booking Pattern Insights for Bahía La Choya
- The most common availability pattern in Bahía La Choya falls within the 271-366 days range, representing 90.2% of listings. This suggests many properties have significant open periods on their calendars.
- Approximately 96.1% of listings show high availability (181+ days open annually), indicating potential for increased bookings or specific owner usage patterns.
- For booked days, the 1-30 days range is most frequent in Bahía La Choya (52.9%), reflecting common guest stay durations or potential owner blocking patterns.
- A notable 4.0% of properties secure long booking periods (181+ days booked per year), highlighting successful long-term rental strategies or significant owner usage.
Bahía La Choya Airbnb Minimum Stay Requirements Analysis
Distribution of Listings by Minimum Night Requirement
1 Night
11 listings
21.6% of total
2 Nights
25 listings
49% of total
3 Nights
4 listings
7.8% of total
30+ Nights
11 listings
21.6% of total
Key Insights
- The most prevalent minimum stay requirement in Bahía La Choya is 2 Nights, adopted by 49% of listings. This highlights the market's preference for shorter, flexible bookings.
- A strong majority (70.6%) of the Bahía La Choya Airbnb data shows acceptance of very short stays (1-2 nights), indicating a dynamic, high-turnover market.
- A significant segment (21.6%) caters to monthly stays (30+ nights) in Bahía La Choya, pointing to opportunities in the extended-stay market.
Recommendations
- Align with the market by considering a 2 Nights minimum stay, as 49% of Bahía La Choya hosts use this setting.
- If feasible, allowing 1-night stays, especially midweek or during low season, could capture last-minute bookings, as only 21.6% currently do.
- Explore offering discounts for stays of 30+ nights to attract the 21.6% of the market seeking extended stays.
- Adjust minimum nights based on seasonality – potentially shorter during low season and longer during peak demand periods in Bahía La Choya.
Bahía La Choya Airbnb Cancellation Policy Trends Analysis (2026)
Super Strict 30 Days
8 listings
15.7% of total
Limited
1 listings
2% of total
Flexible
11 listings
21.6% of total
Moderate
13 listings
25.5% of total
Firm
12 listings
23.5% of total
Strict
6 listings
11.8% of total
Cancellation Policy Insights for Bahía La Choya
- The prevailing Airbnb cancellation policy trend in Bahía La Choya is Moderate, used by 25.5% of listings.
- There's a relatively balanced mix between guest-friendly (47.1%) and stricter (35.3%) policies, offering choices for different guest needs.
Recommendations for Hosts
- Consider adopting a Moderate policy to align with the 25.5% market standard in Bahía La Choya.
- Using a Strict policy might deter some guests, as only 11.8% of listings use it. Evaluate if potential revenue protection outweighs possible lower booking rates.
- Regularly review your cancellation policy against competitors and market demand shifts in Bahía La Choya.
Bahía La Choya STR Booking Lead Time Analysis (2026)
Average Booking Lead Time by Month
Booking Lead Time Insights for Bahía La Choya
- The overall average booking lead time for vacation rentals in Bahía La Choya is 41 days.
- Guests book furthest in advance for stays during November (average 56 days), likely coinciding with peak travel demand or local events.
- The shortest booking windows occur for stays in September (average 21 days), indicating more last-minute travel plans during this time.
- Seasonally, Fall (42 days avg.) sees the longest lead times, while Summer (30 days avg.) has the shortest, reflecting typical travel planning cycles.
Recommendations for Hosts
- Use the overall average lead time (41 days) as a baseline for your pricing and availability strategy in Bahía La Choya.
- For November stays, consider implementing length-of-stay discounts or slightly higher rates for bookings made less than 56 days out to capitalize on advance planning.
- Target marketing efforts for the Fall season well in advance (at least 42 days) to capture early planners.
- Monitor your own booking lead times against these Bahía La Choya averages to identify opportunities for dynamic pricing adjustments.
Popular & Essential Airbnb Amenities in Bahía La Choya (2026)
Amenity Prevalence
Amenity Insights for Bahía La Choya
- Essential amenities in Bahía La Choya that guests expect include: Air conditioning, Wifi, Hot water, Dishes and silverware. Lacking these (any) could significantly impact bookings.
- Popular amenities like Heating, Coffee maker, Kitchen are common but not universal. Offering these can provide a competitive edge.
Recommendations for Hosts
- Ensure your listing includes all essential amenities for Bahía La Choya: Air conditioning, Wifi, Hot water, Dishes and silverware.
- Prioritize adding missing essentials: Wifi, Hot water, Dishes and silverware.
- Consider adding popular differentiators like Heating or Coffee maker to increase appeal.
- Highlight unique or less common amenities you offer (e.g., hot tub, dedicated workspace, EV charger) in your listing description and photos.
- Regularly check competitor amenities in Bahía La Choya to stay competitive.
Bahía La Choya Airbnb Guest Demographics & Profile Analysis (2026)
Guest Profile Summary for Bahía La Choya
- The typical guest profile for Airbnb in Bahía La Choya consists of predominantly international visitors (92%), with top international origins including Mexico, typically belonging to the Post-2000s (Gen Z/Alpha) group (50%), primarily speaking English or Spanish.
- Domestic travelers account for 7.9% of guests.
- Key international markets include United States (91.1%) and Mexico (7.9%).
- Top languages spoken are English (60.3%) followed by Spanish (27.6%).
- A significant demographic segment is the Post-2000s (Gen Z/Alpha) group, representing 50% of guests.
Recommendations for Hosts
- Focus marketing internationally, particularly towards travelers from Mexico.
- Tailor amenities and listing descriptions to appeal to the dominant Post-2000s (Gen Z/Alpha) demographic (e.g., highlight fast WiFi, smart home features, local guides).
- Highlight unique local experiences or amenities relevant to the primary guest profile.
- Consider seasonal promotions aligned with peak travel times for key origin markets.
Nearby Short-Term Rental Market Comparison
How does the Bahía La Choya Airbnb market stack up against its neighbors? Compare key performance metrics like average monthly revenue, ADR, and occupancy rates in surrounding areas to understand the broader regional STR landscape.
| Market | Active Properties | Monthly Revenue | Daily Rate | Avg. Occupancy |
|---|---|---|---|---|
| Playa Encanto | 86 | $2,191 | $297.59 | 31% |
| Las Conchas | 148 | $1,765 | $289.28 | 26% |
| Yuma | 348 | $1,404 | $143.12 | 43% |
| Rocky Point | 1,822 | $1,395 | $234.57 | 26% |
| San Luis | 16 | $1,255 | $125.91 | 39% |
| Fortuna Foothills | 136 | $1,154 | $131.14 | 43% |
| Puerto Penasco | 231 | $1,128 | $250.21 | 25% |
| Ajo | 19 | $877 | $105.13 | 40% |
| Somerton | 13 | $850 | $114.30 | 40% |
| San Felipe | 352 | $805 | $213.90 | 21% |