Xilitla Airbnb Market Analysis 2026: Short Term Rental Data & Vacation Rental Statistics in San Luis Potosí, Mexico
Is Airbnb profitable in Xilitla in 2026? Explore comprehensive Airbnb analytics for Xilitla, San Luis Potosí, Mexico to uncover income potential. This 2026 STR market report for Xilitla, based on AirROI data from February 2025 to January 2026, reveals key trends in the niche market of 145 active listings.
Whether you're considering an Airbnb investment in Xilitla, optimizing your existing vacation rental, or exploring rental arbitrage opportunities, understanding the Xilitla Airbnb data is crucial. Leveraging the low regulation environment is key to maximizing your short term rental income potential. Let's dive into the specifics.
Key Xilitla Airbnb Performance Metrics Overview
Monthly Airbnb Revenue Variations & Income Potential in Xilitla (2026)
Understanding the monthly revenue variations for Airbnb listings in Xilitla is key to maximizing your short term rental income potential. Seasonality significantly impacts earnings. Our analysis, based on data from the past 12 months, shows that the peak revenue month for STRs in Xilitla is typically December, while October often presents the lowest earnings, highlighting opportunities for strategic pricing adjustments during shoulder and low seasons. Explore the typical Airbnb income in Xilitla across different performance tiers:
- Best-in-class properties (Top 10%) achieve $874+ monthly, often utilizing dynamic pricing and superior guest experiences.
- Strong performing properties (Top 25%) earn $403 or more, indicating effective management and desirable locations/amenities.
- Typical properties (Median) generate around $201 per month, representing the average market performance.
- Entry-level properties (Bottom 25%) see earnings around $101, often with potential for optimization.
Average Monthly Airbnb Earnings Trend in Xilitla
Xilitla Airbnb Occupancy Rate Trends (2026)
Maximize your bookings by understanding the Xilitla STR occupancy trends. Seasonal demand shifts significantly influence how often properties are booked. Typically, Aprilsees the highest demand (peak season occupancy), while September experiences the lowest (low season). Effective strategies, like adjusting minimum stays or offering promotions, can boost occupancy during slower periods. Here's how different property tiers perform in Xilitla:
- Best-in-class properties (Top 10%) achieve 35%+ occupancy, indicating high desirability and potentially optimized availability.
- Strong performing properties (Top 25%) maintain 22% or higher occupancy, suggesting good market fit and guest satisfaction.
- Typical properties (Median) have an occupancy rate around 11%.
- Entry-level properties (Bottom 25%) average 6% occupancy, potentially facing higher vacancy.
Average Monthly Occupancy Rate Trend in Xilitla
Average Daily Rate (ADR) Airbnb Trends in Xilitla (2026)
Effective short term rental pricing strategy in Xilitla involves understanding monthly ADR fluctuations. The Average Daily Rate (ADR) for Airbnb in Xilitla typically peaks in January and dips lowest during February. Leveraging Airbnb dynamic pricing tools or strategies based on this seasonality can significantly boost revenue. Here's a look at the typical nightly rates achieved:
- Best-in-class properties (Top 10%) command rates of $113+ per night, often due to premium features or locations.
- Strong performing properties (Top 25%) achieve nightly rates of $76 or more.
- Typical properties (Median) charge around $53 per night.
- Entry-level properties (Bottom 25%) earn around $39 per night.
Average Daily Rate (ADR) Trend by Month in Xilitla
Get Live Xilitla Market Intelligence 👇

Explore Real-time Analytics
Airbnb Seasonality Analysis & Trends in Xilitla (2026)
Peak Season (December, April, July)
- Revenue averages $519 per month
- Occupancy rates average 22.5%
- Daily rates average $68
Shoulder Season
- Revenue averages $356 per month
- Occupancy maintains around 15.9%
- Daily rates hold near $67
Low Season (January, September, October)
- Revenue drops to average $299 per month
- Occupancy decreases to average 11.5%
- Daily rates adjust to average $70
Seasonality Insights for Xilitla
- The Airbnb seasonality in Xilitla shows highly seasonal trends requiring careful strategy. While the sections above show seasonal averages, it's also insightful to look at the extremes:
- During the high season, the absolute peak month showcases Xilitla's highest earning potential, with monthly revenues capable of climbing to $579, occupancy reaching a high of 27.4%, and ADRs peaking at $71.
- Conversely, the slowest single month of the year, typically falling within the low season, marks the market's lowest point. In this month, revenue might dip to $289, occupancy could drop to 11.3%, and ADRs may adjust down to $65.
- Understanding both the seasonal averages and these monthly peaks and troughs in revenue, occupancy, and ADR is crucial for maximizing your Airbnb profit potential in Xilitla.
Seasonal Strategies for Maximizing Profit
- Peak Season: Maximize revenue through premium pricing and potentially longer minimum stays. Ensure high availability.
- Low Season: Offer competitive pricing, special promotions (e.g., extended stay discounts), and flexible cancellation policies. Target off-season travelers like remote workers or budget-conscious guests.
- Shoulder Seasons: Implement dynamic pricing that balances peak and low rates. Target weekend travelers or specific events. Offer slightly more flexible terms than peak season.
- Regularly analyze your own performance against these Xilitla seasonality benchmarks and adjust your pricing and availability strategy accordingly.
Best Areas for Airbnb Investment in Xilitla (2026)
Exploring the top neighborhoods for short-term rentals in Xilitla? This section highlights key areas, outlining why they are attractive for hosts and guests, along with notable local attractions. Consider these locations based on your target guest profile and investment strategy.
| Neighborhood / Area | Why Host Here? (Target Guests & Appeal) | Key Attractions & Landmarks |
|---|---|---|
| Las Pozas | A surrealist garden created by Edward James, attracting tourists interested in art and nature. It's a unique spot that showcases incredible architecture amidst a lush tropical landscape. | Las Pozas, Edward James' Surrealist Sculptures, Jungle Trails, Waterfalls, Botanical Gardens |
| Xilitla Town Center | The central area of Xilitla where visitors can experience local culture, traditional cuisine, and vibrant markets. It's a convenient location for accessing various attractions in the region. | Local Markets, Traditional Food Stalls, Xilitla Church, Plaza Principal |
| El Salto Waterfall | A stunning natural attraction located near Xilitla, popular for hiking and swimming. Ideal for tourists looking for adventure and scenic beauty. | El Salto Waterfall, Hiking Trails, Natural Swimming Holes |
| Museum of Edward James | A museum dedicated to the life and works of Edward James, providing insights into the surrealist artist's contributions and a deeper understanding of Las Pozas. | Museum of Edward James, Art Exhibits, Guided Tours |
| Sierra Madre Oriental | The surrounding mountainous region offers breathtaking views and opportunities for ecotourism and outdoor activities. It attracts nature lovers and adventure seekers. | Hiking, Camping, Bird Watching, Scenic Views |
| Cueva de los Suenos | A cave with mystical elements and beautiful rock formations, appealing to those interested in natural wonders and adventure tourism. | Cueva de los Suenos, Cave Exploring, Photography |
| Local Art and Handicrafts | Xilitla has a vibrant art scene with local artisans creating unique crafts. Visitors are drawn here for souvenirs and to support local artists. | Artisan Shops, Handcrafted Souvenirs, Cultural Art Events |
| Pueblo Fantasma | An abandoned village highlighting historical and cultural aspects of the region, attracting tourists interested in history and exploration. | Pueblo Fantasma, Historical Tours, Photography Opportunities |
Understanding Airbnb License Requirements & STR Laws in Xilitla (2026)
While Xilitla, San Luis Potosí, Mexico currently shows low STR regulations, specific Airbnb license requirements might still exist or change. Always verify the latest short term rental regulations and Airbnb license requirements directly with local government authorities for Xilitla to ensure full compliance before hosting.
(Source: AirROI data, 2026, finding no licensed listings among those analyzed)
Top Performing Airbnb Properties in Xilitla (2026)
Benchmark your potential! Explore examples of top-performing Airbnb properties in Xilitlabased on Trailing Twelve Month (TTM) revenue. Analyze their characteristics, revenue, occupancy rate, and ADR to understand what drives success in this market.
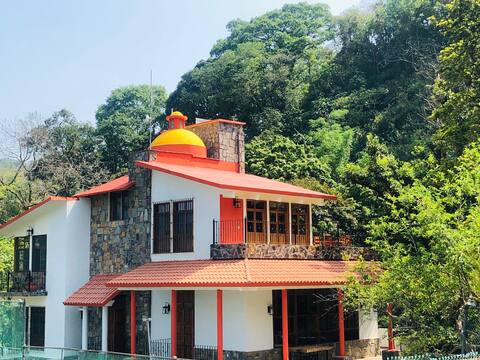
Casa Dají
Entire Place • 5 bedrooms
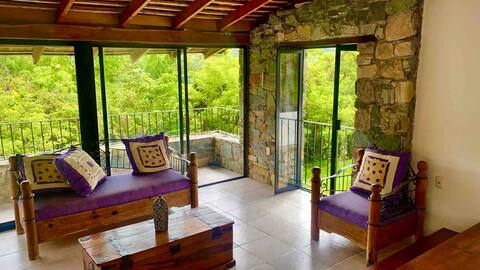
Casa Camino a Las Pozas, Xilitla, SLP
Entire Place • 3 bedrooms
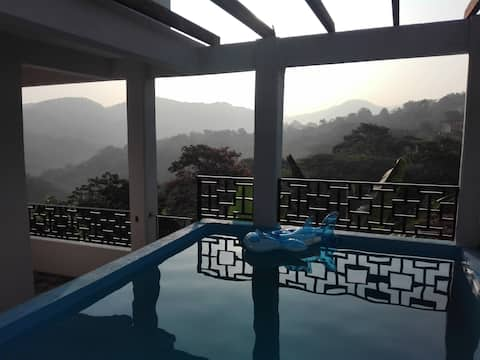
Casa Corazón Xilitla, S.L.P.
Entire Place • 4 bedrooms

Casa Cayos
Entire Place • 4 bedrooms

24/7 stay 10 guests
Entire Place • 3 bedrooms

Rooms with kitchenette 24/7 (guests 15-20)
Entire Place • 4 bedrooms
Note: Performance varies based on location, size, amenities, seasonality, and management quality. Data reflects the past 12 months.
Top Performing Airbnb Hosts in Xilitla (2026)
Learn from the best! This table showcases top-performing Airbnb hosts in Xilitla based on the number of properties managed and estimated total revenue over the past year. Analyze their scale and performance metrics.
| Host Name | Properties | Grossing Revenue | Stay Reviews | Avg Rating |
|---|---|---|---|---|
| Lizbeth | 18 | $81,440 | 1296 | 4.81/5.0 |
| Silvia | 1 | $38,665 | 66 | 4.94/5.0 |
| Viviana Isabel | 4 | $31,660 | 121 | 4.90/5.0 |
| Jorge Damian | 9 | $22,877 | 90 | 4.42/5.0 |
| Cervecería James | 7 | $19,144 | 28 | 4.55/5.0 |
| Ivanna | 7 | $14,921 | 46 | 4.39/5.0 |
| Brandon Samuel | 7 | $14,335 | 117 | 4.68/5.0 |
| Jesús Gustavo | 1 | $13,988 | 557 | 4.80/5.0 |
| Gustavo | 1 | $13,436 | 12 | 4.92/5.0 |
| Brenda | 8 | $12,632 | 475 | 4.75/5.0 |
Analyzing the strategies of top hosts, such as their property selection, pricing, and guest communication, can offer valuable lessons for optimizing your own Airbnb operations in Xilitla.
Dive Deeper: Advanced Xilitla STR Market Data (2026)
Ready to unlock more insights? AirROI provides access to advanced metrics and comprehensive Airbnb data for Xilitla. Explore detailed analytics beyond this report to refine your investment strategy, optimize pricing, and maximize your vacation rental profits.
Explore Advanced MetricsXilitla Short-Term Rental Market Composition (2026): Property & Room Types
Room Type Distribution
Property Type Distribution
Market Composition Insights for Xilitla
- The Xilitla Airbnb market composition is heavily skewed towards Private Room listings, which make up 70.3% of the 145 active rentals. This indicates strong guest preference for privacy and space.
- Looking at the property type distribution in Xilitla, Hotel/Boutique properties are the most common (40%), reflecting the local real estate landscape.
- Houses represent a significant 18.6% portion, catering likely to families or larger groups.
- The presence of 40% Hotel/Boutique listings indicates integration with traditional hospitality.
- Smaller segments like others, unique stays (combined 5.5%) offer potential for unique stay experiences.
Xilitla Airbnb Room Capacity Analysis (2026): Bedroom Distribution
Distribution of Listings by Number of Bedrooms
Room Capacity Insights for Xilitla
- The dominant room capacity in Xilitla is 1 bedroom listings, making up 57.9% of the market. This suggests a strong demand for properties suitable for couples or solo travelers.
- Together, 1 bedroom and 2 bedrooms properties represent 71.7% of the active Airbnb listings in Xilitla, indicating a high concentration in these sizes.
- With over half the market (57.9%) consisting of studios or 1-bedroom units, Xilitla is particularly well-suited for individuals or couples.
Xilitla Vacation Rental Guest Capacity Trends (2026)
Distribution of Listings by Guest Capacity
Guest Capacity Insights for Xilitla
- The most common guest capacity trend in Xilitla vacation rentals is listings accommodating 4 guests (32.4%). This suggests the primary traveler segment is likely small families or groups.
- Properties designed for 4 guests and 2 guests dominate the Xilitla STR market, accounting for 53.8% of listings.
- 17.9% of properties accommodate 6+ guests, serving the market segment for larger families or group travel in Xilitla.
- On average, properties in Xilitla are equipped to host 3.3 guests.
Xilitla Airbnb Booking Patterns (2026): Available vs. Booked Days
Available Days Distribution
Booked Days Distribution
Booking Pattern Insights for Xilitla
- The most common availability pattern in Xilitla falls within the 271-366 days range, representing 93.1% of listings. This suggests many properties have significant open periods on their calendars.
- Approximately 99.3% of listings show high availability (181+ days open annually), indicating potential for increased bookings or specific owner usage patterns.
- For booked days, the 1-30 days range is most frequent in Xilitla (57.9%), reflecting common guest stay durations or potential owner blocking patterns.
- A notable 0.7% of properties secure long booking periods (181+ days booked per year), highlighting successful long-term rental strategies or significant owner usage.
Xilitla Airbnb Minimum Stay Requirements Analysis
Distribution of Listings by Minimum Night Requirement
1 Night
128 listings
88.3% of total
2 Nights
12 listings
8.3% of total
30+ Nights
5 listings
3.4% of total
Key Insights
- The most prevalent minimum stay requirement in Xilitla is 1 Night, adopted by 88.3% of listings. This highlights the market's preference for shorter, flexible bookings.
- A strong majority (96.6%) of the Xilitla Airbnb data shows acceptance of very short stays (1-2 nights), indicating a dynamic, high-turnover market.
Recommendations
- Align with the market by considering a 1 Night minimum stay, as 88.3% of Xilitla hosts use this setting.
- Adjust minimum nights based on seasonality – potentially shorter during low season and longer during peak demand periods in Xilitla.
Xilitla Airbnb Cancellation Policy Trends Analysis (2026)
Flexible
77 listings
53.8% of total
Moderate
27 listings
18.9% of total
Firm
37 listings
25.9% of total
Strict
2 listings
1.4% of total
Cancellation Policy Insights for Xilitla
- The prevailing Airbnb cancellation policy trend in Xilitla is Flexible, used by 53.8% of listings.
- The market strongly favors guest-friendly terms, with 72.7% of listings offering Flexible or Moderate policies. This suggests guests in Xilitla may expect booking flexibility.
- Strict cancellation policies are quite rare (1.4%), potentially making listings with this policy less competitive unless justified by high demand or property type.
Recommendations for Hosts
- Consider adopting a Flexible policy to align with the 53.8% market standard in Xilitla.
- Given the high prevalence of Flexible policies (53.8%), offering this can enhance booking appeal, especially during shoulder seasons.
- Using a Strict policy might deter some guests, as only 1.4% of listings use it. Evaluate if potential revenue protection outweighs possible lower booking rates.
- Regularly review your cancellation policy against competitors and market demand shifts in Xilitla.
Xilitla STR Booking Lead Time Analysis (2026)
Average Booking Lead Time by Month
Booking Lead Time Insights for Xilitla
- The overall average booking lead time for vacation rentals in Xilitla is 24 days.
- Guests book furthest in advance for stays during November (average 45 days), likely coinciding with peak travel demand or local events.
- The shortest booking windows occur for stays in January (average 13 days), indicating more last-minute travel plans during this time.
- Seasonally, Fall (34 days avg.) sees the longest lead times, while Winter (16 days avg.) has the shortest, reflecting typical travel planning cycles.
Recommendations for Hosts
- Use the overall average lead time (24 days) as a baseline for your pricing and availability strategy in Xilitla.
- For November stays, consider implementing length-of-stay discounts or slightly higher rates for bookings made less than 45 days out to capitalize on advance planning.
- During January, focus on last-minute booking availability and promotions, as guests book with very short notice (13 days avg.).
- Target marketing efforts for the Fall season well in advance (at least 34 days) to capture early planners.
- Monitor your own booking lead times against these Xilitla averages to identify opportunities for dynamic pricing adjustments.
Popular & Essential Airbnb Amenities in Xilitla (2026)
Amenity Prevalence
Amenity Insights for Xilitla
- Popular amenities like Wifi, TV, Essentials are common but not universal. Offering these can provide a competitive edge.
- Warning: Wifi is not universally provided but is considered essential globally. Ensure reliable Wifi is offered.
Recommendations for Hosts
- Consider adding popular differentiators like Wifi or TV to increase appeal.
- Highlight unique or less common amenities you offer (e.g., hot tub, dedicated workspace, EV charger) in your listing description and photos.
- Regularly check competitor amenities in Xilitla to stay competitive.
Xilitla Airbnb Guest Demographics & Profile Analysis (2026)
Guest Profile Summary for Xilitla
- The typical guest profile for Airbnb in Xilitla consists of primarily domestic travelers (85%), often arriving from nearby Mexico City, typically belonging to the Post-2000s (Gen Z/Alpha) group (50%), primarily speaking Spanish or English.
- Domestic travelers account for 84.9% of guests.
- Key international markets include Mexico (84.9%) and United States (9.4%).
- Top languages spoken are Spanish (50.4%) followed by English (35.8%).
- A significant demographic segment is the Post-2000s (Gen Z/Alpha) group, representing 50% of guests.
Recommendations for Hosts
- Target domestic marketing efforts towards travelers from Mexico City and San Luis Potosi.
- Tailor amenities and listing descriptions to appeal to the dominant Post-2000s (Gen Z/Alpha) demographic (e.g., highlight fast WiFi, smart home features, local guides).
- Highlight unique local experiences or amenities relevant to the primary guest profile.
- Consider seasonal promotions aligned with peak travel times for key origin markets.
Nearby Short-Term Rental Market Comparison
How does the Xilitla Airbnb market stack up against its neighbors? Compare key performance metrics like average monthly revenue, ADR, and occupancy rates in surrounding areas to understand the broader regional STR landscape.
| Market | Active Properties | Monthly Revenue | Daily Rate | Avg. Occupancy |
|---|---|---|---|---|
| La Tortuga | 71 | $1,658 | $239.12 | 28% |
| Velamar | 12 | $1,474 | $286.53 | 24% |
| Tzibantzá | 12 | $1,298 | $232.99 | 23% |
| Ezequiel Montes | 33 | $1,096 | $137.22 | 23% |
| Tequisquiapan | 375 | $996 | $157.05 | 25% |
| Terrenos del Lote "La Isla" | 39 | $990 | $139.28 | 24% |
| Pinal de Amoles | 50 | $972 | $122.11 | 32% |
| Mineral del Chico | 100 | $947 | $124.78 | 29% |
| Altamira | 99 | $829 | $159.00 | 29% |
| San José Ocotillos | 62 | $802 | $117.30 | 23% |