Bacalar Airbnb Market Analysis 2026: Short Term Rental Data & Vacation Rental Statistics in Quintana Roo, Mexico
Is Airbnb profitable in Bacalar in 2026? Explore comprehensive Airbnb analytics for Bacalar, Quintana Roo, Mexico to uncover income potential. This 2026 STR market report for Bacalar, based on AirROI data from February 2025 to January 2026, reveals key trends in the market of 804 active listings.
Whether you're considering an Airbnb investment in Bacalar, optimizing your existing vacation rental, or exploring rental arbitrage opportunities, understanding the Bacalar Airbnb data is crucial. Leveraging the low regulation environment is key to maximizing your short term rental income potential. Let's dive into the specifics.
Key Bacalar Airbnb Performance Metrics Overview
Monthly Airbnb Revenue Variations & Income Potential in Bacalar (2026)
Understanding the monthly revenue variations for Airbnb listings in Bacalar is key to maximizing your short term rental income potential. Seasonality significantly impacts earnings. Our analysis, based on data from the past 12 months, shows that the peak revenue month for STRs in Bacalar is typically April, while September often presents the lowest earnings, highlighting opportunities for strategic pricing adjustments during shoulder and low seasons. Explore the typical Airbnb income in Bacalar across different performance tiers:
- Best-in-class properties (Top 10%) achieve $3,259+ monthly, often utilizing dynamic pricing and superior guest experiences.
- Strong performing properties (Top 25%) earn $1,843 or more, indicating effective management and desirable locations/amenities.
- Typical properties (Median) generate around $835 per month, representing the average market performance.
- Entry-level properties (Bottom 25%) see earnings around $379, often with potential for optimization.
Average Monthly Airbnb Earnings Trend in Bacalar
Bacalar Airbnb Occupancy Rate Trends (2026)
Maximize your bookings by understanding the Bacalar STR occupancy trends. Seasonal demand shifts significantly influence how often properties are booked. Typically, Februarysees the highest demand (peak season occupancy), while September experiences the lowest (low season). Effective strategies, like adjusting minimum stays or offering promotions, can boost occupancy during slower periods. Here's how different property tiers perform in Bacalar:
- Best-in-class properties (Top 10%) achieve 73%+ occupancy, indicating high desirability and potentially optimized availability.
- Strong performing properties (Top 25%) maintain 55% or higher occupancy, suggesting good market fit and guest satisfaction.
- Typical properties (Median) have an occupancy rate around 33%.
- Entry-level properties (Bottom 25%) average 16% occupancy, potentially facing higher vacancy.
Average Monthly Occupancy Rate Trend in Bacalar
Average Daily Rate (ADR) Airbnb Trends in Bacalar (2026)
Effective short term rental pricing strategy in Bacalar involves understanding monthly ADR fluctuations. The Average Daily Rate (ADR) for Airbnb in Bacalar typically peaks in January and dips lowest during May. Leveraging Airbnb dynamic pricing tools or strategies based on this seasonality can significantly boost revenue. Here's a look at the typical nightly rates achieved:
- Best-in-class properties (Top 10%) command rates of $259+ per night, often due to premium features or locations.
- Strong performing properties (Top 25%) achieve nightly rates of $155 or more.
- Typical properties (Median) charge around $87 per night.
- Entry-level properties (Bottom 25%) earn around $50 per night.
Average Daily Rate (ADR) Trend by Month in Bacalar
Get Live Bacalar Market Intelligence 👇

Explore Real-time Analytics
Airbnb Seasonality Analysis & Trends in Bacalar (2026)
Peak Season (April, March, July)
- Revenue averages $1,806 per month
- Occupancy rates average 43.3%
- Daily rates average $134
Shoulder Season
- Revenue averages $1,569 per month
- Occupancy maintains around 37.2%
- Daily rates hold near $139
Low Season (June, September, October)
- Revenue drops to average $1,241 per month
- Occupancy decreases to average 29.0%
- Daily rates adjust to average $135
Seasonality Insights for Bacalar
- The Airbnb seasonality in Bacalar shows moderate seasonality with distinct peak and low periods. While the sections above show seasonal averages, it's also insightful to look at the extremes:
- During the high season, the absolute peak month showcases Bacalar's highest earning potential, with monthly revenues capable of climbing to $1,830, occupancy reaching a high of 48.2%, and ADRs peaking at $148.
- Conversely, the slowest single month of the year, typically falling within the low season, marks the market's lowest point. In this month, revenue might dip to $1,089, occupancy could drop to 26.7%, and ADRs may adjust down to $131.
- Understanding both the seasonal averages and these monthly peaks and troughs in revenue, occupancy, and ADR is crucial for maximizing your Airbnb profit potential in Bacalar.
Seasonal Strategies for Maximizing Profit
- Peak Season: Maximize revenue through premium pricing and potentially longer minimum stays. Ensure high availability.
- Low Season: Offer competitive pricing, special promotions (e.g., extended stay discounts), and flexible cancellation policies. Target off-season travelers like remote workers or budget-conscious guests.
- Shoulder Seasons: Implement dynamic pricing that balances peak and low rates. Target weekend travelers or specific events. Offer slightly more flexible terms than peak season.
- Regularly analyze your own performance against these Bacalar seasonality benchmarks and adjust your pricing and availability strategy accordingly.
Best Areas for Airbnb Investment in Bacalar (2026)
Exploring the top neighborhoods for short-term rentals in Bacalar? This section highlights key areas, outlining why they are attractive for hosts and guests, along with notable local attractions. Consider these locations based on your target guest profile and investment strategy.
| Neighborhood / Area | Why Host Here? (Target Guests & Appeal) | Key Attractions & Landmarks |
|---|---|---|
| Laguna Bacalar | Bacalar is home to the stunning Bacalar Lagoon, known for its striking blue waters and beautiful natural scenery. It's a perfect spot for tourists looking for adventure and relaxation by the lagoon. | Bacalar Lagoon, Cenote Azul, Fuerte de San Felipe, Kayaking and paddleboarding, Birdwatching, Eco-parks |
| Centro Bacalar | The center of Bacalar offers a mix of local culture, shops, and restaurants. It's a vibrant area that attracts visitors looking to explore the town's charm and history. | Main Square, Historic San Felipe Fort, Local Markets, Restaurants and Cafés, Artisan Shops |
| Cenote de los Piratas | A secluded area known for its unique cenote and beautiful natural surroundings. This location attracts tourists seeking a more off-the-beaten-path experience. | Cenote de los Piratas, Swimming and diving, Nature trails, Relaxation spots |
| Cayo Culebra | An idyllic spot on the lagoon that's perfect for a private getaway. It offers stunning views and a tranquil environment for relaxation and water activities. | Cayo Culebra, Snorkeling, Sunbathing, Kayaking |
| Sierra del Baúl | Nearby mountain area offering beautiful views and nature trails. Attracts tourists interested in hiking and exploring the natural beauty of the region. | Hiking trails, Nature reserves, Birdwatching |
| Cenote Esmeralda | Known for its beautiful emerald-colored waters, this cenote is a popular spot for swimming and relaxation. It's a favorite among visitors seeking a unique experience. | Cenote Esmeralda, Swimming, Relaxation areas |
| Fraccionamiento Santa Rita | A residential area close to Bacalar’s main attractions, making it convenient for tourists while providing a quieter atmosphere for relaxation. | Local parks, Restaurants, Access to marina |
| Playa de Bacalar | The public beach area along the lagoon is a popular spot for locals and tourists to relax, swim, and enjoy the sun, making it a lively place to stay while visiting Bacalar. | Beach activities, Sunsets, Local food vendors, Relaxing spots |
Understanding Airbnb License Requirements & STR Laws in Bacalar (2026)
While Bacalar, Quintana Roo, Mexico currently shows low STR regulations, specific Airbnb license requirements might still exist or change. Always verify the latest short term rental regulations and Airbnb license requirements directly with local government authorities for Bacalar to ensure full compliance before hosting.
(Source: AirROI data, 2026, based on 0% licensed listings)
Top Performing Airbnb Properties in Bacalar (2026)
Benchmark your potential! Explore examples of top-performing Airbnb properties in Bacalarbased on Trailing Twelve Month (TTM) revenue. Analyze their characteristics, revenue, occupancy rate, and ADR to understand what drives success in this market.
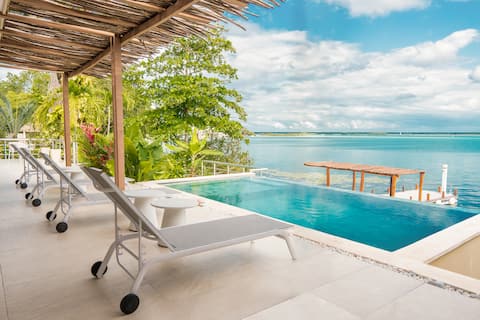
Casa Sol y Luna - Sunrises and an infinity pool.
Entire Place • 4 bedrooms
House next to the Bacalar Lagoon
Entire Place • 5 bedrooms

Beautiful and spacious house on the shore of the lagoon
Entire Place • 6 bedrooms

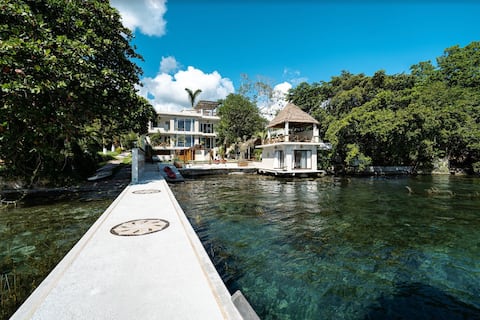
Lagoonfront Villa • Private Pier • 100% Eco
Entire Place • 3 bedrooms

Almendro de Agua House
Entire Place • 4 bedrooms

Casa Lole with Private Dock in Bacalar
Entire Place • 5 bedrooms
Note: Performance varies based on location, size, amenities, seasonality, and management quality. Data reflects the past 12 months.
Top Performing Airbnb Hosts in Bacalar (2026)
Learn from the best! This table showcases top-performing Airbnb hosts in Bacalar based on the number of properties managed and estimated total revenue over the past year. Analyze their scale and performance metrics.
| Host Name | Properties | Grossing Revenue | Stay Reviews | Avg Rating |
|---|---|---|---|---|
| Mi Querido Bacalar | 5 | $476,025 | 189 | 4.79/5.0 |
| Katy | 15 | $348,781 | 1011 | 4.82/5.0 |
| Brillante | 2 | $345,826 | 68 | 4.96/5.0 |
| Salma | 7 | $308,461 | 1170 | 4.80/5.0 |
| Renee | 3 | $273,781 | 75 | 4.72/5.0 |
| Karla | 8 | $234,561 | 3513 | 4.88/5.0 |
| Claudia | 3 | $233,837 | 570 | 4.97/5.0 |
| Mariana | 4 | $221,563 | 320 | 4.92/5.0 |
| Azul Bacalar Property Manageme | 10 | $220,512 | 647 | 4.72/5.0 |
| Bakance Rentals | 12 | $196,411 | 236 | 4.93/5.0 |
Analyzing the strategies of top hosts, such as their property selection, pricing, and guest communication, can offer valuable lessons for optimizing your own Airbnb operations in Bacalar.
Dive Deeper: Advanced Bacalar STR Market Data (2026)
Ready to unlock more insights? AirROI provides access to advanced metrics and comprehensive Airbnb data for Bacalar. Explore detailed analytics beyond this report to refine your investment strategy, optimize pricing, and maximize your vacation rental profits.
Explore Advanced MetricsBacalar Short-Term Rental Market Composition (2026): Property & Room Types
Room Type Distribution
Property Type Distribution
Market Composition Insights for Bacalar
- The Bacalar Airbnb market composition is heavily skewed towards Private Room listings, which make up 51.4% of the 804 active rentals. This indicates strong guest preference for privacy and space.
- Looking at the property type distribution in Bacalar, Hotel/Boutique properties are the most common (29.6%), reflecting the local real estate landscape.
- Houses represent a significant 26.4% portion, catering likely to families or larger groups.
- The presence of 29.6% Hotel/Boutique listings indicates integration with traditional hospitality.
- Smaller segments like others, unique stays (combined 3.3%) offer potential for unique stay experiences.
Bacalar Airbnb Room Capacity Analysis (2026): Bedroom Distribution
Distribution of Listings by Number of Bedrooms
Room Capacity Insights for Bacalar
- The dominant room capacity in Bacalar is 1 bedroom listings, making up 56.3% of the market. This suggests a strong demand for properties suitable for couples or solo travelers.
- Together, 1 bedroom and 2 bedrooms properties represent 70.0% of the active Airbnb listings in Bacalar, indicating a high concentration in these sizes.
- With over half the market (56.3%) consisting of studios or 1-bedroom units, Bacalar is particularly well-suited for individuals or couples.
- Listings with 3+ bedrooms (9.9%) represent a smaller niche, potentially indicating an underserved market for larger group accommodations in Bacalar.
Bacalar Vacation Rental Guest Capacity Trends (2026)
Distribution of Listings by Guest Capacity
Guest Capacity Insights for Bacalar
- The most common guest capacity trend in Bacalar vacation rentals is listings accommodating 2 guests (31.8%). This suggests the primary traveler segment is likely couples or solo travelers.
- Properties designed for 2 guests and 4 guests dominate the Bacalar STR market, accounting for 51.5% of listings.
- 21.4% of properties accommodate 6+ guests, serving the market segment for larger families or group travel in Bacalar.
- On average, properties in Bacalar are equipped to host 3.4 guests.
Bacalar Airbnb Booking Patterns (2026): Available vs. Booked Days
Available Days Distribution
Booked Days Distribution
Booking Pattern Insights for Bacalar
- The most common availability pattern in Bacalar falls within the 271-366 days range, representing 55.6% of listings. This suggests many properties have significant open periods on their calendars.
- Approximately 84.2% of listings show high availability (181+ days open annually), indicating potential for increased bookings or specific owner usage patterns.
- For booked days, the 31-90 days range is most frequent in Bacalar (34.1%), reflecting common guest stay durations or potential owner blocking patterns.
- A notable 16.6% of properties secure long booking periods (181+ days booked per year), highlighting successful long-term rental strategies or significant owner usage.
Bacalar Airbnb Minimum Stay Requirements Analysis
Distribution of Listings by Minimum Night Requirement
1 Night
501 listings
62.3% of total
2 Nights
193 listings
24% of total
3 Nights
6 listings
0.7% of total
7-29 Nights
1 listings
0.1% of total
30+ Nights
103 listings
12.8% of total
Key Insights
- The most prevalent minimum stay requirement in Bacalar is 1 Night, adopted by 62.3% of listings. This highlights the market's preference for shorter, flexible bookings.
- A strong majority (86.3%) of the Bacalar Airbnb data shows acceptance of very short stays (1-2 nights), indicating a dynamic, high-turnover market.
- A significant segment (12.8%) caters to monthly stays (30+ nights) in Bacalar, pointing to opportunities in the extended-stay market.
Recommendations
- Align with the market by considering a 1 Night minimum stay, as 62.3% of Bacalar hosts use this setting.
- Explore offering discounts for stays of 30+ nights to attract the 12.8% of the market seeking extended stays.
- Adjust minimum nights based on seasonality – potentially shorter during low season and longer during peak demand periods in Bacalar.
Bacalar Airbnb Cancellation Policy Trends Analysis (2026)
Limited
5 listings
0.6% of total
Super Strict 30 Days
1 listings
0.1% of total
Flexible
322 listings
40.3% of total
Moderate
274 listings
34.3% of total
Firm
124 listings
15.5% of total
Strict
74 listings
9.3% of total
Cancellation Policy Insights for Bacalar
- The prevailing Airbnb cancellation policy trend in Bacalar is Flexible, used by 40.3% of listings.
- The market strongly favors guest-friendly terms, with 74.6% of listings offering Flexible or Moderate policies. This suggests guests in Bacalar may expect booking flexibility.
- Strict cancellation policies are quite rare (9.3%), potentially making listings with this policy less competitive unless justified by high demand or property type.
Recommendations for Hosts
- Consider adopting a Flexible policy to align with the 40.3% market standard in Bacalar.
- Using a Strict policy might deter some guests, as only 9.3% of listings use it. Evaluate if potential revenue protection outweighs possible lower booking rates.
- Regularly review your cancellation policy against competitors and market demand shifts in Bacalar.
Bacalar STR Booking Lead Time Analysis (2026)
Average Booking Lead Time by Month
Booking Lead Time Insights for Bacalar
- The overall average booking lead time for vacation rentals in Bacalar is 43 days.
- Guests book furthest in advance for stays during December (average 59 days), likely coinciding with peak travel demand or local events.
- The shortest booking windows occur for stays in May (average 33 days), indicating more last-minute travel plans during this time.
- Seasonally, Winter (52 days avg.) sees the longest lead times, while Spring (36 days avg.) has the shortest, reflecting typical travel planning cycles.
Recommendations for Hosts
- Use the overall average lead time (43 days) as a baseline for your pricing and availability strategy in Bacalar.
- For December stays, consider implementing length-of-stay discounts or slightly higher rates for bookings made less than 59 days out to capitalize on advance planning.
- Target marketing efforts for the Winter season well in advance (at least 52 days) to capture early planners.
- Monitor your own booking lead times against these Bacalar averages to identify opportunities for dynamic pricing adjustments.
Popular & Essential Airbnb Amenities in Bacalar (2026)
Amenity Prevalence
Amenity Insights for Bacalar
- Essential amenities in Bacalar that guests expect include: Wifi, Air conditioning. Lacking these (any) could significantly impact bookings.
- Popular amenities like Hot water, Essentials, Shampoo are common but not universal. Offering these can provide a competitive edge.
Recommendations for Hosts
- Ensure your listing includes all essential amenities for Bacalar: Wifi, Air conditioning.
- Prioritize adding missing essentials: Wifi, Air conditioning.
- Consider adding popular differentiators like Hot water or Essentials to increase appeal.
- Highlight unique or less common amenities you offer (e.g., hot tub, dedicated workspace, EV charger) in your listing description and photos.
- Regularly check competitor amenities in Bacalar to stay competitive.
Bacalar Airbnb Guest Demographics & Profile Analysis (2026)
Guest Profile Summary for Bacalar
- The typical guest profile for Airbnb in Bacalar consists of a mix of domestic (46%) and international guests, with top international origins including United States, typically belonging to the Post-2000s (Gen Z/Alpha) group (50%), primarily speaking English or Spanish.
- Domestic travelers account for 45.9% of guests.
- Key international markets include Mexico (45.9%) and United States (18.6%).
- Top languages spoken are English (39.9%) followed by Spanish (35.6%).
- A significant demographic segment is the Post-2000s (Gen Z/Alpha) group, representing 50% of guests.
Recommendations for Hosts
- Balance marketing efforts between domestic and international channels based on the guest mix.
- Tailor amenities and listing descriptions to appeal to the dominant Post-2000s (Gen Z/Alpha) demographic (e.g., highlight fast WiFi, smart home features, local guides).
- Highlight unique local experiences or amenities relevant to the primary guest profile.
- Consider seasonal promotions aligned with peak travel times for key origin markets.
Nearby Short-Term Rental Market Comparison
How does the Bacalar Airbnb market stack up against its neighbors? Compare key performance metrics like average monthly revenue, ADR, and occupancy rates in surrounding areas to understand the broader regional STR landscape.
| Market | Active Properties | Monthly Revenue | Daily Rate | Avg. Occupancy |
|---|---|---|---|---|
| Kate Subdivision | 13 | $2,924 | $346.23 | 37% |
| San Pedro Town | 667 | $2,922 | $324.04 | 37% |
| San Pedro | 44 | $2,911 | $402.68 | 33% |
| San Pedro | 94 | $2,209 | $282.54 | 36% |
| Caye Caulker Village | 356 | $1,975 | $173.01 | 42% |
| San Ignacio & Santa Elena | 156 | $1,379 | $134.66 | 38% |
| Buenavista | 33 | $1,203 | $261.52 | 24% |
| San Ignacio | 19 | $1,084 | $212.81 | 24% |
| San José | 23 | $983 | $172.04 | 24% |
| Belize City | 167 | $899 | $130.88 | 30% |